
ABSTRACT
Based on the Web of Science core database and using bibliometric analysis method, this study analysed 2,680 papers on rice and greenhouse gas topic research till to 22 July 2022, which included 47 highly cited papers and one hot paper, mainly written in English and from 10,116 authors, 2,594 organisations and 111 countries or territories, published in 517 journals and four book series. The top five journals are Science of the Total Environment, Journal of Cleaner Production, Agriculture and Ecosystems Environment, Environmental Science and Pollution Research and Sustainability. The top five countries were Peoples R China, U.S.A., India, Germany and Japan. The top five organisations were the Chinese Academy of Sciences, Nanjing Agricultural University, Indian Council of Agricultural Research, CGIAR and Chinese Academy of Agricultural Sciences, each with more than 126 papers. The top four authors were Wassmann Reiner, Pan Genxing, Smith Pete and Cao Cougui. All keywords were separated into 10 clusters with co-occurrence network visualisation using VOSviewer, and the research front was shown by co-occurrence overlay visualisation. The results will help researchers clarify the current research situation, but also provide guidance for future research in rice and greenhouse gases.
1. Introduction
In response to climate change, countries all over the world have enacted various policy measures to reduce greenhouse gas emissions to reduce the further rise in global average temperatures and reduce the risks and losses of climate change. Climate change, caused by the increase in concentrations of greenhouse gases (GHGs) in the atmosphere, is the most vital challenge faced by humanity. Agriculture is one of the most important economic sectors and responsible for both food and nutritional security, it is faced with the challenge of providing healthy food for a growing population at minimal environmental cost. However, it impacts directly or indirectly towards the global climate change by emitting greenhouse gases (Panchasara et al., Citation2021). Agricultural soil acts as a source and sink of important greenhouse gases (GHGs) like methane (CH4), nitrous oxide (N2O) and carbon dioxide (CO2).
Rice is the foremost staple food in the world, safeguarding the global food and nutritional security. Rice paddies have been a major concern to the scientific community because they produce the threatening and long-lasting GHGs, mainly CH4 and N2O. Around 30% and 11% of global agricultural CH4 and N2O, respectively, are emitted from rice fields (Gupta et al., Citation2021; Hussain et al., Citation2015). Methane, which accounts for 20–30% of the global warming effect, is second only to carbon dioxide (CO2) as the most significant GHG. The challenge is on ensuring that rice production increases are not associated with an increase in GHG emission intensities. Studies conducted in the Latin America and Caribbean region show intermittent irrigation or alternate wetting and drying of rice fields to reduce CH4 emissions by 25–70% without increasing N2O emissions. Compared to conventional tillage, no-tillage and anticipated tillage (i.e. fall tillage) cause a 21% and 25% reduction in CH4 emissions, respectively. A more realistic approach for realising low GHG emitting rice production systems is to focus on increasing rice yields, which should translate to a reduction in GHG emission intensities (Chirinda et al., Citation2018). The conceptual framework presented a visual representation of how various factors such as fertiliser application, water management practices, crop variety and soil type inter-relate to explain the factors that influence the level of greenhouse gas emissions from rice fields (Boateng et al., Citation2017).
Rises in atmospheric carbon dioxide (CO2) and water deficits are threatening global rice productivity and sustainability. Rice soils exposed to drought and elevated CO2 alter the biomass, diversity and activity of soil microorganisms affecting greenhouse gas (GHG) emission dynamics (Kumar et al., Citation2019). Water management under water deficit situation affects the aeration status of soil, which in turn regulates the rate and direction of nitrification and denitrification processes and can enhance N2O emissions, which might outweigh the benefit of reduced CH4 emissions. The timing and duration of midseason aeration affected the trade-off between CH4 and N2O emissions. This indicates that there was a potential for reducing GHGs emission from rice fields by adopting suitable water management practices. GHG flux from soil is significantly affected by soil conditions (e.g. organic matter content, bulk density, porosity and tillage), water management, fertiliser management, soil pH, pre-season water status and temperature, rice planting methods and rice cultivar selection (Kumar et al., Citation2019; Yagi et al., Citation2020). Soils under anaerobic conditions are favourable for CH4 production. In soil, N2O is produced through the microbial mechanism of nitrification and denitrification under aerobic and anaerobic conditions, respectively (Faiz-Ul Islam et al., Citation2020). Flooding condition in rice field emits a maximum amount of CH4, and a large amount of N2O is produced in intermittently flooded rice and under transition periods between crops (Pittelkow et al., Citation2013; Zhao et al., Citation2011). Nitrogen fertilisation level and water management are the main factors regulating N2O emission in the paddy soil.
Rice is grown under flooded soil conditions and uses more water and has higher GHG emissions than most crops. The alternate wetting and drying water management practices will maintain grain yields and concurrently reduce water use, greenhouse gas emissions and arsenic (As) levels in rice (Linquist et al., Citation2015). Average GHG emissions for US rice systems that include growing (and ratoon) and fallow seasons for both CH4 and N2O were estimated (Linquist et al., Citation2018). Elevated CH4 emissions in rice systems can lead to a high global warming potential (GWP) relative to other crops, thus strategies to reduce GHG emissions, particularly CH4, are needed. Altering water, residue (carbon) and fertiliser management practices are commonly suggested as options for mitigating GHG emissions in rice systems (Linquist et al., Citation2012).
In recent years, the bibliometric method is more frequently used in greenhouse gases research. For example, greenhouse gas research on a global scale from 2000 to 2014 (Yang et al., Citation2018), energy consumption and greenhouse gas emissions in the residential sector (Geng et al., Citation2017), co-benefits of greenhouse gas mitigation: a review and classification by type, mitigation sector, and geography (Deng et al., Citation2017), greenhouse gas emissions from landfills (Zhang et al., Citation2019). Bibliometric analysis technique has been adopted related with rice crop research such as Japanese rice (Morooka et al., Citation2014), rice physiology and management in China (Peng, Citation2017), global rice research during 1985–2014 (Liu et al., Citation2017), et al. Sun and Yuan have analysed rice with fertiliser based on Citespace (Sun & Yuan, Citation2019), rice with irrigation (Sun & Yuan, Citation2020a), the top papers in world rice research (Sun & Yuan, Citation2020b).
The purpose of this paper was to use bibliometric methods to analyse the publications of ‘rice’ and ‘greenhouse gases’ or ‘greenhouse gas’ topic research based on the Clarivate Analytics' Web of Science (WoS) core database. Co-authorship network visualisation of authors, organisations and countries and co-occurrence network visualisation of all keywords were done by VOSviewer. The co-occurrence network visualisation of all keywords shows different clusters on research topics, and the co-occurrence overly visualisation of all keywords shows the research trend and front by all keywords co-occurrence times in different annuals.
2. Materials and methods
2.1. Web of science
The publication counts from the WoS core collection were derived from the following databases: The Science Citation Index – Expanded (SCIE) – 1900-present, Social Science Citation Index (SSCI) − 1900-present, Conference Proceeding Citation Index-Science (CPCI-S) − 2015-present, Conference Proceedings Citation Index – Social Science & Humanities (CPCI-SSH) − 2015-present, Current Chemical Reactions (CCR-EXPANDED) −1985-present, Index Chemicus (IC) − 1993-present.
2.2. Data collection
The data collection was completed on 22 July 2022 to avoid bias. The keywords of ‘rice’ and ‘greenhouse gases’ or ‘greenhouse gas’ were used in the topic (TS).
The query as following: TS = ‘rice’ and ‘greenhouse gases’ or ‘greenhouse gas’.
Then, the results were refined by document types of Articles and Review articles. As a result, there are 2,680 papers from the WoS core collection. The records were downloaded and saved as plain text format by selecting the export format ‘full records and cited references’ and then imported into VOSviewer for further citation analysis. The impact factors (IF 2021 and IF 5 year) were taken from the Journal Citation Report (JCR 2021) published in June 2022, which had the latest data available (Clarivate, Journal Citation Reports ™ 2021, Citation2022a).
2.3. VOSviewer
VOSviewer is a free bibliometric visualiser with an intuitive and user-friendly interface. It was chosen because it can work with large sets of data and offer a range of analysis and investigation options, creating intuitive images that aid in evaluating data (van Eck & Waltman, Citation2010). In this paper, default parameter values of the VOSviewer (version 1.6.18; Van Eck & Waltman, Citation2022) are usually used in the analysis. The size of circles reflects the weight of an item. Distance between the items indicates the strength of relationships.
3. Results and discussion
3.1. Document type and language of publication
Based on Clarivate Analytics' WoS Index, all the 2,680 publications were identified in SCIE (2,652, 98.955%), SSCI (222, 8.284%), CPCI-S (65, 2.425%), Book Citation Index – Science (14, 0.522%), Arts and Humanities Citation Index (1, 0.037%) and CPCI-SSH (1, 0.037%). The document types of all papers were articles (2,438, 90.97%) and review articles (242, 9.03%), and also were proceedings papers (65, 2.425%), early access (34, 1.269%), book chapters (14, 0.522%), and data paper (3, 0.112%).
Among the all 2,680 papers, there are 47 top papers including of 47 highly cited papers and one hot paper over a 10-year and 4-month period: 1 January 2012–30 April 2022 (Clarivate, Citation2022b, Essential Science Indicators Help). All of the papers were almost published in English (2,672, 99.701%), and then others were Portuguese (3, 0.112%), German (2, 0.075%), Japanese (2, 0.075%) and Spanish (1, 0.037%),
3.2. Publication output
shows the publications of rice and greenhouse gas topic research between 1991 and 2022. The highest value was 394 papers in 2021. In general, the number of publications presents a fast growth tendency after 2005. There are 73, 223, 1,470, 914 papers during the period of 1991–1999, 2000–2009, 2010–2019, 2020–2022, respectively. These trends reflect the increasing attention devoted to this area during the past decade. Publications were exponential growth during period from 1991 to 2022 (R2 = 0.9483).
Figure 1. Trends in the quantity of published papers on rice and greenhouse gases research from 1991 to 2022.
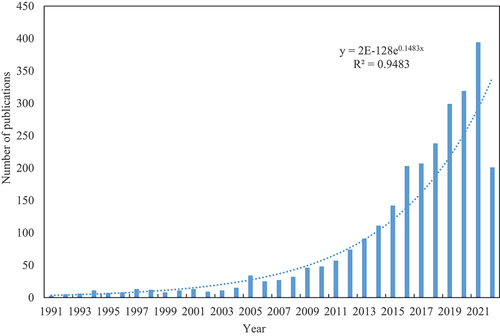
The quality of publications was measured by the number of citations with h-index. For a total of 2,680 papers, the h-index is 125, the total number of citations was 84,495 over the period and the average citation per item is 31.53. There were three earliest papers on rice and greenhouse gas topic research published in 1991, and they were ‘Origins of atmospheric methane’ written by Badr et al. (Citation1991) and published in Applied Energy; titled of ‘Effect of encapsulated calcium carbide on dinitrogen, nitrous-oxide, methane, and carbon-dioxide emissions from flooded rice’ written by Bronson and Mosier (Citation1991) and published in Biology and Fertility of Soils; titled of ‘Sources and sinks of greenhouse gases in the soil-plant environment’ written by Denmead (Citation1991) and published in Vegetatio.
3.3. Web of science categories and research areas
There are total 84 WoS subject categories and 55 research areas for rice and greenhouse gas topic research during 1991–2022. shows the top 20 WoS categories and research areas. The top five categories include Environmental Sciences (1,286 papers, 47.985% of 2,680 papers), Soil Science (431, 16.082%), Agronomy (340, 12.687%), Green Sustainable Science Technology (291, 10.858%), and Ecology (260, 9.701%). The top five research areas include Environmental Sciences Ecology (1,363 papers, 50.858% of 2,680 papers), Agriculture (982, 36.642%), Science Technology Other Topics (405, 15.112%), Engineering (334, 12.463%) and Energy Fuels (196, 7.313%). Journals or papers may be classified into two or more categories in the WoS, showing the multidisciplinary character of this research field (Elango & Ho, Citation2018). In WoS, publications are mapped to WoS categories, which are more detailed than research areas (Stopar et al., Citation2021).
Table 1. Top 20 WoS categories and research areas on rice and greenhouse gas topic research from 1991 to 2022.
3.4. Core journals
All 2,680 publications were published in 517 journals and four book series. The four book series titles are Advances in Agronomy (12), Annual Review of Plant Biology (2), Advances in Space Research (1) and Annals of the New York Academy of Sciences Series (1). The top 25 core journals are displayed in with total articles for each of more than 20 papers, Journal impact factor as IF 2021 and IF 5 year, Quartile rank in Category, total citations and average citations per paper. As for one journal belonging to a different WoS category, the Quartile rank in Category was selected as the highest one.
Table 2. Top 25 core Journals on rice and greenhouse gas topic research indexed in the WoS.
The top 5 journals, top 10 journals, top 15 journals, top 20 journals and top 25 journals published about 21.195%, 29.516%, 36.121%, 41.456% and 45.71% of the total papers, respectively. The top five Journals are Science of the Total Environment (158, 5.896%), Journal of Cleaner Production (133, 4.963%), Agriculture Ecosystems and Environment (127, 4.739%), Environmental Science and Pollution Research (92, 3.433%) and Sustainability (58, 2.164%), each published equal to or more than 58 papers. Among the top 25 journals in , sixteen journals were in Quartile 1, seven journals were in Quartile 2, two journals were in Quartile 3. Journals in the Q1 rank are considered to have the highest impact. Based on the average citations per paper in , the top five the journal citation with more than 44 times were Global Change Biology (100.2), Soil Biology & Biochemistry (64.0), Geoderma (55.1), Field Crops Research (54.2) and Soil & Tillage Research (44.0).
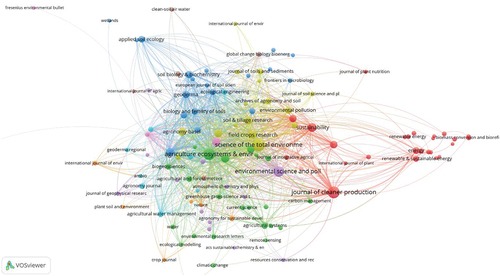
According to the publication data in the citation of 517 journals, there were 121 journals that met the thresholds of five and were connected to each other. The network visualisation maps of citations in the field of rice and greenhouse gas topic research based on WoS were shown to be 10 clusters with different colours in , the size of circles reflecting a total number of journal publications. Journals in the same colour cluster usually suggested that they published the similar content papers and had close relations with each other. The first cluster (red) had 25 journals and centred as Journal of Cleaner Production and Sustainability, the second cluster (green) had 23 journals and centred as Agriculture Ecosystems & Environment and Nutrient Cycling in Agroecosystems, the third cluster (blue) had 19 journals and centred as Global Change Biology and Soil Biology & Biochemistry, the fourth cluster (yellow) had 16 journals and centred as Science of the Total Environment and Field Crops Research, the fifth cluster (violet) had 14 journals and centred as Environmental Science and Pollution Research and Construction and Building Materials, the sixth cluster (light blue) had eight journals and centred as Agricultural Water Management and Agronomy Journal, the seventh cluster (orange) had six journals and centred as Agronomy for Sustainable Development and International Journal of Environmental Research and Public Health, the eighth cluster (brown) had five journals and centred as Environmental Science & Technology and Water Air and Soil Pollution, the ninth cluster (pink) had four journals and centred as Soil Science and Plant Nutrition and Global Biogeochemical Cycles, the tenth cluster had only one journal revista Brasileira de Ciencia do Solo.
Figure 2. Network visualization maps of citation journals with minimum of 5 publications in the field of rice and greenhouse gases topic research based on WoS with 121 circles and 10 clusters.
3.5. Authors co-authorship analysis
A total of 10,116 authors have 2,680 publications, where 381 authors met the thresholds of five publications and 342 authors were connected with each other. The network map of authorship authors in the field of rice and greenhouse gas topic research based on WoS represented in , the size of circles reflects a total number of records. Authors in the same cluster usually suggested that they studied in a similar field or worked at the same institute or had close cooperation with each other.
Figure 3. Network visualization map of top authors in rice and climate change topic research from 1991 to 2022.
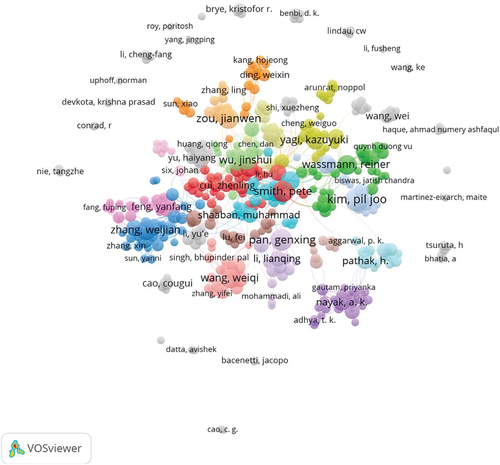
provides the top 23 author information published articles in the field of rice and greenhouse gas topic research from 1991 to 2022 with affiliations and countries and published more than 20 papers. Among the all authors in , the top four authors were Wassmann Reiner (38 papers), Pan Genxing (34), Smith Pete (33) and Cao Cougui (29), each published more than 29 papers.
Table 3. The top 23 most prolific authors published papers in the field of rice and greenhouse gas topic research from 1991 to 2022.
The organisation of the author is the latest institute based on the latest publications. Among the 23 authors, there are eleven authors from China, the organisations are Nanjing Agricultural University, Huazhong Agricultural University, Chinese Acad Agr Sci, Beijing University of Technology, Chinese Academy of Sciences, Fujian Normal University; three authors are from Germany; two authors are from India; two authors are from Japan; other five authors, each one author is from Scotland, South Korea, U.S.A., the Philippines and Spain.
3.6. Countries/Regions co-authorship analysis
There were 111 countries or regions that contributed 2,680 papers. represents the top 20 countries or regions that published equal to or more than 52 papers and also shows the cluster, total link strength, citations and average citations. Among the 20 countries or regions, Peoples R China, U.S.A., India, Germany and Japan were the five major article contributors, each published more than 212 papers. In the case of average citations, Scotland, Canada, Germany, U.S.A. and Australia showed the higher citations per paper more than 52.8 times. The strength of international research collaboration was presented as Total Link Strength (TLS), which is automatically given by VOSviewer upon mapping research activity of selected countries.
Table 4. Top 20 countries published papers in the field of rice and greenhouse gas topic research from 1991 to 2022.
All papers were developed for the co-authorship network map using VOSviewer (). There are 60 countries or regions that met the threshold as five and were divided into six clusters. According to the number of publications from high to low among each cluster in , the first cluster (red colour) consisted of 19 countries or regions including England, Brazil, Italy, the Netherlands, Spain, Iran, Mexico, Belgium, Wales, Sri Lanka, Colombia, Poland, Greece, Ghana, Morocco, Chile, Peru, Portugal and Cote d'Ivoire. The second cluster (green colour) consisted of 13 countries or regions including Germany, Japan, the Philippines, Vietnam, France, Indonesia, Denmark, Nepal, Finland, Norway, the Czech Republic, Madagascar and Myanmar. The third cluster (blue colour) consisted of 13 countries or regions including Peoples R China, U.S.A., Australia, South Korea, Pakistan, Bangladesh, Malaysia, Saudi Arabia, Taiwan, Egypt, Turkey, Singapore and Northern Ireland. The fourth cluster (yellow colour) consisted of nine countries and regions including India, Thailand, Canada, Scotland, Russia, Ireland, Nigeria, Uruguay and South Africa. The fifth cluster (violet) consisted of five countries and regions including New Zealand, Austria, Switzerland, Kenya and Uganda. The sixth cluster (shallow blue) is the only country of Sweden. Taiwan, as a region of China, shows the stronger research ability in the field of rice and greenhouse gas topic research.
Figure 4. The country co-authorship network map of rice and greenhouse gases research related publications from 1991 to 2022. The country co-authorship network map with 60 circles and 6 clusters, the bigger circles represented the more influential countries. The distance and thickness of links represented the degree of cooperation among countries.
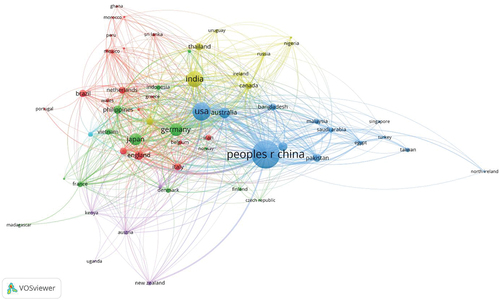
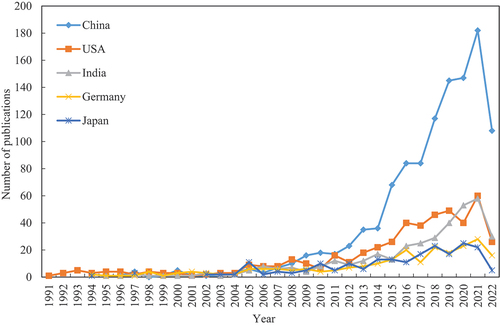
A comparison of the growth trends of the top five countries is displayed in . The People's Republic of China, the first on the list ranked by total papers, has published 1,123 (41.9%) articles, with the fastest growing trend since 2014. This could be due to a series of positive policies that motivated the rapid development of research in China. China is one of the most attractive countries in terms of scientific performance today. It has experienced a sustained and remarkable increase in scientific production and became the global second-largest producer of scientific publications since 2006, particularly taking a world-leading position in special fields (Fu et al., Citation2011). The past decades have witnessed a rapid rise of China in economic development, with a GDP averaging about a 10% annual growth rate since 2000, and China overtook Japan as the second-largest economy in 2010 (Liu et al., Citation2015).
Figure 5. Comparison the growth trends of the top five productive countries during 1991–2022.
3.7. Organizations co-authorship analysis
According to the publication data, a total of 2,594 organisations have 2,680 publications. represents the top 25 organisations ranked by the number of total publications of more than 41 papers, ratio of 2,680 and country. These 25 organisations were mainly based in China (eleven organisations), U.S.A. (three organisations), Germany (three organisations), India (three organisations), Japan (one organisation), the Philippines (one organisation), South Korea (one organisation), Spain (one organisation) and Scotland (one organisation). Furthermore, the top five organisations were Chinese Academy of Sciences, Nanjing Agricultural University, Indian Council of Agricultural Research ICAR, CGIAR, Chinese Academy of Agricultural Sciences with more than 126 papers each.
Table 5. Top 25 organisations publishing papers in the field of rice and greenhouse gas topic research from 1991 to 2022.
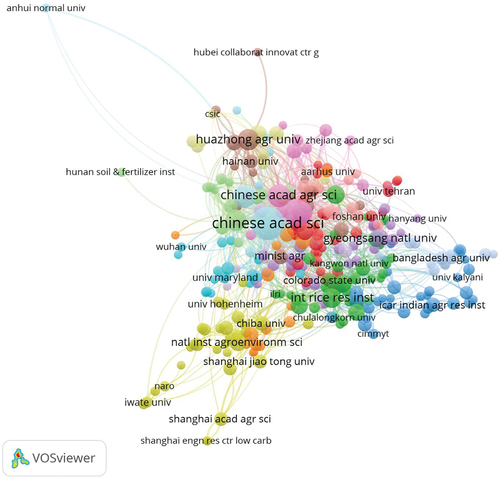
Among the total 2,594 organisations, 296 organisations met the minimum thresholds of five and were connected to each other (). The VOSviewer software divided these 296 institutes into 15 clusters with different colours, the bigger nodes represented the more influential institution in this field. The distance and thickness of links represented the degree of cooperation among organisations. Geographical localisation is an important factor for partnerships and joint ventures.
Figure 6. The organizations co-authorship network map of rice and greenhouse gases topic research related publications from 1991 to 2022, with 296 nodes and 15 clusters, the bigger nodes represented the more influential institution in this field.
3.8. All keywords co-occurrence analysis
For a specific scientific field study, keyword plays a large role as it can reflect the root contents of articles and compilation of keywords can reveal the patterns and trends of specific academic research (Badaluddin et al., Citation2021). To analyse the co-occurrence of keywords, author keywords, keywords plus and all keywords as units were chosen and analysed.
For the author keywords by full counting method for co-occurrence analysis, a total of 5,383 author keywords, and 365 author keywords met the threshold level of five and were separated into 12 clusters in network map visualisation. The top 23 co-occurrence author keywords were methane, nitrous oxide, greenhouse gas, biochar, rice, greenhouse gases, global warming potential, climate change, greenhouse gas emissions, life cycle assessment, carbon dioxide, N2O, agriculture, rice paddy, paddy soil, methane emission, CH4, greenhouse gas emission, rice straw, global warming, carbon sequestration, mitigation, paddy field, each author keywords occurred more than 61 times.
For the keywords plus by full counting method for co-occurrence analysis, a total of 4,333 keywords plus, and 687 keywords plus met the threshold level of five and were separated into nine clusters in network map visualisation. The top 20 co-occurrence keywords plus were greenhouse-gas emissions, nitrous-oxide emissions, soil, N2O emissions, management, methane emissions, methane emission, yield, methane, rice, carbon, paddy fields, fields, systems, fertiliser, cropping systems, China, emissions, nitrous-oxide and CH4, each keyword plus occurred more than 137 times.
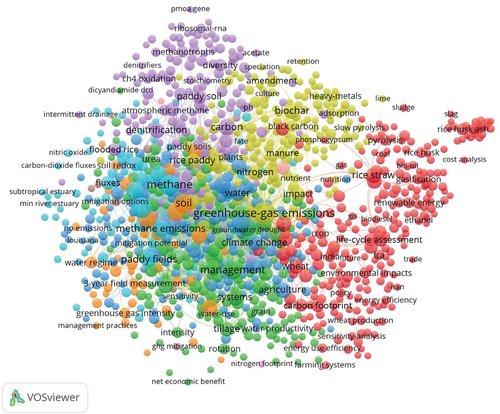
For all keywords using the full counting method for co-occurrence analysis, a total of 8,720 all keywords, and 993 all keywords met the threshold level of five. There are 10 main clusters that represent different viewpoints on rice and greenhouse gas topic research (). Each node in the Figure represents a keyword. The larger the node, the higher the frequency of keyword occurrence; the more lines, the higher the frequency of keyword co-occurrence; additionally, the thickness of the connecting line is proportional to the closeness of the connection. The size of the node is proportional to the frequency of occurrence of the keyword, and the thickness of the line represents the intensity of co-occurrence between individual keywords. The top 20 co-occurrences of all keywords were greenhouse-gas emissions, methane, nitrous-oxide emissions, soil, N2O emissions, rice, management, methane emissions, nitrous oxide, methane emissions, yield, greenhouse gas, biochar, China, greenhouse gases, CH4, paddy fields, carbon, N2O, fertiliser, each all keywords occurred more than 174 times.
Figure 7. Vosviewer co-occurrence network visualization mapping of most frequent all keywords on rice and greenhouse gas topic research with ten main clusters. Co-occurrence network of all keywords including author keywords and keywords plus.
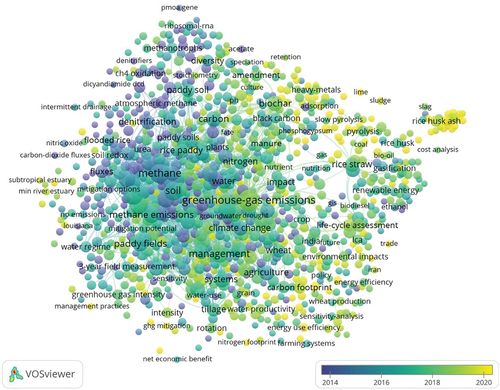
The same data in were then arranged by a period of rice and greenhouse gas topic research as overlay map (). Blue colour indicates earlier research topics, whereas yellow and green colours indicate the more recent topics of interest. The blue coloured topics do not indicate any further research work on that topic; they usually indicate that, on average, this topic was intensely investigated earlier and now more attention has shifted towards other topics. Perhaps, these terms are now so general, and therefore, no longer extensively used as keywords. Yellow and green circles present those research fronts. For example, the keywords of left part in can be observed with more blue circles showing the older topic research, the cluster of first (red) and fourth (yellow) in as keywords of right part in can be observed with yellow or shallow green circles showing the recent and front research. Blue colours indicated earlier research topics, whereas yellow and green colours indicated more recent topics of interest. Yellow and green circles present those research fronts.
Figure 8. Vosviewer co-occurrence overlay visualization mapping of most frequent all keywords on rice and greenhouse gas topic research from 1991 to 2022. The years in which specific keywords frequently occur are shown by different colors.
Visualisations conducted on large datasets (big data) offer exploratory information on the current state in a scientific field or discipline as well as indicate possible developments in the future. Here, the 10 clusters for different topics on the greenhouse gas and rice are given in , such as rice straw and greenhouse gas emissions, crop systems management under global warming potential, study of rice field greenhouse gas in China, greenhouse-gas emissions related to biochar and nitrogen in rice paddy field, denitrification of paddy soil, methane and nitrous-oxide emissions in paddy fields, soil N2O emissions and methane emission from cropping systems, GHG mitigation options under intermittent irrigation, straw return and nitrogen footprint, straw study in South China.
The first cluster (red) has 245 all keywords met the threshold level of five and is focused on rice straw and greenhouse gas emissions, and 20 most frequently used all keywords include rice straw, emissions, greenhouse gas emissions, biomass, wheat, life-cycle assessment, climate-change, impacts, life cycle assessment, methane production, energy, carbon footprint, rice production, sustainability, GHG emissions, consumption, performance, crop production, efficiency, production systems, each all keywords occurred more than 47 times.
The second cluster (green) has 167 all keywords and represents the crop systems management under global warming potential, and 21 most frequently used all keywords including as management, yield, systems, mitigation, global warming potential, carbon sequestration, use efficiency, productivity, tillage, paddy field, system, oxide emissions, irrigated rice, cropping system, food security, no-tillage, sequestration, greenhouse gas emission, grain-yield, crop residue and nitrogen use efficiency, each all keywords occurred more than 58 times.
The third cluster (blue) has 160 all keywords and is focused on study of rice field greenhouse gas in China and 21 most frequently all keywords as rice, greenhouse gas, China, greenhouse gases, CH4, agriculture, fields, climate change, water management, water, temperature, CO2, growth, rice fields, CH4 emission, soils, global warming, maize, model, decomposition, land-use, each all keywords occurred more than 46 times.
The fourth cluster (yellow) has 154 all keywords and represents greenhouse-gas emissions related to biochar and nitrogen in rice paddy field, and 20 most frequently all keywords include as greenhouse-gas emissions, biochar, nitrogen, organic-carbon, rice paddy, organic-matter, impact, amendment, agricultural soils, manure, microbial biomass, ammonia volatilisation, crop yield, microbial community, black carbon, quality, mineralisation, matter, paddy soils, charcoal, each all keywords occurred more than 35 times.
The fifth cluster (violet) has 141 all keywords and is focused on denitrification of paddy soil, and 20 most frequently all keywords include as carbon, nitrous-oxide, denitrification, paddy soil, oxidation, paddy, dynamics, flooded rice, emission, nitrification, diversity, rice field, methane oxidation, land-use change, atmospheric methane, methanotrophs, community structure, reduction, bacteria, nitrate, each all keywords occurred more than 36 times.
The sixth cluster (shallow blue) has 72 all keywords and is focused on methane and nitrous-oxide emissions in paddy fields, and 22 most frequently all keywords include as methane, nitrous-oxide emissions, nitrous oxide, methane emissions, paddy fields, N2O, carbon-dioxide, fluxes, carbon dioxide, rice paddies, direct N2O emissions, emission factor, nitric-oxide, residue, growing-season, drainage, waste-water, fertiliser nitrogen, straw application, mitigation potential, each all keywords occurred more than 13 times.
The seventh cluster (orange) has 44 all keywords and is focused on soil N2O emissions and methane emission from cropping systems, and 20 most frequently all keywords include as soil, N2O emissions, methane emission, fertiliser, cropping systems, CH4 emissions, field, fertilisation, water regime, straw incorporation, greenhouse-gas intensity, soil carbon sequestration, greenhouse gas intensity, 3-year field measurement, water-saving irrigation, fertiliser application, agronomic assessment, rice-wheat rotation, soil redox, GWP, each all keywords occurred more than 22 times.
The eighth cluster (brown) is focused on GHG mitigation options under intermittent irrigation, and six all keywords include as mitigation options, intermittent irrigation, GHG mitigation, irrigated rice fields, stocks and upland.
The ninth cluster (pink) is two all keywords both straw return and nitrogen footprint.
The tenth cluster is two all keywords both straw and South China.
3.9. The most frequently cited articles
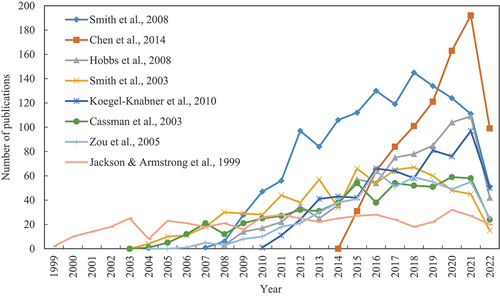
The annual citations of the eight papers showed an increasing trend after the year of publication (). The eight papers were written by Smith et al. (Citation2008), Chen et al. (Citation2014), Hobbs et al. (Citation2008), Smith et al. (Citation2003), Koegel-Knabner et al. (Citation2010), Cassman et al. (Citation2003), Zou et al. (Citation2005) and Jackson and Armstrong (Citation1999). Here, the total citations for the most frequently cited articles were more than 500 times. From the publication year to 22 July 2022, the total citations for each paper of the most citation eight papers were 1351, 855, 756, 723, 655, 615, 533 and 500 times, and the average citation per year each paper were 90.07, 95, 50.4, 36.15, 50.38, 30.75, 29.61 and 20.83 times. From , it can be found that the citation per year of the papers increased till to 2021, but the increase rate was different each year. Among the eight articles, the highest average citation paper per year (95, brown colour) was observed for the article of Chen et al. (Citation2014) published in Nature ().
Figure 9. Comparison of the citations per year of the most eight papers related to rice and greenhouse gases topic research from their initial publications to 22 July 2022.
4. Conclusions
This study analysed 2,680 papers about rice and greenhouse gas topic research from 1991 to July 2022, which include 47 highly cited papers and one hot paper. Papers were mainly written in English, from 10,116 authors, 2,594 organisations and 111 countries or territories, published in 517 journals and four book series. All keywords more than five occurrences were separated into 10 clusters for different research topics, such as rice straw and greenhouse gas emissions, crop systems management under global warming potential, study of rice field greenhouse gas in China, greenhouse-gas emissions related to biochar and nitrogen in rice paddy field, denitrification of paddy soil, methane and nitrous-oxide emissions in paddy fields, soil N2O emissions and methane emission from cropping systems, GHG mitigation options under intermittent irrigation, straw return and nitrogen footprint, straw study in South China. Visualisations offer exploratory information on the current state or possible developments in the future. From VOSviewer co-occurrence overlay visualisation mapping of most frequent all keywords on rice and greenhouse gas topic research from 1991 to 2022, the different colours of all keywords will help researchers clarify the current situation in rice and greenhouse gas adaptation science but also provide guidance for future research.
5. Availability of data and material
Data sharing is not applicable to this article as no new data were created or analysed in this study.
Disclosure statement
No potential conflict of interest was reported by the author(s).
Additional information
Funding
References
- Badaluddin, N. A., Lion, M., Razali, S. M., & Khalit, S. I. (2021). Bibliometric analysis of global trends on soil moisture assessment using the remote sensing research study from 2000 to 2020. Water Air and Soil Pollution, 232(7), 271. https://doi.org/10.1007/s11270-021-05218-9
- Badr, O., Probert, S. D., & Ocallaghan, P. W. (1991). Origins of atmospheric methane. Applied Energy, 40(3), 189–231. https://doi.org/10.1016/0306-2619(91)90057-5
- Boateng, K. K., Obeng, G. Y., & Mensah, E. (2017). Rice cultivation and greenhouse gas emissions: A review and conceptual framework with reference to ghana. Agriculture-Basel, 7(1), 7. https://doi.org/10.3390/agriculture7010007
- Bronson, K. F., & Mosier, A. R. (1991). Effect of encapsulated calcium carbide on dinitrogen, nitrous-oxide, methane, and carbon-dioxide emissions from flooded rice. Biology and Fertility of Soils, 11(2), 116–120. https://doi.org/10.1007/BF00336375
- Cassman, K. G., Dobermann, A., Walters, D. T., & Yang, H. (2003). Meeting cereal demand while protecting natural resources and improving environmental quality. Annual Review of Environment and Resources, 28(1), 315–358. https://doi.org/10.1146/annurev.energy.28.040202.122858
- Chen, X. P., Cui, Z. L., Fan, M. S., Vitousek, P., Zhao, M., Ma, W. Q., Wang, Z. L., Zhang, W. J., Yan, X. Y., Yang, J. C., Deng, X. P., Gao, Q., Zhang, Q., Guo, S. W., Ren, J., Li, S. Q., Ye, Y. L., Wang, Z. H., Huang, J. L. … Zhang, F. S. (2014). Producing more grain with lower environmental costs. Nature, 514(7523), 486–489. https://doi.org/10.1038/nature13609
- Chirinda, N., Arenas, L., Katto, M., Loaiza, S., Correa, F., Isthitani, M., Loboguerrero, A. M., Martinez-Baron, D., Graterol, E., Jaramillo, S., Torres, C. F., Arango, M., Guzman, M., Avila, I., Hube, S., Kurtz, D. B., Zorrilla, G., Terra, J., Irisarri, P. … Bayer, C. (2018). Sustainable and low greenhouse gas emitting rice production in Latin America and the Caribbean: A review on the transition from ideality to reality. Sustainability, 10(3), 671. https://doi.org/10.3390/su10030671
- Clarivate. (2022a). Journal Citation Reports ™. 2021. https://jcr.clarivate.com/jcr/browse-journals
- Clarivate. (2022b). Essential science indicators help: About essential science indicators, http://esi.help.clarivate.com/Content/home.htm.
- Deng, H. M., Liang, Q. M., Liu, L. J., & Anadon, L. D. (2017). Co-benefits of greenhouse gas mitigation: A review and classification by type, mitigation sector, and geography. Environmental Research Letters, 12(12), 123001. https://doi.org/10.1088/1748-9326/aa98d2
- Denmead, O. T. (1991). Sources and sinks of greenhouse gases in the soil-plant environment. Vegetatio, 91(1–2), 73–86. https://doi.org/10.1007/BF00036049
- Elango, B., & Ho, Y. S. (2018). Top-cited articles in the field of tribology: A bibliometric analysis. COLLNET Journal of Scientometrics and Information Management, 12(2), 289–307. https://doi.org/10.1080/09737766.2018.1529125
- Faiz-Ul Islam, S., Sander, B. O., Quilty, J. R., de Neergaard, A., van Groenigen, J. W., & Jensen, L. S. (2020). Mitigation of greenhouse gas emissions and reduced irrigation water use in rice production through water-saving irrigation scheduling, reduced tillage and fertiliser application strategies. The Science of the Total Environment, 739, 140215. https://doi.org/10.1016/j.scitotenv.2020.140215
- Fu, H. Z., Chuang, K. Y., Wang, M. H., & Ho, Y. S. (2011). Characteristics of research in China assessed with essential science indicators. Scientometrics, 88(3), 841–862. https://doi.org/10.1007/s11192-011-0416-8
- Geng, Y., Chen, W., Liu, Z., Chiu, A. S. F., Han, W. Y., Liu, Z. Q., Zhong, S. Z., Qian, Y. Y., You, W., & Cui, X. W. (2017). A bibliometric review: Energy consumption and greenhouse gas emissions in the residential sector. Journal of Cleaner Production, 159, 301–316. https://doi.org/10.1016/j.jclepro.2017.05.091
- Gupta, K., Kumar, R., Baruah, K. K., Hazarika, S., Karmakar, S., & Bordoloi, N. (2021). Greenhouse gas emission from rice fields: A review from Indian context. Environmental Science and Pollution Research, 28(24), 30551–30572. https://doi.org/10.1007/s11356-021-13935-1
- Hobbs, P. R., Sayre, K., & Gupta, R. (2008). The role of conservation agriculture in sustainable agriculture. Philosophical Transactions of the Royal Society B-Biological Sciences, 363(1491), 543–555. https://doi.org/10.1098/rstb.2007.2169
- Hussain, S., Peng, S. B., Fahad, S., Khaliq, A., Huang, J. L., Cui, K. H., & Nie, L. X. (2015). Rice management interventions to mitigate greenhouse gas emissions: A review. Environmental Science and Pollution Research, 22(5), 3342–3360. https://doi.org/10.1007/s11356-014-3760-4
- Jackson, M. B., & Armstrong, W. (1999). Formation of aerenchyma and the processes of plant ventilation in relation to soil flooding and submergence. Plant Biology, 1(3), 274–287. https://doi.org/10.1111/j.1438-8677.1999.tb00253.x
- Koegel-Knabner, I., Amelung, W., Cao, Z. H., Fiedler, S., Frenzel, P., Jahn, R., Kalbitz, K., Koelbl, A., & Schloter, M. (2010). Biogeochemistry of paddy soils. Geoderma, 157(1–2), 1–14. https://doi.org/10.1016/j.geoderma.2010.03.009
- Kumar, A., Nayak, A. K., Das, B. S., Panigrahi, N., Dasgupta, P., Mohanty, S., Kumar, U., Panneerselvam, P., & Pathak, H. (2019). Effects of water deficit stress on agronomic and physiological responses of rice and greenhouse gas emission from rice soil under elevated atmospheric CO2. The Science of the Total Environment, 650, 2032–2050. https://doi.org/10.1016/j.scitotenv.2018.09.332
- Linquist, B. A., Adviento-Borbe, M. A., Pittelkow, C. M., van Kessel, C., & van Groenigen, K. J. (2012). Fertilizer management practices and greenhouse gas emissions from rice systems: A quantitative review and analysis. Field Crops Research, 135, 10–21. https://doi.org/10.1016/j.fcr.2012.06.007
- Linquist, B. A., Anders, M. M., Adviento-Borbe, M. A. A., Chaney, R. L., Nalley, L. L., Da Rosa, E. F. F., & Van Kessel, C. (2015). Reducing greenhouse gas emissions, water use, and grain arsenic levels in rice systems. Global Change Biology, 21(1), 407–417. https://doi.org/10.1111/gcb.12701
- Linquist, B. A., Marcos, M., Adviento-Borbe, M. A., Anders, M., Harrell, D., Linscombe, S., Reba, M. L., Runkle, B. R. K., Tarpley, L., & Thomson, A. (2018). Greenhouse gas emissions and management practices that affect emissions in US rice systems. Journal of Environmental Quality, 47(3), 395–409. https://doi.org/10.2134/jeq2017.11.0445
- Liu, W. S., Tang, L., Gu, M. D., & Hu, G. Y. (2015). Feature report on China: A bibliometric analysis of China-related articles. Scientometrics, 102(1), 503–517. https://doi.org/10.1007/s11192-014-1371-y
- Liu, B., Zhang, L., & Wang, X. W. (2017). Scientometric profile of global rice research during 1985-2014. Current Science, 112(5), 1003–1011. https://doi.org/10.18520/cs/v112/i05/1003-1011
- Morooka, K., Ramos, M. M., & Nathaniel, F. N. (2014). A bibliometric approach to interdisciplinarity in Japanese rice research and technology development. Scientometrics, 98(1), 73–98. https://doi.org/10.1007/s11192-013-1119-0
- Panchasara, H., Samrat, N. H., & Islam, N. (2021). Greenhouse gas emissions trends and mitigation measures in Australian agriculture sector—a review. Agriculture, 11(2), 85. https://doi.org/10.3390/agriculture11020085
- Peng, S. B. (2017). Booming research on rice physiology and management in China: A bibliometric analysis based on three major agronomic journals. Journal of Integrative Agriculture, 16(12), 2726–2735. https://doi.org/10.1016/S2095-3119(17)61804-5
- Pittelkow, C. M., Adviento-Borbe, M. A., Hill, J. E., Six, J., Van Kessel, C., & Linquist, B. A. (2013). Yield–scaled global warming potential of annual nitrous oxide and methane emissions from continuously flooded rice in response to nitrogen input. Agriculture Ecosystems & Environment, 177, 10–20. https://doi.org/10.1016/j.agee.2013.05.011
- Smith, K. A., Ball, T., Conen, F., Dobbie, K. E., Massheder, J., & Rey, A. (2003). Exchange of greenhouse gases between soil and atmosphere: Interactions of soil physical factors and biological processes. European Journal of Soil Science, 54(4), 779–791. https://doi.org/10.1046/j.1351-0754.2003.0567.x
- Smith, P., Martino, D., Cai, Z. C., Gwary, D., Janzen, H., Kumar, P., McCarl, B., Ogle, S., O’Mara, F., Rice, C., Scholes, B., Sirotenko, O., Howden, M., McAllister, T., Pan, G. X., Romanenkov, V., Schneider, U., Towprayoon, S., Wattenbach, M., & Smith, J. (2008). Greenhouse gas mitigation in agriculture. Philosophical Transactions of the Royal Society B-Biological Sciences, 363(1492), 789–813. https://doi.org/10.1098/rstb.2007.2184
- Stopar, K., Mackiewicz-Talarczyk, M., & Bartol, T. (2021). Cotton fiber in Web of Science and Scopus: Mapping and visualization of research topics and publishing patterns. Journal of Natural Fibers, 18(4), 547–558. https://doi.org/10.1080/15440478.2019.1636742
- Sun, J., & Yuan, B. Z. (2019). Visualization analysis of research on rice with fertilizer from the ‘agronomy’ category based on CiteSpace. Current Science, 117(9), 1449–1458. https://doi.org/10.18520/cs/v117/i9/1449-1458
- Sun, J., & Yuan, B. Z. (2020a). A bibliometric analysis of research on rice and irrigation from the ‘Agronomy’ category based on the web of science. Current Science, 119(3), 438–446. https://doi.org/10.18520/cs/v119/i3/438-446
- Sun, J., & Yuan, B. Z. (2020b). Mapping of the world rice research: A bibliometric analysis of top papers during 2008–2018. Annals of Library and Information Studies, 67(1), 56–66. https://doi.org/10.56042/alis.v67i1.30297
- van Eck, N. J., & Waltman, L. (2010). Software survey: VOSviewer, a computer program for bibliometric mapping. Scientometrics, 84(2), 523–538. https://doi.org/10.1007/s11192-009-0146-3
- Van Eck, N. J., & Waltman, L. (2022). Manual for VOSviewer version 1.6.18. Universiteit Leiden.
- Yagi, K., Sriphirom, P., Cha-Un, N., Fusuwankaya, K., Chidthaisong, A., Damen, B., & Towprayoon, S. (2020). Potential and promisingness of technical options for mitigating greenhouse gas emissions from rice cultivation in Southeast Asian countries. Soil Science and Plant Nutrition, 66(1), 37–49. https://doi.org/10.1080/00380768.2019.1683890
- Yang, W., Zhou, H. J., Si, F. Q., Liu, C., Wang, W., Sun, Y. W., Liu, W. Q., & Shan, C. G. (2018). Bibliometric analysis of greenhouse gas research on a global scale from 2000 to 2014. Current Science, 114(8), 1624–1631. https://doi.org/10.18520/cs/v114/i08/1624-1631
- Zhang, C. L., Xu, T., Feng, H. L., & Chen, S. H. (2019). Greenhouse gas emissions from landfills: A review and bibliometric analysis. Sustainability, 11(8), 2282. https://doi.org/10.3390/su11082282
- Zhao, X., Min, J., Wang, S. Q., Shi, W. M., & Xing, G. X. (2011). Further understanding of nitrous oxide emission from paddy fields under rice/wheat rotation in South China. Journal of Geophysical Research-Biogeosciences, 116(G2), G02016. https://doi.org/10.1029/2010JG001528
- Zou, J. W., Huang, Y., Jiang, J. Y., Zheng, X. H., & Sass, R. L. (2005). A 3-year field measurement of methane and nitrous oxide emissions from rice paddies in China: Effects of water regime, crop residue, and fertilizer application. Global biogeochemical cycles, 19(2), GB2021. https://doi.org/10.1029/2004GB002401