
 ?Mathematical formulae have been encoded as MathML and are displayed in this HTML version using MathJax in order to improve their display. Uncheck the box to turn MathJax off. This feature requires Javascript. Click on a formula to zoom.
ABSTRACT
Achieving tourism carbon neutrality is essential for sustainable tourism development. This paper uses the coupled coordination distance model, modified gravity model and social network analysis to attempt to construct a nationwide tourism carbon neutral spatial network to clarify the role of each province in the process of achieving China’s tourism carbon neutrality. The results show that: (1) only seven provinces will achieve tourism carbon neutrality in the target year of carbon neutrality in China (2060). (2) From 2001 to 2060, most provinces are at the stage of coordinated development of tourism carbon emissions and tourism carbon sinks, but the degree of coordinated development is low. (3) The structure of China’s tourism carbon-neutral spatial network tends to be looser from 2001 to 2060. As the time series progresses, the role of each province in the spatial network will be gradually clarified. (4) In the process of achieving the goal of China’s tourism carbon neutrality, the number of tourism carbon sink input areas is much larger than that of tourism carbon sink output areas. Accordingly, this paper proposes countermeasures from three aspects: government-led, market system and voluntary mechanisms, in order to promote the achievement of China’s tourism carbon neutrality goal.
1. Introduction
Against the backdrop of global warming, there is a global consensus regarding the need to address climate change, promote energy conservation and emission reduction, and achieve low-carbon development. At the 21st United Nations Climate Change Conference, held in 2015, the participating parties unanimously agreed to adopt the Paris Agreement. All countries and regions decided to participate in the global response to climate change by way of independent contributions. The Chinese government attaches great importance to energy conservation and emission reduction. In 2020, the government formally proposed the ‘carbon peaking and carbon neutrality’ objectives, striving to achieve peak carbon by 2030 and carbon neutrality by 2060 (Xi, Citation2020). As a result, carbon neutrality has become an ambitious goal that all sectors in China are committed to achieving.
The rapid growth of tourism has brought about positive economic benefits, but has also caused an increase in carbon emissions. As early as the beginning of the 21st century, Gössling found through his study that tourism energy consumption accounted for 3.2% of the total global energy consumption in 2001 and will increase year by year (Gössling, Citation2002). According to statistics, total global tourism revenue reached $5.8 trillion in 2019, accounting for 6.7% of total global GDP (World Tourism Cities Federation, Citation2020). As a high-energy consumption-based industry, the development of tourism will inevitably expand the scale of energy consumption in the industry and exacerbate the growth of carbon emissions (S. Li & Lv, Citation2021). According to a study by the World Tourism Organization, tourism contributes 5% to 14% of total anthropogenic carbon emissions (World Tourism Organization, Citation2008). In addition, the environmental problems caused by tourism’s development have become one of the obstacles to that industry’s development. In recent years, China’s tourism industry has developed rapidly; its combined contribution to China’s GDP reached RMB 10.94 trillion in 2019, or 11.05% of the total GDP (China Tourism Research Institute, Citation2020). This makes tourism an important strategic pillar industry for China. Therefore, the achievement of carbon neutrality in the tourism industry will have a significant impact on the achievement of carbon neutrality in China as a whole.
The achievement of carbon neutrality is of great significance to the sustainable development of the region. At present, China’s economy has entered a new stage of high-quality development, and the construction of an ecological civilisation has become a common focus for all industries. Carbon neutrality is a key enabler of quality development in the tourism industry (Ren, Citation2022) and can promote sustainable development and ecological civilisation in the tourism industry. China is a vast country, with a myriad of provincial differences. In order to successfully achieve carbon neutrality in China’s tourism industry, the role of each province in achieving that goal needs to be appropriately allocated, with a view to achieving quality tourism development. Thus, accurately characterising the spatial network structure of the tourism industry and its evolution, identifying functional zones and clarifying development positioning can effectively break through inter-provincial barriers and strengthen regional synergies. These are all of great significance to the achievement of carbon neutrality in China’s tourism industry.
With the introduction of China’s ‘carbon peaking and carbon neutrality’ goals, scholars have conducted a series of forward-looking studies on carbon neutrality in tourism and related issues. These studies are broadly divided into the following three areas:
Basic research on carbon neutrality in tourism Specifically, basic research includes the measurement of carbon emissions and sinks in tourism and the assessment of their development levels. Most studies have used both ‘top-down’ (J. P. Zha, Citation2016; Meng et al., Citation2017) and ‘bottom-up’ (C. Tang et al., Citation2018; Cheng et al., Citation2020; J. Zha et al., Citation2021) approaches to measure carbon emissions from tourism. In contrast, the measurement of tourism carbon sinks is mainly based on the contribution of tourism to the economy as a coefficient, and is derived from carbon sinks. Examples of carbon sinks include ecosystem carbon sequestration (Cheng et al., Citation2020) and forest carbon sinks (Tu & Liu, Citation2022). These assessments are based on the accounting results of tourism carbon emissions and tourism carbon sinks, using low-carbon tourism as a measure. At the same time, as the influence of tourism expands and research continues to intensify, scholars have begun to measure the coupling and coordination between the tourism economic system (Pan et al., Citation2021), the atmospheric environment system (Geng et al., Citation2020) and the ecological environment system (Q. Wang et al., Citation2019), based on tourism carbon emissions. However, little research has been conducted that attempts to measure the coordination between tourism carbon emissions and tourism carbon sinks. Only a few scholars have explored this issue from the perspective of tourism carbon carrying capacity (Tu & Liu, Citation2022).
Modelling the dynamics of carbon neutrality in tourism Since the introduction of the ‘carbon peaking and carbon neutrality’ goals, scholars have conducted exploratory prediction studies on carbon peaking and carbon neutrality, at both national (Z. M. Liu et al., Citation2022) and regional (Gao et al., Citation2022) levels, and at the sectoral levels of agriculture (M. J. Zhao et al., Citation2022) and industry (Hou et al., Citation2023). For the tourism industry, existing studies have mainly focused on the area of carbon peaking. Among them, at the national level, Liu et al (D. Liu et al., Citation2021), Ma et al (X. Ma et al., Citation2021), and Tang et al (C. C. Tang et al., Citation2021). all modelled the future changes in China’s tourism carbon emissions and accordingly obtained the time to achieve China’s tourism carbon peaking.At the provincial level, Zhu et al (Zhu et al., Citation2023). used a Stochastic Impacts by Regression on Population, Affluence, and Technology model (STIRPAT) to predict the timing of peak carbon in tourism in 30 provinces in China. The study found that the eastern provinces would be the first to reach peak carbon. Peak carbon and carbon neutrality are two interrelated stages. Although few studies have modelled the dynamics of carbon neutrality in the tourism industry, the wealth of research currently available on the development of peak carbon in the tourism industry provides a solid basis for further research on carbon neutrality in the future.
The path to carbon neutrality in tourism If the tourism industry can achieve carbon neutrality, this would promote the industry’s sustainable development. Therefore, how to achieve carbon neutrality in tourism has become the focus of academic circles, and scholars have conducted rich discussions on this issue. Ma et al (Y. Ma & Jiang, Citation2022). discussed a development model and enhancement strategy of low-carbon tourism, based on the perspective of carbon neutrality. Ren (Ren, Citation2022) constructed an implementation path of high-quality sustainable development of tourism, based on the reshaping of the value of the high-quality development of tourism under the goal of ‘carbon peaking and carbon neutrality’. Tian et al (Tian & Liu, Citation2022). clarified the strategic shift of China’s tourism development under carbon neutrality. The study went on to propose three paths for the carbon neutral development of tourism. Wu et al (Wu & Ouyang, Citation2022). defined the scope of the environmental responsibility of the tourism industry under the ‘carbon peaking and carbon neutrality’ goals and then proposed corresponding mechanisms and ways of implementation.
In summary, the current academic community has applied a scientifically diverse research approach to the study of carbon neutrality in tourism, resulting in a rich and varied body of research. However, there are also shortcomings, as follows: firstly, most existing studies focus on the prediction of carbon peaks in tourism, but few scholars have modelled the carbon sinks in tourism and then explored the dynamic evolution of carbon neutrality in tourism. This approach makes it difficult to reflect the synergistic development of carbon peaks and carbon neutrality in a comprehensive manner. Secondly, most studies have focused on the coupling between the tourism carbon emission system and external systems, such as the economy and ecology. This approach neglects the dynamic synergy between carbon neutral and internal carbon emissions and carbon sinks in the tourism industry. Finally, although there is a wealth of research on carbon neutral pathways for tourism, academia has not yet developed a spatial network structure for tourism carbon neutrality (TCN). In addition, the role and position of each region in the TCN goal is not clear.
In view of this, this paper analyzes the inter-provincial tourism carbon balance based on measurements and simulations of tourism carbon emissions and tourism carbon sinks for the past 20 years and the next 40 years in 30 Chinese provinces. Using a combination of coupled coordination distance model, modified gravity model and social network analysis, this paper explores the synergistic development relationship between tourism carbon emissions and tourism carbon sinks, as well as reveals the spatial network structure of China’s TCN. Finally, this paper identifies the functional subdivisions of each province in the goal of TCN in China for the purpose of clarifying the future positioning of tourism in each province.
2. Theoretical basis and research method
2.1. Theoretical basis
2.1.1. Carbon neutral
Carbon neutrality refers to the absorption or offsetting of carbon emissions directly or indirectly generated by human activities within a certain period of time through afforestation, energy conservation and emission reduction, in order to achieve positive and negative offsetting and net zero emissions (Kurniawan et al., Citation2023). Carbon neutrality is not only a revision and optimisation of human economic activities, but also an active restoration of the natural ecosystem, fully reflecting the green development concept that the kinetic energy of economic development needs to change from high carbon to low carbon (S. S. Li & Yang, Citation2022).
2.1.2. Carbon offset
Carbon offset is evolved from ecological offset, which is defined as the act of carbon emission subject to compensate carbon sink subject in economic or non-economic way (R. Q. Zhao et al., Citation2015). Carbon offset mainly includes three characteristics: (1) Carbon offset is an external behaviour of carbon emission subject to eliminate their own carbon emissions. (2) Carbon offset is essentially a way for carbon sink subjects to compensate themselves for the cost of protecting carbon sinks or the loss of development opportunities through economic or non-economic means. (3) Carbon offset promotes carbon emission reduction and carbon neutrality by regulating the spatial flow of carbon sinks, and ultimately realises regional equity and sustainable development. In recent years, environmental issues arising from the tourism carbon emissions have become a threat to tourism security (L. Y. Zeng et al., Citation2022). Meanwhile, people’s concern about carbon neutrality is gradually increasing (R. Y. M. Li et al., Citation2023), and the climate issues arising from tourism development may even cause travel boycotts by tourists (Zhai & Luo, Citation2023). Thus, carbon offset is particularly important for tourism development.
2.2. Research method
2.2.1. Measurement and modelling of carbon emissions from tourism
The data related to tourism carbon emissions involved in this paper are all from the previous research results of our team, specifically applying the measured data of tourism carbon emissions in each province of China from 2000 to 2019 and the simulated data of tourism carbon emissions in each province of China from 2020 to 2060 under the low carbon scenario. The following is a brief description of the previous research results, and more specific research details can be found in the article (Zhu et al., Citation2023).
In our team’s previous study, we first used the ‘top-down’ method to measure the tourism carbon emissions of each province in China from 2000 to 2019. The ‘top-down’ approach is a common method for measuring tourism carbon emissions, and it works in the following ways. (1) Counting the energy consumption of tourism-related industries. (2) The energy consumption of the tourism industry is stripped from the energy consumption of tourism-related industries by means of the stripping factor (the share of tourism revenue in the output value of the tertiary industry). (3) Multiplying the energy consumption of the tourism industry and the standard coal conversion factor of energy to obtain the tourism carbon emissions.
Secondly, we simulated the tourism carbon emissions by provinces in China from 2020–2060 based on the STIRPAT model. The specific modus operandi in the study was as follows. (1) The data of four indicators, namely, number of tourists, tourism revenue, carbon intensity of tourism and investment in tourism, are counted for each province from 2000 to 2019. (2) The specific data of the four indicators are substituted into the model, and the model is fitted by using ridge regression analysis to obtain the specific coefficients of each factor, and then the simulation model of tourism carbon emissions in each province is obtained. (3) With reference to the national 14th Five-Year Plan and the 14th Five-Year Plan of each province, we simulated the changes of tourism carbon emissions in each province from 2020 to 2060 under the baseline scenario, the medium scenario and the low carbon scenario, respectively.
Finally, we found by comparison that tourism carbon emissions are generally lower in the low-carbon scenario than in the other two scenarios for each province. Therefore, under the Chinese government’s vision of ‘carbon peaking and carbon neutrality’ goals, we choose to use tourism carbon emissions by province under the low carbon scenario as the basic research data for this paper to carry out the subsequent research.
2.2.2. Measurement and modelling of tourism carbon sinks
In this paper, the measurement and modelling of tourism carbon sinks is based on land use data and grey prediction models. In terms of measurement, as land is the natural spatial carrier of carbon sources and sinks in terrestrial ecosystems, changes in the use of land will cause changes in carbon emissions and carbon sequestration (Zhou et al., Citation2022). Therefore, this paper obtains the overall carbon sink by multiplying the area of different land types by their carbon sequestration coefficients and summing up the overall carbon sink. In addition, the stripping factor is used to obtain the tourism carbon sink. In land use data, construction land is generally used as a carbon source (Zhou et al., Citation2022); the carbon sink of arable land exists for a short period of time and is less stable, and the carbon sink function is not obvious (Fang et al., Citation2007). Consequently, the range of land types selected for carbon sink measurement in this paper is mainly based on woodlands, grasslands, water bodies and unused land. The specific calculation formula is EquationEquation (1)(1)
(1) :
where is the overall carbon sink,
is the area of the
th land type, and
is the carbon sequestration coefficient of the
th land type. Here,
= 1, 2, 3 and 4, denoting Woodland, grassland, water bodies and unused land, respectively. The specific carbon sequestration factors are shown in , and the overall carbon sink is taken as the absolute value of the result calculated in EquationEquation (1)
(1)
(1) .
Table 1. Carbon absorption coefficients for different land types.
Tourism carbon sink refers to the tourism-related carbon sink in the overall carbon sink; specifically, the carbon sink generated by the vegetation of tourism sites. Due to the lack of precise statistics on tourism carbon sinks at this stage, this paper uses the stripping factor method to obtain tourism carbon sinks from the overall carbon sinks, in combination with our team’s previous method of measuring tourism carbon sinks (Zhu & Wang, Citation2022). The stripping factor is the ratio of the area of tourism land to the land area. Tourism land mainly includes forest parks, nature reserves and national scenic spots. The specific calculation formula is EquationEquation (2)(2)
(2) :
where is the tourism carbon sink, and
is the ratio of tourism land area to land area.
In terms of prediction, the modelling of tourism carbon sinks in this paper mainly includes two aspects: land use change and tourism land area change. In addition, the long-term changes in these two aspects will be affected by many complex external factors, such as socio-economic development, regional population growth and decline, and natural environment evolution. These changes will lead to considerable uncertainty in the long-term modelling of tourism carbon sinks (Gao et al., Citation2022; Zhang et al., Citation2022). Grey prediction models can predict data with a small amount of incomplete information, with highly accurate results. Hence, these models are widely used in the research of economic and social development and ecological civilisation construction (Jiang & Wu, Citation2021; Lv & Li, Citation2022). Therefore, this paper chooses to use a grey prediction model to predict the overall carbon sink and the proportion of tourism land area to land area, respectively, and to further calculate the tourism carbon sink. For specific models, refer to the relevant literature [36].
2.2.3. Tourism carbon neutrality index
The TCN index is the ratio of tourism carbon sinks to tourism carbon emissions. This is also a measure of the extent to which tourism has achieved carbon neutrality, which can effectively reflect the dynamic changes between the two and measure the level of green and low-carbon development of regional tourism. The specific calculation formula is EquationEquation (3)(3)
(3) :
where is the tourism carbon neutral index,
is the tourism carbon sink, and
is the tourism carbon emission. When
is less than 1, tourism presents a carbon deficit, and the level of green and low carbon development of tourism is low. When
is equal to 1, tourism presents a carbon neutral state, and the level of green and low carbon development of tourism is moderate. When
is greater than 1, tourism presents a carbon surplus, and the level of green and low carbon development of tourism is high.
2.2.4. Coupled coordination distance model
In order to quantitatively assess the coupling and coordination between tourism carbon emissions and tourism carbon sinks, this paper constructs a coupling and coordination distance model for tourism carbon emissions and carbon sinks. The model is based on the existing two-dimensional planar coupling and coordination model (Z. Q. Wang et al., Citation2022; Zheng et al., Citation2021), and is used to explore the degree of coupling and coordination between tourism carbon emissions and tourism carbon sinks within each province.
The model uses tourism carbon emissions as the horizontal coordinate and tourism carbon sinks as the vertical coordinate to plot the ‘carbon emissions – carbon sinks’ coordinate points of the tourism industry. The higher the degree of coupling between tourism carbon emissions and tourism carbon sinks in a province is, the closer the ‘carbon emissions – carbon sinks’ coordinate points will be to the ‘1:1’ diagonal, i.e. the smaller the distance between the coordinate points and the diagonal. As shown in , <
, indicating that the coupling of tourism carbon emissions and tourism carbon sinks is more coordinated in Province B than in Province A. In addition, when Provinces C and B are at the same distance from the diagonal, this paper introduces the distance between the coordinate point and the limit point (1,1) to further differentiate. When
<
, the coupling of tourism carbon emissions and tourism carbon sinks is more coordinated in Province C. Thus, the coupled coordinating distance
is defined as the sum of the distances between the ‘carbon emissions – carbon sinks’ coordinates of the tourism industry and the diagonal and limit points. The specific calculation formula is EquationEquation (4)
(4)
(4) :
Figure 1. Schematic diagram of the coupled coordination distance model.
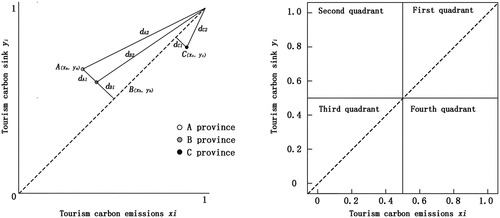
where and
, respectively, are the horizontal and vertical coordinates of the ‘carbon emissions – carbon sinks’ coordinates of the tourism industry, i.e. the normalised carbon emission and carbon sink of the tourism industry, and
is the coupling coordination distance of province
. The smaller the
is, the higher is the coupling coordination between the carbon emission and the carbon sink of the tourism industry in province
.
Since the range of both values is [0,1] after normalisation, this paper uses (0.5,0.5) as the origin of the coordinate system, the X-axis as the level of carbon emission from tourism and the Y-axis as the level of carbon sink from tourism. Also, the ‘carbon emission-carbon sink’ coordinate points are divided into four different quadrants to represent the different degrees of coupling and coordination between tourism carbon emission and tourism carbon sink. The first quadrant represents that the province’s tourism carbon emissions and tourism carbon sinks are, on average, at a high level, and this result belongs in the category of good coupling and coordination. The second quadrant represents that the province’s tourism carbon sink level is ahead of the tourism carbon emission level, and belongs to the type of tourism carbon emission lagging behind tourism carbon sink. The third quadrant represents that the province’s tourism carbon emissions and tourism carbon sinks are close to each other but at a low level. This result belongs to the category of primary coupling and coordination. The fourth quadrant represents the province’s tourism carbon emission level is ahead of the tourism carbon sink level, and belongs to the type of tourism carbon sink lags behind tourism carbon emission.
2.2.5. Modified gravity model and social network analysis
(1) Modified gravity model
The gravitational model originated from gravity in physics and is often used to determine the spatial interaction ability between two individuals; the model can better reflect the spatial association between regions. This paper, drawing on existing research results (J. Liu & Song, Citation2018; K. Wang et al., Citation2020; Yu & Ma, Citation2018) has modified the gravitational model by introducing variables into the model, such as the tourism carbon neutral index. The specific formula of the modified gravitational model is Equation (5):
where is the spatial correlation strength of the tourism carbon neutral index between provinces
and
;
is the contribution of province
to
;
and
are the total tourism income of provinces
and
, respectively;
is the spherical distance between the provincial capitals of provinces
and
, and
and
are the tourism income per capita of provinces
and
, respectively. The ratio between them is used to characterise the combined distance between provinces
and
, i.e.
.
The association strength matrix of carbon neutrality in tourism can be calculated from EquationEquation (5)(5)
(5) . However, compared with the numerical matrix, the relationship matrix can better reflect the characteristics of the spatial association network of carbon neutrality in tourism (Zhang, Citation2017). Therefore, this paper refers to the processing methods of Liu et al (H. J. Liu et al., Citation2015). and Wang et al (K. Wang et al., Citation2020), and selects the average value of each row of the matrix as the critical value. If the value in the matrix is greater than the average of the rows in which the value is located, the value is assigned as 1, indicating the existence of an association relationship between two provinces. Otherwise, the value is assigned as 0, indicating the absence of an association relationship. This is the method used to obtain the spatial association relationship matrix of carbon neutrality in tourism.
(2) Social network analysis
Social network analysis is a quantitative approach to the relational structure of social networks and their attributes. This type of analysis is often used to study the characteristics of the relationships between members of a network. Therefore, this paper draws on existing research (C. Wang et al., Citation2022; Deng et al., Citation2022) and uses social network analysis to explore the structure and evolution of the spatially linked network of carbon neutrality in tourism, both in terms of overall network characteristics and individual network characteristics.
The main indicators of overall network characteristics include network density, network hierarchy and network efficiency. Network density is used to reflect the closeness of the spatial network, with higher values indicating closer spatial connections between members. Network hierarchy is used to reflect the degree of asymmetric accessibility of nodes and the hierarchical structure among members. Larger values indicate a more rigid hierarchical structure among members, with a few members in the dominant position and most members in the peripheral position. Network efficiency reflects the degree of redundancy in the network and the efficiency of the connections between members. Here, smaller values indicate a tighter connection between members and a more stable network structure. The specific formulae for the above indicators are Formula (6), Formula (7) and Formula (8), respectively.
where ,
and
are network density, network rank and network efficiency, respectively;
is the actual number of relationships;
is the total number of members;
is the number of symmetrically reachable point pairs;
is the maximum number of symmetrically reachable point pairs;
is the number of redundant lines, and
is the maximum possible number of redundant lines.
The main indicators of individual network characteristics include out-degree, in-degree and centrality. Out-degree is a measure of a member’s influence on other members in the spatial network. A higher value means that the member’s influence is greater, the radiation effect is stronger, and the member is able to send out affiliations to other members on the member’s own initiative.
In-degree is a measure of the attractiveness of a member to other members in the spatial network. A higher value means that the member is more attractive, has a stronger reception effect, and is able to successfully receive associations from other members.
Centrality is a measure of the power of a member to moderate other members in the spatial network. A higher value means that the member is more powerful in terms of connecting to other members, and also indicates a stronger mediating effect. Such members can effectively transmit the relations sent by other members. The specific formulae for the above indicators are Formula (9), Formula (10) and Formula (11), respectively:
where ,
and
are the out-degree, in-degree and centrality of province
, respectively;
indicates the existence of inter-provincial association and is assigned a value of 1 if this association exists, and 0 if it does not.
3. Data sources
Due to limitations in data availability, data from Hong Kong, Macau, Taiwan and Tibet are not included in this paper; the remaining 30 provinces are used as the scope of the study. The basic data of energy end-use consumption involved in this paper were obtained from the China Energy Statistical Yearbook. The basic data of land use were obtained from the PIE-Engine remote sensing cloud service platform. Finally, ArcGIS software was used to classify and merge the basic data to determine the six major land use types: arable land, forest land, grassland, water bodies, construction land and unused land. Basic tourism data, such as tourism revenue, number of tourists and output value of the tertiary industry, were obtained from provincial statistical yearbooks and the National Economic and Social Development Statistical Bulletin. Some missing data have been supplemented by linear interpolation. The basic data for nature reserves and forest parks were obtained from the China Forestry and Grassland Statistical Yearbook, in which statistics on the area of nature reserves in 2000 were missing. Therefore, the carbon sink of tourism in each province in 2000 was not measured, and the basic data for national scenic spots were obtained from the China Urban Construction Statistical Yearbook. The data on the 14th Five-Year Plan and the area of the country were obtained from provincial government websites.
4. Analysis of results
4.1. Analysis of carbon balance measurement in the tourism sector
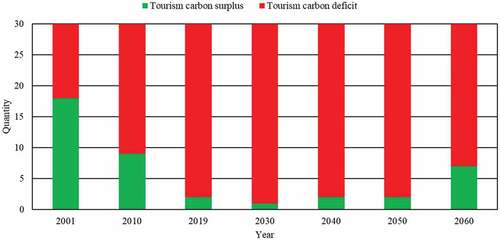
Based on the measurement and modelling of tourism carbon emissions and tourism carbon sinks, for the past 20 years and the next 40 years, the carbon balance of tourism by province for different periods was synthesised (). Overall, China’s tourism carbon surplus rate appears to evolve in a ‘downward – upward’ trend over the study period. Specifically, in the last 20 years, along with the rapid development of China’s tourism industry, the carbon emissions of the tourism industry in all provinces have been increasing. This has resulted in a rapid decline in the overall tourism carbon surplus ratio, from 60.00% to 6.67%. In the next 40 years, under the constraints of the ‘carbon peaking and carbon neutrality’ goals, the overall tourism carbon surplus ratio will rebound, gradually increasing from 3.33% to 23.33%. Currently, 2030 is the goal year set by China for carbon peaking, at which time China’s overall tourism carbon surplus should reach its lowest value. In 2030, only Heilongjiang’s tourism carbon sink will be higher than its tourism carbon emissions. The year 2060 is the goal year set by China for carbon neutrality. Even though the tourism industry will increase its carbon surplus rate during this period, only seven provinces – Hainan, Yunnan, Hunan, Sichuan, Qinghai, Neimenggu and Heilongjiang – will be in carbon surplus. Hence, the outlook for the achievement of carbon neutrality in the tourism industry is not optimistic.
Figure 2. Dynamics of China’s provincial tourism carbon balance, 2001–2060.
4.2. A coupled and coordinated analysis of carbon emissions from tourism and carbon sinks in tourism
According to the ‘carbon emission – carbon sink’ coupled coordination distance model, the coupled coordination between tourism carbon emission and tourism carbon sink in each province is analysed; the results are shown in .
Figure 3. Analysis of the degree of coupling and coordination between tourism carbon emissions and tourism carbon sinks by province, 2001–2060.
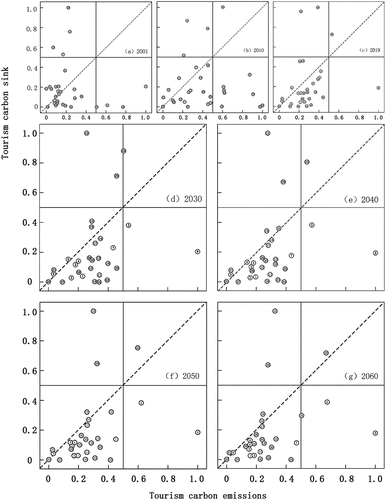
As can be seen from , overall, the majority of provinces in the study period are concentrated in the third quadrant, with the level of tourism carbon emissions and tourism carbon sinks below 0.5. This finding means that the development of tourism carbon emissions and tourism carbon sinks in each province has a certain degree of coordination. However, overall, they are all at a low level and belong to the stage of primary coupling and coordination. Specifically, the overall distribution structure has been more variable in the last 20 years than it will be in the next 40. In particular, the number of provinces located in the fourth quadrant has experienced greater ups and downs; specifically, the number of provinces in the fourth quadrant was four, eight and one in 2001, 2010 and 2019, respectively. One possible reason for this is that the early development of tourism focused more on the pursuit of economic benefits, and frequent tourism development and tourism activities led to a rapid increase in carbon emissions from tourism. This exacerbated the development gap between carbon emissions and carbon sinks. Also, since the 18th National Congress of the Communist Party of China, vigorously promoting ecological civilisation has become a social consensus. The tourism industry, influenced by the concept of sustainable development, has begun to focus on the ecological benefits of tourism development. The industry is now implementing energy-saving and emission reduction measures, effectively reducing carbon emissions and promoting a coordinated development between tourism carbon emissions and tourism carbon sinks.
Under the ‘carbon peaking and carbon neutrality’ goals, the overall distribution structure over the next 40 years will be relatively stable. Among the various provinces, Sichuan will be located in the first quadrant for a long time and will have the smallest coupling coordination distance. This indicates that both tourism carbon emissions and tourism carbon sinks are at a high level in Sichuan, and there is a high degree of coupling coordination between them. Shanghai will be located in the third quadrant for a long time, but its coupling coordination distance is the largest. This indicates that there is a low degree of coupling coordination between tourism carbon emissions and tourism carbon sinks in Shanghai. It is also evident from that Shanghai’s tourism carbon sink capacity is very weak, leading to an imbalance in the development of emissions and sinks. The possible reason for this is that Shanghai, as one of the major destinations and distribution centres for inbound tourism in China, is under greater pressure to engage in activities that produce carbon emissions. The small size of the province (compared to Sichuan) and the high level of urbanisation in Shanghai leads to a very weak carbon sink from forest vegetation. This makes it difficult to create a coherent development of carbon emissions from tourism and carbon sinks from tourism.
4.3. Analysis of the spatially linked network characteristics of carbon neutrality in the tourism sector
4.3.1. Overall network characteristics and evolutionary trends
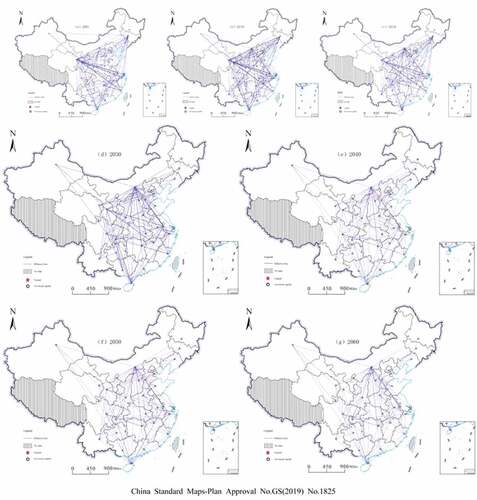
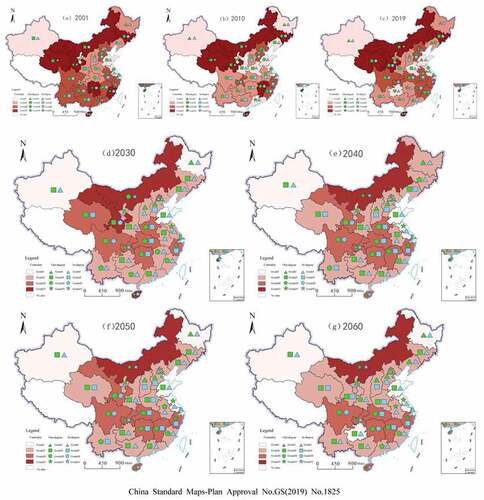
Using the modified gravity model to measure the strength of inter-provincial TCN linkages, a linkage strength matrix was constructed. The linkages were determined by averaging, and a visual network diagram of the linkages was formed (). The complexity of the inter-provincial tourism carbon-neutral spatial association network pattern was reduced during the study period. The network pattern in the last 20 years was more complex and had a certain degree of tendency, with Neimenggu, Gansu and Qinghai at the centre of the linked network and having closer links with other provinces. In comparison, the network pattern in the next 40 years will be simpler but more balanced, with Neimenggu, Sichuan and Hainan at the centre of the linked network and having more spatial links with other provinces.
Figure 4. Structure of a carbon-neutral spatial correlation network for tourism in China, 2001–2060.
The overall network density, network level and network efficiency for 2001–2060 were further measured by using the inter-provincial tourism carbon neutral relationship matrix (). As can be seen from , in general, the network density shows a cyclical fluctuating downward evolutionary trend during the study period, with an average value of only 0.1691. This finding indicates that the tightness of the spatial association of TCN among provinces is relatively low. In addition, the network structure tends to be loose, and the spatial cooperation and interaction of inter-provincial TCN needs to be enhanced. As the time series progresses, the network hierarchy will evolve in a roughly ‘up-down-up’ pattern, peaking in 2019, then declining rapidly and increasing slightly at the end of the study period. The uneven development of tourism in the last 20 years has led to a gradual imbalance in tourism carbon emissions and sinks between provinces. The result has been a more rigid hierarchy, with individual provinces in a dominant position and most provinces in a subordinate position. In contrast, the network hierarchy over the next 40 years will fluctuate somewhat but will be at a lower level overall. This indicates that the relatively strict hierarchy of spatial linkages is gradually being broken down; the spatial linkages of carbon neutrality in tourism are being enhanced, and the position of provinces in the network structure is becoming more balanced. In contrast to network density, in general, network efficiency shows a cyclical fluctuating upward evolutionary trend during the study period. Specifically, the average values of network efficiency for the last 20 years was 0.7414 and for the next 40 years will be 0.8097. These results indicate that the spatial linkages of carbon neutrality in tourism among provinces in the next 40 years will be relatively loose, and the stability of the network structure will have decreased to a certain extent.
Table 2. Trends in the evolution of the overall network characteristics of carbon neutrality in China’s tourism industry.
4.3.2. Individual network characteristics and evolutionary trends
This study explores the position of each province in the tourism carbon-neutral spatial linkage network in terms of three levels: out-degree, in-degree and centrality. The key nodal provinces are identified in this way. The outbound, inbound and central degrees of each province in the tourism carbon-neutral spatial linkages network are calculated according to EquationEquations (9)(9)
(9) , (Equation10
(10)
(10) ) and (Equation11
(11)
(11) ), and each degree is classified into four levels using the natural discontinuity classification.
As can be seen from , a weakening trend clearly existed in both the out-degree and the in-degree over the last 20 years, with a gradual shift from Grade IV to Grade I in general, and a large change in the provinces included in each grade. These findings indicate that the tourism carbon-neutral spatial association network was more active during this period. However, its radiative and receptive effects appeared to be extreme, and the inter-provincial gap gradually widened. Compared to the out-degree and the in-degree, the centrality scale has a lesser tendency to weaken, and the provinces included in each scale change less, showing some solidity. Spatially, the out-degree and the in-degree show a distribution pattern of ‘high in the south and low in the north’ and ‘high in the north and low in the south’, respectively. This indicates that the southern provinces have mainly played the role of senders in the spatial association network, while the northern provinces have mainly played the role of receivers. Unlike the out-degree and in-degree, centrality shows a relatively ‘high north-south, low middle’ distribution pattern in space. Also, as the time series progresses, the high value area in the south gradually shifts northwards, and eventually becomes stable in the provinces along the Yangtze River basin. In terms of specific provinces, Zhejiang has remained stable at the out-degree grade IV for a long time. This indicates that Zhejiang is at the centre of radiation and is more likely to send out spatial association relations to other provinces; Qinghai, Gansu and Neimenggu have basically remained stable at the in-degree grade IV, indicating that they are at the receiving centre and have a strong attraction in the spatial association network. Hainan, Jilin, Qinghai, Gansu and Neimenggu have remained at the centrality grade IV for a long time, indicating that they are at the centre of the network and can play a strong moderating role in the spatial association network, forming a close two-way interaction with other provinces.
Figure 5. Hierarchy of carbon neutral spatial network centers in China’s tourism industry, 2001–2060.
Unlike the last 20 years, under the ‘carbon peaking and carbon neutrality’ goals, the provinces included in the out-degree and the in-degree will change less in the next 40 years, forming a relatively stable hierarchy. Spatially, the distribution pattern of out-degree and in-degree will be more or less the same as in the last 20 years and tends to be stable. However, two major trends have emerged: firstly, the distribution range of out-degree high values will gradually shift northwards, forming a concentration area of out-degree high values with the Yangtze River Economic Belt as the core. Secondly, the distribution range of in-degree high values will start to shrink, with the number of provinces belonging to the in-degree Grade I increasing and constantly splitting the in-degree high value area. In addition, centrality grades will still tend to weaken, but the magnitude of change will shrink even further, forming a more stable grade structure. In line with out-degree, high values of centrality will mainly be distributed in the provinces along the Yangtze River Economic Belt, and will gradually decrease in both directions to the north and south. In terms of specific provinces, Hainan, Jiangsu, Zhejiang and Neimenggu will be basically stable at the out-degree Grade IV. This indicates that these provinces will be at the centre of radiation and will be more likely to exert radiation effects on other provinces in the spatially linked network. Neimenggu will be stable at the in-degree Grade IV and the centrality Grade IV for a long time. This indicates that Neimenggu will be at both the receiving centre and the centre of the network, with strong receiving and intermediary effects, and will also be in an active position in the spatially linked network.
In general, over the time series, a stable hierarchy and distribution pattern of the out-degree, in-degree and centrality will gradually emerge, with each province showing some solidity in its role in the tourism carbon and spatially linked network. Among them, Zhejiang has long been at a high level of out-degree, while Neimenggu has long been at a high level of in-degree and centrality. These two provinces will play a key role in the spatially linked network. In addition, the Yangtze River Economic Belt will be at the heart of the spatial linkage network and will be of great significance in promoting and achieving the green and low-carbon development of China’s tourism industry.
4.4. Spatial identification of carbon neutral zoning in the tourism sector
In order to effectively promote the successful achievement of carbon neutrality in China’s tourism industry, this paper synthesises the results of the previous analysis on the degree of coordinated development between carbon revenues and expenditures, carbon emissions and carbon sinks in the tourism industry in each province, and the characteristics of the spatially linked network of carbon neutrality in the tourism industry. This is combined with the theoretical concept of carbon neutrality, and relevant data for the year 2060, the goal year of China’s carbon neutrality, are selected. The functions undertaken by each province in China’s tourism industry carbon neutrality goal are identified from the perspective of the spatial flow of carbon sinks ().
Figure 6. Functional zoning map for carbon neutrality in China’s tourism industry.
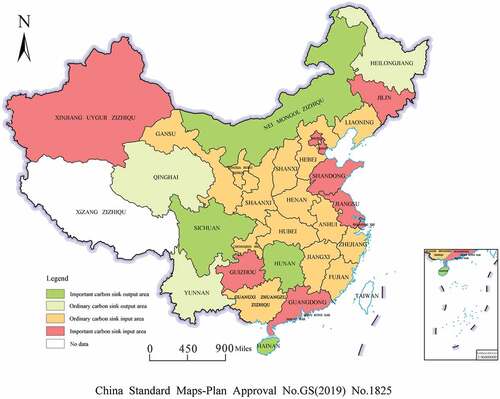
Identification criteria (1) Tourism carbon balance is the primary identification criterion for tourism carbon sink output areas and input areas. In spatial identification, tourism carbon balance can reflect the relationship between tourism carbon emissions and tourism carbon sinks. When tourism is in carbon surplus, the carbon sink amount is more than the carbon emission amount. When tourism is in carbon deficit, the carbon sink amount is less than the carbon emission amount. Thus, each region is divided into overall carbon sink output area and overall carbon sink input area, respectively. (2) The carbon sink output area mainly transfers the tourism carbon sink to the carbon sink input area; this requires better radiation output capacity. The carbon sink input area mainly receives the tourism carbon sink transferred from the carbon sink output area, and this requires better absorption input capacity. Therefore, in the spatial identification, the output and input areas are prioritised by the out-degree and the in-degree, respectively. For example, important carbon sink output areas are at the heart of TCN and have a high-quality radiative effect. These areas are driven to achieve TCN by issuing linkages to input areas. (3) China is a vast country with varying inter-provincial proximity. Therefore, each province needs to have a certain degree of intermediary capacity to act as a bridge to support the spatial flow of carbon compensation in the tourism carbon compensation process. The degree of coupling and coordination is a reflection of the relationship between the development of tourism carbon emissions and tourism carbon sinks within a province, and can characterise the level of development of both. Therefore, centrality and the degree of coupling coordination are used as complementary identification criteria in spatial identification. The specific zoning and identification criteria are shown in .
Table 3. Regional classification and identification criteria for carbon neutrality in China’s tourism industry.
From , one can find that the overall carbon sink output areas are mainly located in the marginal provinces in northern and western China. Among them, the number of important carbon sink output areas accounted for 13.33% of the total area, mainly containing four provinces, including Neimenggu, Sichuan, Hainan and Hunan. These areas have outstanding carbon sink levels (compared to carbon emission levels) and possess large carbon surpluses. They are also the core area of China’s tourism carbon sink function, and are in a strategic position to undertake important carbon sink output tasks in achieving the tourism carbon neutral goal. The number of ordinary carbon sink output areas accounts for 10.00% of the total area and mainly contains three provinces, Heilongjiang, Qinghai and Yunnan. These areas have relatively weak carbon sink functions and radiative effects, and lack the spatial flow capacity of tourism carbon sinks. However, an output area can alleviate the carbon emission spillover and heat island effect of the input areas, assist in transferring and regulating the spatial flow of tourism carbon sinks, and sharing the pressure of the important output areas in terms of carbon sink output, while increasing the area’s potential to become an important output area.
The overall carbon sink input areas are concentrated and contiguous in the eastern and central regions of China. Among them, the number of important carbon sink input areas accounts for 30.00% of the total, and mainly contains nine provinces, including but not limited to Beijing, Shandong and Guangdong. These provinces are mostly located in China’s eastern coastal areas; they have a good economic base, high urbanisation rate and more frequent tourism development and tourism activities. The result is much higher carbon emissions than carbon sinks, and insufficient capacity to reduce emissions and increase sinks on their own. These factors are forming a huge carbon deficit pressure, and the areas’ receiving effect is weak. There is an urgent need to focus on solving the problem of achieving carbon neutrality in the tourism industry, so as to promote the achievement China’s goal of the overall carbon neutrality the country’s tourism industry. The number of ordinary carbon sink input areas is 46.67%, and is mainly comprised of 14 provinces, including but not limited to Shanxi, Henan and Hubei, which are mostly located in central China. Compared to the important input areas, the provinces in the ordinary input areas have had a late start in tourism development and are relatively backward in these terms. However, this puts less pressure on these areas in terms of carbon emissions. At the same time, the ordinary input areas have stronger receiving capacity and more obvious intermediary effects, and are able to absorb the transferred tourism carbon sinks from the output areas more smoothly. This will make it easier to achieve carbon neutrality in tourism.
5. Discussion
Firstly, this paper finds that China’s tourism carbon surplus rate will go through a process of decline to rebound over the next 40 years, reaching a trough in 2030 and then rebounding to reach a peak in 2060. This finding is in line with the development trend of the Chinese government’s ‘carbon peaking and carbon neutrality’ goals strategy and is consistent with the trends suggested by studies by Ma et al (X. Ma et al., Citation2021), Tang et al (C. C. Tang et al., Citation2021), Gao et al (Gao et al., Citation2022). and Zhang et al (Zhang et al., Citation2022). However, it is worth noting that only seven provinces will be in a carbon surplus state in 2060, so China still faces great difficulties and challenges in becoming carbon neutral in tourism.
Secondly, the eco-efficiency of tourism in China is highly spatially unstable, with significant differences in spatial exchange between different provinces. Consistent with the findings of Liu et al (D. Liu et al., Citation2021), this paper further validates this point by exploring the evolutionary trends of the tourism industry’s carbon-neutral spatial network structure. Meanwhile, in the exploration of inter-provincial tourism carbon neutral spatial linkages, this paper finds that Neimenggu is long at the centre of the linkage network. There are two possible reasons for this. The first reason is that Neimenggu itself is vast, especially with a very large east-west span and a large number of bordering provinces, making it easier to create spatial links with other provinces. The second reason is that Neimenggu has high quality and abundant forest and grass resources such as Hulunbeier grassland, Xilingole grassland and Daxinganling forest area, which can bring a lot of carbon sink resources (F. Wang et al., Citation2021). Moreover, the prevalence of mountain tourism and grassland tourism in Neimenggu can also promote the sustainable development of local tourism (L. Zeng et al., Citation2022), further solidifying Neimenggu’s dominant position in the flow of carbon sinks.
Finally, unlike the spatially linked network of decoupling tourism growth and carbon emissions constructed by Deng et al (Deng et al., Citation2022), this paper finds that in the spatial network of carbon neutrality in tourism, provinces in the western region are at the centre of the network and have more control over the network. Meanwhile, provinces in the eastern region are relatively marginal and play the role of passive receivers in the network. This shows that the economic and ecological benefits of tourism development may, to some extent, be in a changing relationship, and that care should be taken to reconcile the two in the process of achieving carbon neutrality in tourism.
6. Conclusion
Based on the measurement and simulation of tourism carbon emissions and tourism carbon sinks, in the past 20 years and for the next 40 years, this paper integrates the coupled coordination distance model, modified gravity model and social network analysis. The aim is to explore the synergistic development relationship between tourism carbon emissions and tourism carbon sinks, as well as to explore the spatial network structure of China’s TCN. The functional partition of China’s TCN is also identified. The main findings are as follows:
In terms of carbon balance, China’s tourism carbon surplus rate shows a ‘downward – upward’ trend from 2001 to 2060, and will reach a low of 3.33% in 2030. The surplus rate will rise to 23.33% in 2060, with seven provinces, including Hainan, Yunnan and Hunan, in a carbon surplus position.
In terms of coupling coordination, the majority of provinces are concentrated in the third quadrant from 2001 to 2060; the third quadrant belongs to the stage of primary coupling coordination. The overall distribution structure over the last 20 years has been more variable; in particular, the number of provinces in the fourth quadrant has experienced large fluctuations. The overall distribution structure over the next 40 years will be more stable, with the highest coupling coordination in Sichuan and the lowest coupling coordination in Shanghai.
In terms of overall network characteristics, the structure of China’s tourism carbon-neutral spatial network will tend to loosen from 2001 to 2060, with a decline in both morphological complexity and structural stability. There will also be a gradual breakthrough of the rigid hierarchical structure, with each province’s position in the network structure becoming more balanced. In terms of individual network characteristics, as the time series progresses, a stable hierarchical structure and distribution pattern will gradually be formed for out-degree, in-degree and centrality, and the role played by each province in the tourism carbon and spatial network will tend to solidify. Among them, the provinces belonging to the Yangtze River Economic Belt will be at the core of the spatial network, and this is of great importance for China to achieve carbon neutrality in tourism.
In terms of spatial identification, by establishing identification criteria, this study found that the overall carbon sink input areas were much more numerous than the overall carbon sink output areas. The former are mainly located in the marginal provinces of northern and western China, and the latter are mainly concentrated in the eastern and central regions of China.
7. Policy recommendations
Based on the above empirical findings, this paper proposes the following policy recommendations, which are made with a view to constructing a diversified tourism carbon offset system:
First, strengthen government leadership and promote ecological transfer. The central government should establish a holistic view, break down administrative barriers, and formulate and optimise a carbon-neutral action plan for tourism from a holistic perspective. The tasks of different regions in terms of the overall TCN target should be fairly allocated. Through rational zoning, provinces such as Hunan, Yunnan and Neimenggu should be classified as carbon sink output areas; provinces such as Beijing, Shandong and Shanghai should be classified as carbon sink input areas. Such designations would clarify the development positioning of different regions and promote the efficient flow of tourism carbon sink resources from carbon sink output areas to carbon sink input areas. In addition, the core position of the Yangtze River Economic Belt must be highlighted, and this regions must play the role of a bridge, to efficiently undertake and facilitate the inter-provincial carbon sink flows and activate the ecological potential of tourism development.
Second, build a trading system and strengthen regional linkages. The central government should optimise the tourism carbon sink trading system, construct a tourism carbon sink trading sub-system, and build a tourism carbon sink trading platform. The carbon trading market should be used to expand carbon sink trading channels and enhance regional linkages. Tourism carbon deficit provinces in the east and centre (such as Zhejiang, Tianjin and Jiangsu) should acquire tourism carbon sinks from tourism carbon surplus provinces in the west and north (such as Qinghai, Sichuan and Heilongjiang). This can be achieved through funding purchases, preferential policies and key assistance in trading, in order to promote the smooth realisation of carbon neutrality in the local tourism industry.
Finally, encourage voluntary compensation and promote social participation. Governments in carbon deficit provinces should provide carbon offset trading platforms and formulate carbon offset trading policies. The aim should be to guide tourism enterprises and individual travellers to voluntarily compensate for carbon. At the enterprise level, carbon deficit enterprises in developed tourism economies, such as Beijing, Shanghai and Guangdong, should take the initiative to strengthen ties with carbon surplus enterprises in the west and north of the country. These enterprises should also provide carbon offsetting through technical guidance, management guidance and marketing guidance. At the individual level, tourists in carbon deficit areas should actively participate in carbon offsetting activities, offsetting the carbon emissions created directly or indirectly during their own travels through funding. They should also help to achieve carbon neutrality in the local tourism industry by actively participating in tree planting projects or environmental activities.
7.1. Fund support
Humanities and Social Sciences Planning Project, Ministry of Education, China (21YJAZH085); National Natural Science Foundation of China (42261038).
7.2. Author introduction
Zhu Hai (1997-), Male, Hunan, China, Master, research interests are tourism ecology, tourism geography, Email:935427446@qq. com; Wang Liguo (1975-), Male, Jiangxi, China, PhD, Professor, PhD supervisor, research interests are tourism ecology, tourism geography
Disclosure statement
No potential conflict of interest was reported by the authors.
Additional information
Funding
References
- Cheng, Z. H., Wang, Z., & Ma, Z. X. (2020). Analysis of tourism carbon equilibrium in Taiyuan City from a low-carbon perspective. Chinese Journal of Ecology, 39(06), 2051–2060.
- China Tourism Research Institute. (2020). Basic tourism market situation in 2019.
- Deng, Z., Zhou, M., & Xu, Q. (2022). How to decouple tourism growth from carbon emissions? A spatial correlation network analysis in China. Sustainability, 14(19), 11961. https://doi.org/10.3390/su141911961
- Fang, J. Y., Guo, Z. D., Pu, S. L., & Chen, A. P. (2007). Terrestrial vegetation carbon sinks in China, 1981–2000. Scientia Sinica(Terrae), 06(9), 804–812. https://doi.org/10.1007/s11430-007-0049-1
- Feng, J., & Wang, T. (2016). Analysis of influencing factors and evolution of land use carbon emission in China. Soft Science, 30(5), 87–90.
- Gao, F., Lu, K. X., Qiao, Z., Ma, F. K., & Jiang, Q. O. (2022). Assessment and prediction of carbon neutrality in the eastern margin ecotone of Qinghai⁃Tibet Plateau. Acta Ecologica Sinica, 42(23), 9442–9445. https://doi.org/10.5846/stxb202112093500
- Geng, Y., Wei, Z., Zhang, H., & Maimaituerxun, M. (2020). Analysis and prediction of the coupling coordination relationship between tourism and air environment: Yangtze river economic zone in China as example. Discrete Dynamics in Nature & Society, 2020, 1–15. https://doi.org/10.1155/2020/1406978
- Gössling, S. (2002). Global environmental consequences of tourism. Global Environmental Change, 12(4), 283–302. https://doi.org/10.1016/S0959-3780(02)00044-4
- Hou, Z. M., Luo, J. S., Cao, C., & Ding, G. S. (2023). Development and contribution of natural gas industry under the goal of carbon neutrality in China. Advanced Engineering Sciences, 55(01), 243–252.
- Jiang, X. Y., & Wu, X. L. (2021). Quantitative investigation of the coordinated development of ecology-economy-society in forest resource-based city: A case study of Yichun,Heilongjiang Province. Acta Ecologica Sinica, 41(21), 8396–8407. https://doi.org/10.5846/stxb202009072321
- Kurniawan, T. A., Othman, M. H. D., Liang, X., Goh, H. H., Gikas, P., Chong, K. K., & Chew, K. W. (2023). Challenges and opportunities for biochar to promote circular economy and carbon neutrality. Journal of Environmental Management, 332, 117429. https://doi.org/10.1016/j.jenvman.2023.117429
- Li, S., & Lv, Z. (2021). Do spatial spillovers matter? Estimating the impact of tourism development on CO2 emissions. Environmental Science and Pollution Research, 28(25), 32777–32794. https://doi.org/10.1007/s11356-021-12988-6
- Liu, Z. M., Huang, X. J., Lu, X. H., Li, S. F., & Qi, X. X. (2022). China’s carbon neutrality path prediction under the shared social economic paths. Acta Geographica Sinica, 77(09), 2189–2201.
- Liu, H. J., Liu, C. M., & Sun, Y. N. (2015). Spatial correlation network structure of energy consumption and its effect in China. China Industrial Economics, 13(5), 83–95.
- Liu, J., & Song, Q. Y. (2018). Space network structure and formation mechanism of green innovation efficiency of tourism industry in China. China Population, resources and Environment, 28(8), 127–137.
- Liu, D., Yang, D., & Huang, A. (2021). Leap-based greenhouse gases emissions peak and low carbon pathways in China’s tourist industry. International Journal of Environmental Research and Public Health, 18(3), 1218. https://doi.org/10.3390/ijerph18031218
- Li, R. Y. M., Wang, Q. Q., Zeng, L. Y., & Chen, H. (2023). A study on public perceptions of carbon neutrality in China: Has the idea of ESG been encompassed? Frontiers in Environmental Science, 10, 1032. https://doi.org/10.3389/fenvs.2022.949959
- Li, S. S., & Yang, W. T. (2022). New theory advances in carbon peak and carbon neutrality research and exploration of promotion paths. Journal of Dongbei University of Finance and Economics, 140(02), 17–28.
- Lv, J. Y., & Li, Y. (2022). Research on the decoupling effect, driving factors and forecast of China’s carbon emissions. Environmental Science & Technology, 45(02), 210–220.
- Ma, X., Han, M., Luo, J., Song, Y., Chen, R., & Sun, X. (2021). The empirical decomposition and peak path of China’s tourism carbon emissions. Environmental Science and Pollution Research, 28(46), 66448–66463. https://doi.org/10.1007/s11356-021-14956-6
- Ma, Y., & Jiang, H. Z. (2022). Low-carbon tourism development model and enhancement strategy under carbon neutrality. Tourism Tribune, 37(05), 1–3.
- Meng, W., Xu, L., Hu, B., Zhou, J., & Wang, Z. (2017). Reprint of: Quantifying direct and indirect carbon dioxide emissions of the Chinese tourism industry. Journal of Cleaner Production, 163, S401–409. https://doi.org/10.1016/j.jclepro.2016.03.177
- Pan, Y., Weng, G., Li, C., & Li, J. (2021). Coupling coordination and influencing factors among tourism carbon emission, tourism economic and tourism innovation. International Journal of Environmental Research and Public Health, 18(4), 1601. https://doi.org/10.3390/ijerph18041601
- Ren, J. (2022). High-quality development of tourism under the goal of “carbon peaking and carbon neutrality”. Tourism Tribune, 37(05), 12–13.
- Tang, C. C., Zha, J. P., Zhang, J. K., Tao, Y. G., Wang, L. G., Wang, L., & Han, Y. (2021). The goal of China’s tourism industry carbon peak and neutrality(dual-carbon) in the context of high-quality development: Evaluation and prediction, major challenges, and approach. Journal of Chinese Ecotourism, 11(04), 471–497.
- Tang, C., Zhong, L., & Jiang, Q. O. (2018). Energy efficiency and carbon efficiency of tourism industry in destination. Energy Efficiency, 11(3), 539–558. https://doi.org/10.1007/s12053-017-9598-0
- Tian, L., & Liu, L. (2022). Carbon neutral strategy options for tourism. Tourism Tribune, 37(05), 6–8.
- Tu, W., & Liu, Q. P. (2022). Environmental risk assessment of tourism carbon emission in jiangsu province based on forest carbon sink threshold. Forest Resources Management, 51(01), 86–94.
- Wang, F., Harindintwali, J. D., Yuan, Z., Wang, M., Wang, F., Li, S., Chen, J. M. (2021). Technologies and perspectives for achieving carbon neutrality. The Innovation, 2(4), 100180. https://doi.org/10.1016/j.xinn.2021.100180
- Wang, Q., Mao, Z., Xian, L., & Liang, Z. (2019). A study on the coupling coordination between tourism and the low-carbon city. Asia Pacific Journal of Tourism Research, 24(6), 550–562. https://doi.org/10.1080/10941665.2019.1610002
- Wang, Z. Q., Qin, M. L., Tang, S. B., Zhao, Y. C., Pang, Y. Y., & Gong, Y. H. (2022). Spatio-temporal variation of landuse carbon budget and carbon compensation zoning in Beibu Gulf Urban Agglomeration Area. Bulletin of Soil and Water Conservation, 42(05), 348–359.
- Wang, C., Xu, L., Huang, M., Su, X., Lai, R., & Xu, A. (2022). Research on the evolution of spatial network structure of tourism eco-efficiency and its influencing factors in China’s provinces based on carbon emission accounting. PLoS One, 17(9), e0272667. https://doi.org/10.1371/journal.pone.0272667
- Wang, K., Zhang, S. W., Gan, C., Yang, Y. P., & Liu, H. L. (2020). Spatial network structure of carbon emission efficiency of tourism industry and its effects in China. Scientia Geographica Sinica, 40(3), 344–353.
- Wei, Y. R., & Chen, S. L. (2021). Spatial correlation and carbon balance zoning of land use carbon emissions in Fujian Province. Acta Ecologica Sinica, 41(14), 5814–5824. https://doi.org/10.5846/stxb202006301705
- World Tourism Cities Federation. (2020). World tourism economic trends report (2020).
- World Tourism Organization. (2008). Climate change and tourism: Responding to global challenges.
- Wu, C. Z., & Ouyang, Y. J. (2022). Environmental responsibility of tourism under the goal of “double carbon”. Tourism Tribune, 37(05), 8–10.
- Xi, J. P. (2020). Building on past achievements and launching a new journey for global climate actions - Speech at the Climate Ambition Summit. China Environment Supervision, 58(12), 9.
- Yuan, S. F., & Tang, Y. Y. (2019). Spatial differentiation of land use carbon emission in the Yangtze river economic belt based on low carbon perspective. Economic Geography, 39(2), 190–198.
- Yu, J. K., & Ma, J. Q. (2018). Spatial pattern evolution of economic links in Shandong Peninsula Urban Agglomeration. Acta Geographica Sinica, 38(11), 1875–1882.
- Zeng, L., Li, R. Y. M., Nuttapong, J., Sun, J., & Mao, Y. (2022). Economic development and mountain tourism research from 2010 to 2020: Bibliometric analysis and science mapping approach. Sustainability, 14(1), 562. https://doi.org/10.3390/su14010562
- Zeng, L. Y., Li, R. Y. M., & Zeng, H. L. (2022). Weibo users and academia’s foci on tourism safety: Implications from institutional differences and digital divide. Heliyon, 9(3), e12306. https://doi.org/10.1016/j.heliyon.2022.e12306
- Zha, J. P. (2016). Reducing carbon emissions in China’s tourism industry. Tourism Tribune, 31(09), 101–112.
- Zha, J., Dai, J., Ma, S., Chen, Y., & Wang, X. (2021). How to decouple tourism growth from carbon emissions? A case study of Chengdu, China. Tourism Management Perspectives, 39, 100849. https://doi.org/10.1016/j.tmp.2021.100849
- Zhai, X. T., & Luo, Q. J. (2023). Rational or emotional? A study on Chinese tourism boycotts on social media during international crisis situations. Tourism Management Perspectives, 45, 101069. https://doi.org/10.1016/j.tmp.2022.101069
- Zhang, Y. (2017). Study on Chinese provincial collaborative carbon reduction based on spatial correlation network structure. Statistics & Information Forum, 32(02), 63–69.
- Zhang, Y., Li, X. G., & Wen, Y. L. (2022). Forest carbon sequestration potential in China under the background of carbon emission peak and carbon neutralization. Journal of Beijing Forestry University, 44(1), 38–47.
- Zhao, R. Q., Liu, Y., Li, Y. X., Ding, M. L., Zhang, Z. P., Chuai, X. W., & Jiao, S. X. (2015). Overview of regional carbon compensation: Mechanism,Pattern and policy suggestions. Areal Research and Development, 34(05), 116–120.
- Zhao, M. J., Shi, R., & Yao, L. Y. (2022). Analysis on the goals and paths of carbon neutral agriculture in China. Issues in Agricultural Economy, 513(09), 24–34.
- Zheng, Z. H., Wu, Z. F., Chen, Y. B., Yang, Z. W., & Marinello, F. (2021). Analyzing the ecological environment and urbanization characteristics of the Yangtze River Delta urban agglomeration based on google earth engine. Acta Ecologica Sinica, 41(02), 717–729.
- Zhou, P., Chen, S. L., Li, J., & Li, C. X. (2022). Temporal and spatial differences in carbon emissions and carbon neutrality caused by land use changes in Fujian Province. Bulletin of Soil and Water Conservation, 42(03), 356–365+372.
- Zhu, H., & Wang, L. G. (2022). Research on carbon peak and neutralization of tourism in Jiangxi Province. Journal of Chinese Ecotourism, 12(04), 617–631.
- Zhu, H., Wang, L. G., He, Y., Song, W., & Ye, Y. T. (2023). Spatial and temporal characteristics of carbon peak of provincial tourism in China under multiple scenarios. Journal of Arid Land Resources and Environment, 37(01), 169–176.