
 ?Mathematical formulae have been encoded as MathML and are displayed in this HTML version using MathJax in order to improve their display. Uncheck the box to turn MathJax off. This feature requires Javascript. Click on a formula to zoom.
ABSTRACT
Accurate carbon (C) stock estimation is crucial for C sequestration research, environmental protection, and policy formulation related to C management. Although research on C stock in forests, oceans, soil, and desert has received increasing attention, relatively few studies have focused on urban C stock. Moreover, the current mainstream methods for C stock assessment, including field surveys and satellite mapping, are characterised by notable limitations, including being labour-intensive and having limited real-time data acquisition capabilities. Therefore, this paper aims to assess urban C stock and proposes a novel two-stage estimation model based on deep learning and unmanned aerial vehicle (UAV) remote sensing. The first stage is that tree areas recognition via YOLOv5 and achieved 0.792 precision, 0.814 recall, and 0.805 mAP scores, respectively. In the second stage, a grid generation strategy and a Convolutional Neural Network (CNN) regression model were developed to estimate C stock based on recognised tree areas (R2 = 0.711, RMSE = 26.08 kg). Three regions with a minimum of 300 trees in each area were selected as validation sets. The experimental results, in terms of R2 and RMSE in kg, were (0.717, 0.711, 0.686) and (27.263, 27.857, 28.945), respectively.
1. Introduction
The international community widely recognises that the primary factor contributing to climate change is the excessive emissions of carbon dioxide (CO2) (Li et al., Citation2015). Excess carbon (C) in the atmosphere has aggravated global warming and instability of the climate system resulting in extreme weather conditions, water shortages, famine, and spread of disease (AghaKouchak et al., Citation2014). According to a statistic by the World Meteorological Organization, the global average temperature has risen by 0.8 °C over the past 100 years which led to the pace of sea-level rise doubled from 0.08 inches per year between 1993 and 2002 to 0.17 inches between 2013 and 2021 (Cazenave et al., Citation2014; World Meteorological Organization, Citation2021). Moreover, the ecosystem of Earth has suffered severe damage as well. A large-scale species of animals are forced to migrate northward due to habitat loss which is the result of warming climate (Seebacher & Post, Citation2015). C stock, which refers to the quantity of C contained in a system, such as forests, grassland, and wetlands, plays a decisive role in comprehensive analysis and understanding of the C cycle and neutrality (Liu et al., Citation2021). C stock studies help us to identify the sources and sinks of C, which is critical for developing effective climate change policies and strategies. A large number of studies have investigated the C stock of forests and soil organic (Domke et al., Citation2012; Ray et al., Citation2011; Rodríguez Martín et al., Citation2016). These studies have proposed various strategies for estimating C stock based on different data sources and discussed potential land use changes, land–climate interactions and ecosystem services (Guo & Gifford, Citation2002; Mackey et al., Citation2013; Yang et al., Citation2014). Besides, in recent years, the study of C stock in oceans has gained significant attention (Atwood et al., Citation2015; Fourqurean et al., Citation2012). The ocean is the largest C sink on Earth, absorbing approximately 25% of the CO2 emitted by human activities (Landschützer et al., Citation2015, Citation2016). Furthermore, reports about C stock studies of deserts showed that all regions of the planet have tremendous C sink potential (Baraket et al., Citation2021; He et al., Citation2019; Xie et al., Citation2017). Unfortunately, despite studies on C stock have achieved considerable advances, only a handful of urban C stock estimation exist in the literature. Although urban C sequestration capacity is limited compared with forests and oceans, as the residences of the world’s majority population, the study of urban C stock is also of great research value for local C neutrality and climate regulation (Glaeser & Kahn, Citation2010; Griffiths & Sovacool, Citation2020). Kozak et al. (Citation2023) proposed a specific biomass estimation method for Pinus sylvestris by combining airborne laser scanning and digital hemispherical photography where a 0.97 R2 value was achieved. Choudhury et al. (Citation2020) applied the object-based image analysis and structure-from-motion (SfM) approach to map C stock for five dominant tree species in Italy. However, these studies only focused on specific tree species, and their workflows require cumbersome manual process. To overcome this limitation, we designed and implemented a novel method to assess the C stock of urban trees which constitute the main urban C pool.
Traditionally, the C stock of trees is determined based on biomass (Pokharel et al., Citation2023; Rosas et al., Citation2023; Vieilledent et al., Citation2012). Methods for estimating biomass have evolved over time, ranging from manual ground surveys to remote sensing-based assessment (Vashum, Citation2012). Ground surveys are considered to be the most accurate method; however, they require a significant amount of manpower and expertise. Hence, currently, most studies on C stock and biomass assessment are conducted using remote sensing, particularly satellites (Csillik et al., Citation2019; David et al., Citation2022; Muro et al., Citation2022; Tan et al., Citation2007). These assessments are typically performed using mathematical mapping algorithms or machine learning models based on imagery collected from multispectral sensors, LiDAR and optical remote sensors equipped with satellites (Goetz et al., Citation2009). However, satellites exhibit constrained spatial resolution and lack the capability to capture intricate, small-scale details, rendering them less proficient in close-range remote sensing endeavours. Furthermore, the passive or optical remote sensing capabilities carried by satellites are restricted by weather conditions (Syifa et al., Citation2020; Talukdar et al., Citation2020; Yang et al., Citation2013). The aforementioned limitations also exist in other remote sensing applications such as land modelling and agriculture (Immitzer et al., Citation2012). In recent years, the advancement of civilian unmanned aerial vehicle (UAV) and deep learning techniques has brought the promise of a new data-driven approach in various fields of study (Al-Najjar et al., Citation2019; Radoglou-Grammatikis et al., Citation2020; Tang & Shao, Citation2015; Tsouros et al., Citation2019; Yu et al., Citation2021). UAVs provide an efficient and flexible platform for various sensors including RGB cameras, multispectral imagers and thermographic cameras, paving the way for effective deep learning model training (Bhatt & Maclean, Citation2023; Sothe et al., Citation2020). However, UAVs and deep learning are seldom used in the field of C stock and biomass assessment. This is mainly due to the fact that precise biomass estimation requires three-dimensional information, such as breast diameter and height of trees, which is difficult to obtain from UAV’s two-dimensional imagery. Accordingly, utilising UAVs is of little advantage compared with satellites. Although recent studies have shown that relatively accurate calculation of biomass can be achieved according to tree canopy areas, precise tree segmentation in UAV imagery is often unfeasible to perform because of the overlap of trees as well (Kankare et al., Citation2013; Karlson et al., Citation2015). These factors directly lead to the adversity of applying UAVs and computer vision techniques in the field of C stock assessment. An effective and efficient method for UAV-based C stock analysis is urgently required.
In an effort to address the aforementioned issues, this paper presents a two-stage method using UAVs and deep learning to conduct C stock estimation of urban trees. The method proposed enables a timely, precise, and fully automatic urban trees’ C stock assessment, which holds significant practical value. The objective of this paper can be summarised as follows:
to study and evaluate the urban trees’ C stock ability;
to design a general fully automatic C stock estimation pipeline based on deep learning and UAV remote sensing;
to design and implement a C stock estimation method that enables timely, precise and efficient C stock assessment.
2. Materials and methods
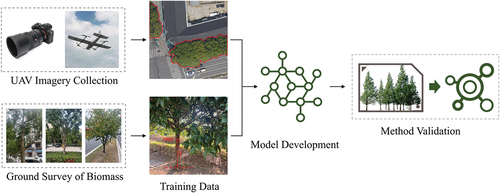
In this work, we assessed C stock of urban trees utilising UAVs and deep learning networks. The main process of the study is presented in , which involves UAV imagery collection, ground survey, model development, and method validation.
Figure 1. Overall workflow of urban trees’ carbon stock estimation based on deep learning and UAVs.
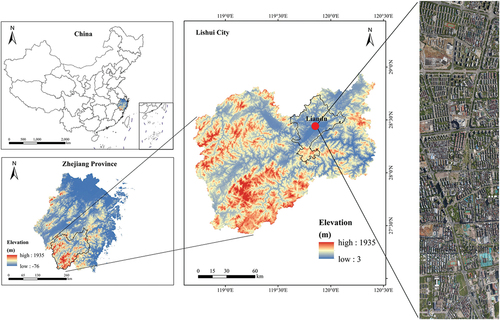
2.1. Study region
The study region is located in Liandu District, Lishui, Zhejiang Province, China (27°25′N–28°57′N, 118°41′E–120°26′E) (). Lishui belongs to the subtropical monsoon climate zone. The average annual precipitation of Lishui is 1598.9 mm, mainly concentrated between March and September. The mean annual temperature is 17.9 ℃ with up to 28.4 ℃ in July and as low as 6.7 ℃ in January. The landscape of Lishui is primarily characterised by hills, mountains, basins, and gorges. The topography generally slopes from southwest to northeast. Lishui boasts a high forest coverage rate of 81.7%, indicating a significant presence of forested areas throughout the region.
Figure 2. The study area of this work.
The vegetation type of Lishui is dominated by subtropical evergreen broad-leaved forests. According to field surveys, broad-leaved trees such as Fagaceae (Castanea mollissima and Castanopsis), Theaceae (Schima superba and Camellia oleifera), Lauraceae (Cinnamomum camphora), Magnoliaceae (Magnolia grandiflora), Oleaceae (Osmanthus fragrans, Ligustrum lucidum, Syringa oblata, and Fraxinus), Elaeocarpaceae (Elaeocarpus decipiens and Elaeocarpus sylvestris), and Rosaceae (Eriobotrya japonica, Prunus persica, and Prunus mume) comprise more than 78% of trees in urban Lishui.
2.2. The allometric equation used to estimate biomass
In this study, the C stock was calculated based on biomass. During the field measurement phase of biomass, due to the rich tree species diversity of Southern China, it is laborious and demanding to develop detailed species-specific biomass measurement methods. Therefore, we employed the general allometric equation of evergreen broad-leaved forests (the predominant tree type in Lishui) proposed by Xiang et al. (Citation2016) as a substitute to estimate the region-scale biomass and evaluate the results in this study (Montagu et al., Citation2005; Paul et al., Citation2013; Wang, Citation2006; West et al., Citation1999). The additive allometric equation for estimating the biomass of different tree components is as follows:
where is the component in {Stem, Branch, Leaf and Root},
is the biomass value for component
measured in kg,
are regression coefficients,
are the error terms,
or
is the diameters at breast height. The detailed coefficients are listed in .
Table 1. Regression coefficients for general allometric equation [] utilised to estimate evergreen broad-leaved forests biomass.
2.3. Data collection and pre-processing
The research data studied were orthophotos collected using a self-assembled UAV. The UAV was built based on the Foxtech VTOL, which has high stability, a long battery life, and a stable flight altitude. The detailed flight parameters are listed in . The aerial camera used for capturing the images was SONY ILCE-A7R2 mirrorless digital camera. The flight speed and height of UAV were maintained at approximately 21–22 m/s and 400 m, respectively. The camera shot with a vertical overlap of 80% and a horizontal overlap of 60%, respectively. The imaging tasks were performed under sunny weather conditions around 12:00 p.m. (local time). All images obtained have a ground resolution better than 4 cm. DJI Terra software is used to automatically generate orthophotos. The generating process includes image orthorectification, image stitching, and post-processing.
Table 2. Main parameters of data collection.
A series of pre-processing works were performed to format the collected images. First, all UAV images were divided into sub-images measuring 960 by 960 pixels to facilitate model training. Subsequently, all trees presented in the sub-images were manually annotated using LabelImg (Tzutalin, Citation2015). A total of 1040 images were generated. The number of labels was 6988. Finally, all images were randomly divided into training (80%), testing (10%), and validation (10%) datasets.
2.4. First stage
2.4.1. Trees identification based on UAV images
2.4.1.1. Tree areas identification
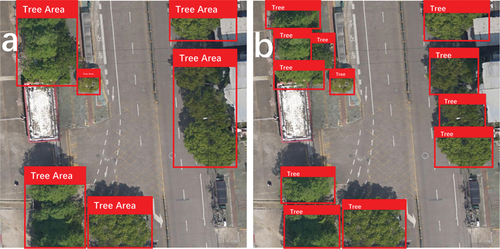
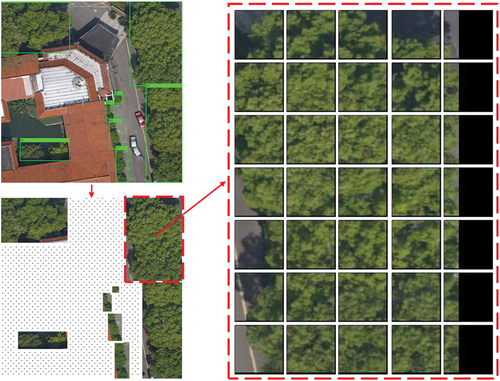
The C stock assessment method was designed with a two-stage structure. In the first stage, all UAV images were inputted into the deep learning model to identify trees. Specifically, the objective of the identification at this stage was to recognise tree areas rather than individual plants in the images. Tree area refers to a group of adjacent trees that collectively form a forested region in UAV imagery (). Although estimating C stock based on individual plants is theoretically the most accurate method, it is often impractical to precisely segment each individual tree, especially in densely wooded areas, as discussed in Section 1. Therefore, we proposed a unit-image-based C stock estimation scheme which segments the tree areas into unit-images for measurement.
Figure 3. Comparison between tree areas and individual trees recognition: (a) tree areas recognition is to identify trees as a whole group; (b) individual trees recognition is to segment each tree.
2.4.1.2. Deep learning model
A deep learning model, namely, YOLOv5 was applied in the first stage. YOLO which stands for You Only Look Once is a lightweight object detection algorithm that has been widely utilised in the field of computer vision. The algorithm uses a deep Convolutional Neural Network (CNN) to extract features from the images. CNN is a type of deep learning network designed for computer vision tasks, which is the foundation of various computer vision networks (Lecun et al., Citation1998; Li et al., Citation2022; O’Shea & Nash, Citation2015).
A typical CNN architecture consists of input layer, convolutional layer, activation layer, pooling layer, fully connected layer and output layer. The input layer takes in raw input data, which is typically an image. The convolutional layer, as a key component, applies a set of learnable kernels to the input image to extract features such as edges and corners. The activation layer typically receives the output of the convolutional layer and applies a non-linear activation function to introduce non-linearity and improve the model’s ability to learn complex patterns. Common activation functions include sigmoid, tanh, and ReLU. The equations for sigmoid, tanh, and ReLU are as follows:
Pooling layer downsamples the feature maps to reduce their spatial resolution. The most common pooling methods are max pooling and average pooling. The fully connected layer presents layer-to-layer connections by connecting every neuron in the previous layer to neuron in the current layer, allowing the network to learn complex combinations of features. Finally, the output layer provides the final output of network.
The basic structure of YOLO consists of backbone, neck, and head components responsible for feature extraction, feature aggregation, and prediction, respectively. Compared with other object detection models, YOLO, renowned as one-step network, skips region proposal stage and can directly extract features of the images to perform object detection. This property greatly improves the recognition speed of the model. After first proposed by Redmon et al. (Citation2016), YOLO family already has multiple versions of YOLO, YOLO9000, YOLOv3, YOLOv4, and YOLOv5 (Bochkovskiy et al., Citation2020; Jocher, Citation2020; Redmon & Farhadi, Citation2017, Citation2018).
YOLOv5 has five pre-trained variations including YOLOv5n, YOLOv5s, YOLOv5m, YOLOv5l, and YOLOv5×. The main difference among all five models is the trade-off between speed and size (). Here, the pre-trained model YOLOv5× was selected. Additionally, the epochs and batch size during training process were set to 300 and 8, respectively.
Table 3. Parameters of YOLOv5 variations.
2.4.2. Predicted bounding boxes adjustment
After receiving the recognised results from YOLOv5, a post-adjustment was performed to eliminate duplicates in all predicted bounding boxes. The post-adjustment process consists of two steps. First, check for any bounding boxes that contain one another, and remove the contained box. Second, if box A intersects with box B, determine the intersection over union (IoU) score. IoU measures the overlap between two boxes. The formula for calculating IoU is:
If the IoU score between the predicted bounding boxes is greater than 0.2, merge two boxes and append the new box to the output. The post-adjustment algorithm continues running until there are no further removal or merge operations happen. The pseudo-code of post-adjustment is presented in . After the post-adjustment, the number of predicted bounding boxes is 5777.
Figure 4. Pseudo-code of the post-adjustment to deduplicate predicted bounding boxes.
2.5. Second stage
2.5.1. Grid generation and biomass labelling
The tree areas identified and post-processed in the first stage cannot be directly estimated with biomass but cropped into smaller units. Each tree area was divided into multiple unit-images with a uniform size (64 × 64 pixels) (). To avoid divisibility, the padding method, which adds layers of zeros on the bottom and right sides to modify the number of pixels to multiples of 64, was used to extend the area. Subsequently, each unit-image was labelled with unique identifier (uid) to backtrack associated tree areas. A total of 51,682 unit-images were obtained. We randomly selected 3600 unit-images as training data. Furthermore, all 3600 unit-images were randomly split into training (80%), testing (10%) and validation (10%) sets.
Figure 5. Grid generation process. Each recognized tree area in the first stage was extracted and split into unit-images (64 * 64) for the second-stage model training. The following biomass labeling and estimation process in the second stage were based on unit-images.
All selected unit-images were manually labelled with biomass value. Specifically, the biomass we estimated is the total biomass includes stem, branch, leaf, and root components. To reduce the heavy workload of field measurements, experiments were conducted to analyse the relationship between biomass value and pixel numbers of trees. We selected five most dominant tree families including Lauraceae, Magnoliaceae, Oleaceae, Elaeocarpaceae, and Rosaceae as research objects. A total of 40 trees, with 8 trees from each family, were ground measured in terms of biomass. Furthermore, we recorded the number of pixels each tree occupies in the UAV images to establish a linear regression curve. The statistics are presented in . It can be learned from the figure that the average biomass per pixel for Lauraceae, Magnoliaceae, Oleaceae, Elaeocarpaceae, and Rosaceae in kg were 0.0205, 0.0860, 0.0276, 0.0499, and 0.0323, respectively. Accordingly, for trees belonging to these five families, the biomass value was calculated and labelled as follows:
Where is the biomass value corresponding to the trees covered by unit-image
,
is the number of trees contained in unit-image
derived from field survey and manual recognition,
represents the area (in pixels) of tree
contained in the unit-image
, and
is the average biomass per pixel of the family of tree
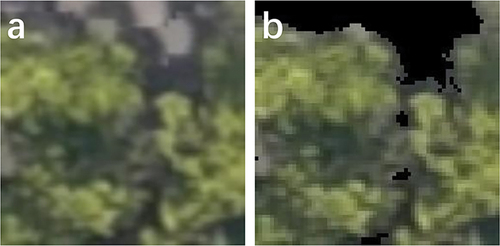
listed in . The method adopted to measure the number of pixels was colour filtering cooperated with manual correction. All unit-images were first converted from RGB colour space to HSV (hue, saturation and value), and then a colour mask was applied to detect specific greens and yellows (). Compared to RGB colour space, HSV separates the colour information (hue and saturation) from the brightness, making it suitable for manipulating specific colours. The upper bound of the HSV colour range was set at (103, 201, 255) and the lower bound at (24, 17, 42). The colour boundaries were learned from statistics of HSV value distribution of all pixels. For those mistakenly filtered objects such as grasslands and green buildings, manual correction was performed to adjust. Besides, for trees of other families, the biomass was labelled according to field measurements.
Figure 6. Biomass value and the number of pixels occupied in UAV images of 40 Lauraceae, Magnoliaceae, Oleaceae, Elaeocarpaceae, and Rosaceae trees (8 for each): (a) biomass and number of pixels of 40 trees; (b) biomass per pixel for 5 tree families.
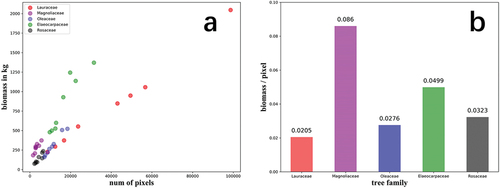
Figure 7. Color filtering. All pixels of unit-images were filtered with color mask to extract trees out of backgrounds: (a) the original unit-image; (b) the unit-image filtered with color mask.
2.5.2. Unit-image-based biomass estimation
The objective of the second stage is biomass estimation based on unit-images. The biomass of each identified tree area was calculated as the sum of all unit-images belonging to this area.
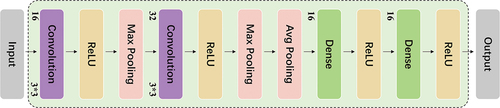
A CNN was developed for unit-image-based biomass regression. The detailed structure of the model is shown in . There were two convolutional layers, two max pooling layers, one global average pooling layer and two dense layers within the network. The optimiser utilised was Adam optimisation algorithm, and loss function selected was mean square error (MSE). The epochs and batch size were set as 300 and 32, respectively. The output of the network is the biomass of each unit-image.
Figure 8. Network structure of the second-stage convolutional Neural network regression model.
2.6. Carbon stock conversion based on biomass
The biomass value estimated by CNN needs to be converted to C equivalents. The most popular and direct strategy refers to genetic assumption that C occupies generally 50% in plants (Martin & Thomas, Citation2011). Accordingly, a conversion factor of 0.5 was applied to convert biomass to C mass. The final output of the method was the total C stock derived from biomass value in the second stage.
2.7. Method uncertainty and error propagation
Our proposed method for estimating C stocks unavoidably involves some level of uncertainty during practical applications. This uncertainty ultimately manifests as a bias between the measured C stocks and the estimated C stocks. Four primary aspects contribute to this bias:
The bias between the measured DBH and the true DBH. DBH refers to the diameter of a tree’s trunk measured at a standard height, which is an important parameter for estimating tree growth, productivity, and biomass. Typically, DBH has been historically measured at approximately 1.3 metres (4.3 feet) height above the ground. However, during on-site measurement, the species, size, and age of trees can influence the selection of measuring height. Additionally, we measured DBH using a traditional measuring tape, which inevitably led to errors.
Systematic error present in the allometric equation. Allometric equations are mathematical models that describe the relationship between two or more variables, often based on empirical data from biological or environmental studies. However, allometric equations can be subject to bias if they are derived from inadequate or biased data. The degree of bias in an allometric equation can affect the accuracy and precision of its predictions. According to Mugabowindekwe et al. (Citation2023), this error can sometimes even reach 20%. shows the error information of the allometric equation we used for different tree components. Additionally, using a general allometric equation of evergreen broad-leaved forests to calculate the biomass of all trees in the study area and the labelling process, specifically the colour filtering process, also contributed to the error.
The bias generated by tree areas identification. The model’s recognition results may differ from the ground-truth tree areas. Typically, the recognised tree areas may miss a small portion of the trees.
The bias generated by converting biomass into C storage. A precise universal method for converting biomass to carbon storage does not exist. Instead, the most commonly used method is based on the genetic assumption that carbon occupies generally 50% of plants. However, this is only an estimated measurement.
These uncertainties will propagate and amplify along the process of the method. To preliminarily quantify these uncertainties, we selected three regions as validation areas to measure the degree of error of the method.
3. Results
3.1. Performance of the first stage
The performance of the first stage was evaluated in terms of precision, recall, and mean average precision (mAP) values. Precision and recall are calculated according to True Positives (TP), True Negatives (TN), False Positives (FP), and False Negatives (FN).
Precision is the fraction of retrieved documents that are relevant to the query. In pattern recognition fields, precision is defined as the ratio of the correctly classified positive samples to all the predicted positive cases. The formula:
Recall, also known as sensitivity, indicates the ratio of the correctly classified positive samples to all the positive samples. While in pattern recognition field, recall is often set to be an indication of how many objects were found by the given prediction boxes. The formula:
The mAP value is commonly used to analyse the performance of computer vision models, especially object detection and segmentation system. The mAP is calculated by taking the mean of average precision (AP) over all classes based on overall IoU thresholds.
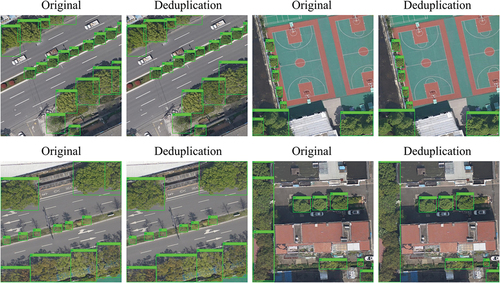
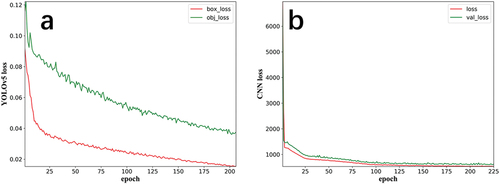
The model demonstrates relatively satisfactory recognition ability with precision, recall, and mAP reached 0.792, 0.814, and 0.805, respectively, at the best epoch. The changes in the loss values across epochs during training process are shown in (YOLOv5 early stopping triggered at the 205th epoch). shows the confusion matrix of YOLOv5. displays part of the identification results on the training set. It can be seen that there are instances of duplicate recognition leading to an over-calculation of biomass. Consequently, post-adjustment by applying deduplication algorithm was an indispensable step. displays part of deduplication results.
Figure 9. Confusion matrix of YOLOv5 on training dataset where blt represents broad-leaved forests.
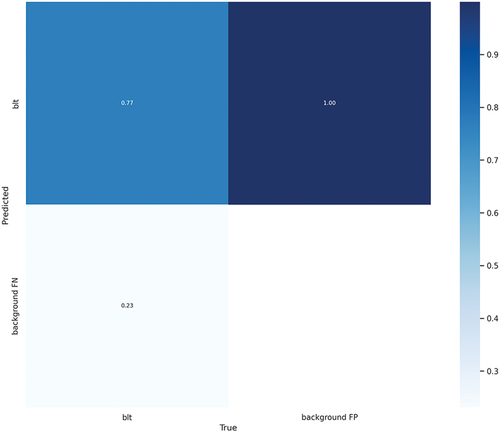
Figure 10. Recognition instances of the YOLOv5 before deduplication.
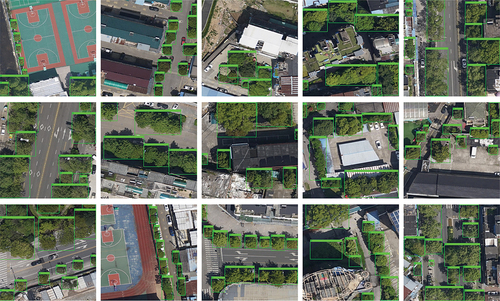
Figure 11. Comparison between original and deduplicated outputs.
3.2. Performance of the second stage
R2 and root mean square error (RMSE) were used to measure the regression ability of the second-stage CNN. The final R2 and RMSE in kg of the network for test set reached 0.711 and 26.08, respectively. The loss growth of the network during the training process is shown in . The network was initialised with an early stopping rule which stopped the training process if no improvement was observed within 20 epochs. The final training epoch of the model was 225 since the loss value did not decrease further in the later stages of training.
Figure 12. (a) first-stage YOLOv5 loss growth; (b) second-stage CNN regression model loss growth.
3.3. Performance of the method on validation regions
To better understand the generalisation ability of the method, three regions in downtown Lishui were selected as validation sets. Each region is roughly a 100 m × 100 m rectangle area, containing at least 300 trees. A comparison was made between the field-measured and estimated C stock for three regions (). The field-measured data are the estimated C stock value in the field using the allometric equation. The field-measured C stock in kg for three regions were (102889.70, 108025.89, 159772.56), while the predicted C stock in kg of the method for three regions were (87909.41, 91318.62, 134756.16), with (0.717, 0.711, 0.686) R2 and (27.263, 27.857, 28.945) RMSE in kg, respectively. shows the actual and predicted C stock for each tree area in three regions. The results indicate that the method is adequate for urban C stock estimation tasks.
Figure 13. Actual and predicted C stock for each tree area in three regions.
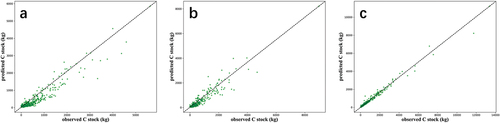
Table 4. Comparison of actual and estimated carbon stock on validation regions.
4. Discussion
4.1. Limitation of the method
To develop an effective and efficient urban C stock estimation method, a two-stage deep learning structure was designed. Despite the method demonstrating relatively strong urban C stock estimation ability, there are still some limitations worth discussing.
In the first stage, analysis of mis-identified samples revealed that the model was not sensitive to trees in shadow. This was due to the substantial differences in colour and shape between shadowed and sunlit trees in the UAV images, which caused confusion for YOLOv5 in feature extraction. This also illustrated why the estimated C stock for the three validation regions was all lower than the actual measured values. A potential solution to this issue is to treat shaded trees as a separate category.
The second-stage CNN model shows a relatively strong regression ability with an R2 of 0.711 and an RMSE of 26.08 kg. Our achieved R2 still has room to improve. More studies can be carried out in tree species learning, data processing and labelling, and model development.
The UAV-based C stock estimation has certain limitations. Compared to satellites, UAVs have limited coverage and flight time, and their operation requires specialised skills and licences. Therefore, the proposed strategy is more suitable for local, precise, and timely urban C stock estimation.
4.2. Promising application
C stock studies provide information on the amount of C stored in various ecosystems and land use practices which is a crucial component of understanding the Earth’s C cycle and the impact of human activities on ecosystem. Accurate and up-to-date C stock assessments are critical for effective policy making in regard to C management and climate mitigation. Multiple academic communities and scholars have come up with their ideas and solutions. However, there always exists a trade-off between accuracy and efficiency in many solutions. Most strategies require more or less manual labour jobs. Large-scale C stock assessment is still a challenge, but this study presents an important step forward by proposing a fully automatic and intelligent C stock estimation pipeline based on UAV remote sensing and deep learning. For regions with relatively uniform vegetation types, the experimental results confirm that the two-stage method enables robust, precise, and timely C stock estimation.
4.3. Cost-benefit analysis of the method
UAVs equipped with remote sensing devices can provide precise and high-resolution data for C estimation. Nevertheless, deploying a UAV-based C estimation system requires an upfront investment in acquiring the UAV platform, remote sensing equipment, and software. The cost can vary depending on the complexity and quality of the equipment chosen. Hence, for precise local C stock estimation, our proposed method is suitable. For national-level C stock estimation tasks, satellite remote sensing still seems to be the preferred option. Therefore, when conducting C stock estimation, the choice of research method should consider the target range and accuracy requirements.
4.4. Insight into the urban C stock estimation
4.4.1. Estimating biomass from crown dimensions
Estimating the biomass or C stock from remotely sensed data is an appealing prospect. However, it also presents a challenge from the point of view of estimation model, as biomass allometries typically have DBH or H (tree height) as a squared term in the equation, meaning that even small errors in diameter predictions can strongly influence the accuracy of biomass estimates (Chave et al., Citation2014; Chojnacky et al., Citation2014; Jucker et al., Citation2017). Sometimes, obtaining these measurements can be difficult, particularly when working with remote sensing equipment like satellites. A better approach may therefore be to estimate a tree’s biomass directly from crown architectural properties which can be measured from airborne imagery, without the need to first predict DBH or H (Tucker et al., Citation2023). Our method is to estimate biomass directly from crown architectural properties. This approach skips the step of calculating DBH or H, thereby reducing the uncertainty of the algorithm.
4.4.2. Urban carbon stock estimation
Urban C stock estimation helps quantify the C sequestration potential of urban areas, guiding efforts to mitigate climate change. It informs urban planning and management decisions, promoting the preservation of green spaces and the integration of nature-based solutions for sustainable development. Additionally, urban C estimation enables monitoring progress, reporting greenhouse gas inventories and tracking the effectiveness of climate action plans at the city level. In the academic literature, considerable attention has been given to large-scale C stock estimation. However, due to rapid urbanisation, there is a need to focus more on research regarding urban C stock.
4.5. Open issues and future work
The method proposed in this study achieved certain advances in urban C stock estimation tasks, whereas there are still some issues remain to be addressed.
First, the biomass of all tree species were field-measured using the same general allometric equation, which may reduce the accuracy of C stock estimated in the second stage. In addition, the model may not be suitable for complex scenarios such as rainforests and mountain forests because of the rich diversity of tree species. Accordingly, classification models that are capable of well-distinguishing trees into specific families in large scale and family-specific biomass estimation models require further studies. The key problem is how to maintain the recognition accuracy of the model in the first stage. Multi-model fusion strategies, model structure optimisation, and data augmentation are three possible attempting directions. Moreover, the model developed in the second stage was a lightweight two convolutional layer network. It is worth testing whether a more complex deep learning network can achieve advances or not.
Secondly, in this work, we mainly concentrated on urban trees while excluded other vegetation types such as shrubs and grassland. Training a more general model or a shrub-grassland specific model are two options of future studies.
Furthermore, a considerable amount of work has been done in data collection, processing, and labelling phases. Efficient data generation methods based on remote sensing devices such as satellites and UAVs are a worth-noting research field.
5. Conclusions
In this study, we proposed a two-stage deep learning method for estimating urban trees’ C stock based on UAV remote sensing in Lishui, Zhejiang Province, China. In comparison with satellite, UAVs are able to take higher-resolution aerial imagery and allow flexible flight which pave the way for timely and efficient image data collection. Meanwhile, the experimental results indicate that neural networks as powerful computing systems are reliable technical tools for remote sensing-based urban C stock estimation. Near-real time and effective assessment of C stock is of great significance for C cycle and sequestration research, climate change adaptation and mitigation, and regional sustainable development. In addition, the study of urban C stock is crucial to urban greening and policy design. This study highlights the importance of urban C stock research and takes full advantage of UAVs and deep learning. The proposed method achieved fully automatic, efficient, and precise urban C stock assessment which has a significant application value.
Acknowledgments
The authors appreciate reviewers and editors for their precious insights and suggestions.
Disclosure statement
No potential conflict of interest was reported by the author(s).
Data availability statement
The raw data supporting the conclusions of this article will be made available by the first author, without undue reservation.
Additional information
Funding
References
- AghaKouchak, A., Cheng, L., Mazdiyasni, O., & Farahmand, A. (2014). Global warming and changes in risk of concurrent climate extremes: Insights from the 2014 California drought: Global warming and concurrent extremes. Geophysical Research Letters, 41(24), 8847–8852. https://doi.org/10.1002/2014GL062308
- Al-Najjar, H. A. H., Kalantar, B., Pradhan, B., Saeidi, V., Abdul Halin, A., Ueda, N., & Mansor, S. (2019). Land cover classification from fused DSM and UAV images using convolutional neural networks. Remote Sensing, 11(12), 1461. https://doi.org/10.3390/rs11121461
- Atwood, T. B., Connolly, R. M., Ritchie, E. G., Lovelock, C. E., Heithaus, M. R., Hays, G. C., Fourqurean, J. W., & Macreadie, P. I. (2015). Predators help protect carbon stocks in blue carbon Ecosystems. Nature Climate Change, 5(12), 1038–1045. https://doi.org/10.1038/nclimate2763
- Baraket, F., González-Rosado, M., Brahim, N., Roca, N., Ben Mbarek, H., Świtoniak, M., Chaker, R., Sánchez-Bellón, Á., Rigane, H., Gargouri, K., & Parras-Alcántara, L. (2021). Short and long-term effect of land use and Management on soil organic carbon stock in semi-desert areas of North Africa-Tunisia. Agriculture, 11(12), 1267. https://doi.org/10.3390/agriculture11121267
- Bhatt, P., & Maclean, A. L. (2023). Comparison of high-resolution NAIP and unmanned aerial vehicle (UAV) imagery for natural vegetation communities classification using machine learning approaches. GIScience & Remote Sensing, 60(1), 2177448. https://doi.org/10.1080/15481603.2023.2177448
- Bochkovskiy, A., Wang, C.-Y., & Mark Liao, H.-Y. 2020. “YOLOv4: Optimal speed and accuracy of object detection.” ArXiv abs/2004.10934.
- Cazenave, A., Dieng, H.-B., Meyssignac, B., von Schuckmann, K., Decharme, B., & Berthier, E. (2014). The rate of sea-level rise. Nature Climate Change, 4(5), 358–361. https://doi.org/10.1038/nclimate2159
- Chave, J., Réjou-Méchain, M., Búrquez, A., Chidumayo, E., Colgan, M. S., Delitti, W. B. C., Duque, A., Eid, T., Fearnside, P. M., Goodman, R. C., Henry, M., Martínez-Yrízar, A., Mugasha, W. A., Muller-Landau, H. C., Mencuccini, M., Nelson, B. W., Ngomanda, A., Nogueira, E. M. … Saldarriaga, J. G. (2014). Improved allometric models to estimate the aboveground biomass of tropical trees. Global Change Biology, 20(10), 3177–3190. https://doi.org/10.1111/gcb.12629
- Chojnacky, D. C., Heath, L. S., & Jenkins, J. C. (2014). Updated generalized biomass equations for North American tree species. Forestry, 87(1), 129–151. https://doi.org/10.1093/forestry/cpt053
- Choudhury, M. A. M., Marcheggiani, E., Despini, F., Costanzini, S., Rossi, P., Galli, A., & Teggi, S. (2020). Urban tree species identification and carbon stock mapping for urban green planning and management. Forests, 11(11), 1226. https://doi.org/10.3390/f11111226
- Csillik, O., Kumar, P., Mascaro, J., O’Shea, T., & Asner, G. P. Monitoring tropical forest carbon stocks and emissions using planet satellite data. (2019). Scientific Reports, 9(1), 1–12. Springer. https://doi.org/10.1038/s41598-019-54386-6
- David, R. M., Rosser, N. J., & Donoghue, D. N. M. (2022). Improving above ground biomass estimates of Southern Africa dryland forests by combining Sentinel-1 SAR and Sentinel-2 multispectral imagery. Remote Sensing of Environment, 282(December), 113232. https://doi.org/10.1016/j.rse.2022.113232
- Domke, G. M., Woodall, C. W., Smith, J. E., Westfall, J. A., & McRoberts, R. E. (2012). Consequences of alternative tree-level biomass estimation procedures on U.S. Forest carbon stock estimates. Forest Ecology and Management, 270(April), 108–116. https://doi.org/10.1016/j.foreco.2012.01.022
- Fourqurean, J. W., Duarte, C. M., Kennedy, H., Marbà, N., Holmer, M., Angel Mateo, M., Apostolaki, E. T., Kendrick, G. A., Krause-Jensen, D., McGlathery, K. J., & Serrano, O. (2012). Seagrass ecosystems as a globally significant carbon stock. Nature Geoscience, 5(7), 505–509. https://doi.org/10.1038/ngeo1477
- Glaeser, E. L., & Kahn, M. E. (2010). The greenness of cities: Carbon dioxide emissions and urban development. Journal of Urban Economics, 67(3), 404–418. https://doi.org/10.1016/j.jue.2009.11.006
- Goetz, S. J., Baccini, A., Laporte, N. T., Johns, T., Walker, W., Kellndorfer, J., Houghton, R. A., & Sun, M. (2009). Mapping and monitoring carbon stocks with satellite observations: A Comparison of methods. Carbon Balance and Management, 4(1), 2. https://doi.org/10.1186/1750-0680-4-2
- Griffiths, S., & Sovacool, B. K. (2020). Rethinking the future low-carbon city: Carbon neutrality, green design, and sustainability tensions in the making of Masdar city. Energy Research & Social Science, 62(April), 101368. https://doi.org/10.1016/j.erss.2019.101368
- Guo, L. B., & Gifford, R. M. (2002). Soil carbon stocks and land use change: A meta analysis: Soil carbon stocks and land use change. Global Change Biology, 8(4), 345–360. https://doi.org/10.1046/j.1354-1013.2002.00486.x
- He, H., Xia, G., Yang, W., Zhu, Y., Wang, G., & Shen, W. (2019). Response of soil C: N: P Stoichiometry, organic carbon stock, and release to wetland grasslandification in Mu Us Desert. Journal of Soils and Sediments, 19(12), 3954–3968. https://doi.org/10.1007/s11368-019-02351-1
- Immitzer, M., Atzberger, C., & Koukal, T. (2012). Tree species classification with random forest using very high spatial resolution 8-Band WorldView-2 satellite data. Remote Sensing, 4(9), 2661–2693. https://doi.org/10.3390/rs4092661
- Jocher, G. 2020. “YOLOv5 by Ultralytics.” https://doi.org/10.5281/zenodo.3908559.
- Jucker, T., Caspersen, J., Chave, J., Antin, C., Barbier, N., Bongers, F., Dalponte, M., van Ewijk, K. Y., Forrester, D. I., Haeni, M., Higgins, S. I., Holdaway, R. J., Iida, Y., Lorimer, C., Marshall, P. L., Momo, S., Moncrieff, G. R., Ploton, P. … Zimmermann, N. E. (2017). Allometric equations for Integrating remote sensing imagery into Forest monitoring programmes. Global Change Biology, 23(1), 177–190. https://doi.org/10.1111/gcb.13388
- Kankare, V., Holopainen, M., Vastaranta, M., Puttonen, E., Yu, X., Hyyppä, J., Vaaja, M., Hyyppä, H., & Alho, P. (2013). Individual tree biomass estimation using terrestrial laser scanning. ISPRS Journal of Photogrammetry and Remote Sensing, 75(January), 64–75. https://doi.org/10.1016/j.isprsjprs.2012.10.003
- Karlson, M., Ostwald, M., Reese, H., Sanou, J., Tankoano, B., & Mattsson, E. (2015). Mapping tree canopy cover and aboveground biomass in Sudano-Sahelian Woodlands using Landsat 8 and random forest. Remote Sensing, 7(8), 10017–10041. https://doi.org/10.3390/rs70810017
- Kozak, I., Popov, M., Semko, I., Mylenka, M., & Kozak-Balaniuk, I. (2023). Improving methods to Predict Aboveground biomass of Pinus sylvestris in urban Forest using UFB model, LiDAR and digital Hemispherical Photography. Urban Forestry & Urban Greening, 79(January), 127793. https://doi.org/10.1016/j.ufug.2022.127793
- Landschützer, P., Gruber, N., & Bakker, D. C. E. (2016). Decadal variations and Trends of the Global Ocean carbon sink: DECADAL AIR-SEA CO 2 FLUX VARIABILITY. Global Biogeochemical Cycles, 30(10), 1396–1417. https://doi.org/10.1002/2015GB005359
- Landschützer, P., Nicolas Gruber, F. A. H., Rödenbeck, C., Bakker, D. C. E., van Heuven, S., Hoppema, M., Hoppema, M., Metzl, N., Sweeney, C., Takahashi, T., Tilbrook, B., & Wanninkhof, R. (2015). The reinvigoration of the Southern Ocean carbon sink. Science, 349(6253), 1221–1224. https://doi.org/10.1126/science.aab2620
- Lecun, Y., Leon Bottou, Y. B., & Haffner, P. (1998). Gradient-based learning applied to document recognition. Proceedings of the IEEE, 86(December), 2278–2324. https://doi.org/10.1109/5.726791
- Li, Z., Liu, F., Yang, W., Peng, S., & Zhou, J. (2022). A survey of convolutional Neural networks: Analysis, applications, and prospects. IEEE Transactions on Neural Networks and Learning Systems, 33(12), 6999–7019. https://doi.org/10.1109/TNNLS.2021.3084827
- Liu, Z., Deng, Z., Gang, H., Wang, H., Zhang, X., Lin, J., Qi, Y., & Liang, X. (2021). Challenges and opportunities for carbon neutrality in China. Nature Reviews Earth and Environment, 3(2), 141–155. https://doi.org/10.1038/s43017-021-00244-x
- Li, C., Zhang, C., Luo, G., Chen, X., Maisupova, B., Madaminov, A. A., Han, Q., & Djenbaev, B. M. (2015). Carbon stock and its responses to climate change in C Entral a Sia. Global Change Biology, 21(5), 1951–1967. https://doi.org/10.1111/gcb.12846
- Mackey, B., Colin Prentice, I., Steffen, W., House, J. I., Lindenmayer, D., Keith, H., & Berry, S. (2013). Untangling the confusion around land carbon Science and climate change mitigation policy. Nature Climate Change, 3(6), 552–557. https://doi.org/10.1038/nclimate1804
- Martin, A. R., & Thomas, S. C. (2011). A reassessment of carbon content in tropical trees. PloS One, 6(8), e23533. Edited by Jerome Chave. https://doi.org/10.1371/journal.pone.0023533
- Montagu, K. D., Düttmer, K., Barton, C. V. M., & Cowie, A. L. (2005). Developing general allometric relationships for regional estimates of carbon sequestration—an example using Eucalyptus Pilularis from seven contrasting sites. Forest Ecology and Management, 204(1), 115–129. https://doi.org/10.1016/j.foreco.2004.09.003
- Mugabowindekwe, M., Brandt, M., Chave, J., Reiner, F., Skole, D. L., Kariryaa, A., Igel, C., Hiernaux, P., Ciais, P., Mertz, O., Tong, X., Li, S., Rwanyiziri, G., Dushimiyimana, T., Ndoli, A., Uwizeyimana, V., Lillesø, J. P. B., Gieseke, F. … Saatchi, S. (2023). Nation-wide mapping of tree-level aboveground carbon stocks in Rwanda. Nature Climate Change, 13(1), 91–97. https://doi.org/10.1038/s41558-022-01544-w
- Muro, J., Linstädter, A., Magdon, P., Wöllauer, S., Männer, F. A., Schwarz, L.-M., Ghazaryan, G., Schultz, J., Malenovský, Z., & Dubovyk, O. (2022). Predicting plant biomass and species richness in temperate grasslands across regions, time, and land Management with remote sensing and deep learning. Remote Sensing of Environment, 282(December), 113262. https://doi.org/10.1016/j.rse.2022.113262
- O’Shea, K., & Nash, R. (2015, November). An introduction to convolutional neural networks. arXiv E-Prints. http://arxiv.org/abs/1511.08458
- Paul, K. I., Roxburgh, S. H., England, J. R., Ritson, P., Hobbs, T., Kim Brooksbank, R. J. R., John Raison, R., Larmour, J. S., Murphy, S., Norris, J., Neumann, C., Lewis, T., Jonson, J., Carter, J. L., McArthur, G., Barton, C., & Rose, B. (2013). Development and testing of allometric equations for estimating above-ground biomass of mixed-species environmental plantings. Forest Ecology and Management, 310(December), 483–494. https://doi.org/10.1016/j.foreco.2013.08.054
- Pokharel, R., Latta, G., & Ohrel, S. B. (2023). Estimating climate-sensitive wildfire risk and tree mortality models for use in broad-scale U.S. forest carbon projections. Forests, 14(2), 302. https://doi.org/10.3390/f14020302
- Radoglou-Grammatikis, P., Sarigiannidis, P., Lagkas, T., & Moscholios, I. (2020). A compilation of UAV applications for precision agriculture. Computer Networks, 172(May), 107148. https://doi.org/10.1016/j.comnet.2020.107148
- Ray, R., Ganguly, D., Chowdhury, C., Dey, M., Das, S., Dutta, M. K., Mandal, S. K., Majumder, N., De, T. K., Mukhopadhyay, S. K., & Jana, T. K. (2011). Carbon sequestration and annual increase of carbon stock in a Mangrove Forest. Atmospheric Environment, 45(28), 5016–5024. https://doi.org/10.1016/j.atmosenv.2011.04.074
- Redmon, J., Divvala, S., Girshick, R., & Farhadi, A. 2016. “You only look once: Unified, real-time object detection.” In 2016 IEEE Conference on Computer Vision and Pattern Recognition (CVPR), 779–788. Las Vegas, NV, USA: IEEE. https://doi.org/10.1109/CVPR.2016.91.
- Redmon, J., & Farhadi, A. 2017. “YOLO9000: Better, faster, stronger.” In 2017 IEEE Conference on Computer Vision and Pattern Recognition (CVPR), 6517–6525. Honolulu, HI: IEEE. https://doi.org/10.1109/CVPR.2017.690.
- Redmon, J., & Farhadi, A. (2018, April). YOLOv3: An incremental improvement.
- Rodríguez Martín, J. A., Álvaro-Fuentes, J., Gonzalo, J., Gil, C., Ramos-Miras, J. J., Grau Corbí, J. M., & Boluda, R. (2016). Assessment of the soil organic carbon stock in Spain. Geoderma, 264(February), 117–125. https://doi.org/10.1016/j.geoderma.2015.10.010
- Rosas, M., López Serrano, P., Vega-Nieva, D., Hernandez-Díaz, J., Wehenkel, C., & Javier Corral-Rivas, J. (2023). Estimating above-ground biomass from land surface temperature and evapotranspiration data at the temperate forests of Durango, Mexico. Forests, 14(February), 299. https://doi.org/10.3390/f14020299
- Seebacher, F., & Post, E. (2015). Climate change impacts on animal migration. Climate Change Responses, 2(1), 5. https://doi.org/10.1186/s40665-015-0013-9
- Sothe, C., De Almeida, C. M., Schimalski, M. B., La Rosa, L. E. C., Castro, J. D. B., Feitosa, R. Q., Dalponte, M., Lima, C. L., Liesenberg, V., Miyoshi, G. T., & Tommaselli, A. M. G. (2020). Comparative performance of convolutional Neural network, weighted and conventional support vector machine and random forest for classifying tree species using hyperspectral and photogrammetric data. GIScience & Remote Sensing, 57(3), 369–394. https://doi.org/10.1080/15481603.2020.1712102
- Syifa, M., Park, S.-J., & Lee, C.-W. (2020). Detection of the Pine Wilt Disease tree candidates for drone remote sensing using artificial intelligence techniques. Engineering, 6(8), 919–926. https://doi.org/10.1016/j.eng.2020.07.001
- Talukdar, S., Singha, P., Mahato, S., Shahfahad, S. P., Liou, Y.-A., & Rahman, A. (2020). Land-use land-cover classification by machine learning classifiers for satellite observations—A review. Remote Sensing, 12(7), 1135. https://doi.org/10.3390/rs12071135
- Tang, L., & Shao, G. (2015). Drone remote sensing for forestry research and practices. Journal of Forestry Research, 26(4), 791–797. https://doi.org/10.1007/s11676-015-0088-y
- Tan, K., Piao, S., Peng, C., & Fang, J. (2007). Satellite-based estimation of biomass carbon stocks for Northeast China’s forests between 1982 and 1999. Forest Ecology and Management, 240(1–3), 114–121. https://doi.org/10.1016/j.foreco.2006.12.018
- Tsouros, D. C., Bibi, S., & Sarigiannidis, P. G. (2019). A review on UAV-based applications for precision agriculture. Information, 10(11), 349. https://doi.org/10.3390/info10110349
- Tucker, C., Brandt, M., Hiernaux, P., Kariryaa, A., Rasmussen, K., Small, J., Igel, C., Reiner, F., Melocik, K., Meyer, J., Sinno, S., Romero, E., Glennie, E., Fitts, Y., Morin, A., Pinzon, J., McClain, D., Morin, P. … Saatchi, S. (2023). Sub-continental-scale carbon stocks of individual trees in African Drylands. Nature, 615(7950), 80–86. https://doi.org/10.1038/s41586-022-05653-6
- Tzutalin. 2015. “LabelImg.” https://github.com/tzutalin/labelImg
- Vashum, K. (2012, January). Methods to estimate above-ground biomass and carbon stock in natural forests - A review. Journal of Ecosystem & Ecography, 02(4), https://doi.org/10.4172/2157-7625.1000116
- Vieilledent, G., Vaudry, R., Andriamanohisoa, S. F. D., Rakotonarivo, O. S., Randrianasolo, H. Z., Razafindrabe, H. N., Bidaud Rakotoarivony, C., Ebeling, J., & Rasamoelina, M. (2012). A universal approach to estimate biomass and carbon stock in tropical forests using generic allometric models. Ecological Applications, 22(2), 572–583. https://doi.org/10.1890/11-0039.1
- Wang, C. (2006). Biomass allometric equations for 10 Co-occurring tree species in Chinese temperate forests. Forest Ecology and Management, 222(1–3), 9–16. https://doi.org/10.1016/j.foreco.2005.10.074
- West, G. B., Brown, J. H., & Enquist, B. J. (1999). A general model for the structure and allometry of plant vascular systems. Nature, 400(6745), 664–667. https://doi.org/10.1038/23251
- World Meteorological Organization. 2021. “State of climate in 2021: Extreme events and major impacts.” https://public.wmo.int/en/media/press-release/state-of-climate-2021-extreme-events-and-major-impacts
- Xiang, W., Zhou, J., Ouyang, S., Zhang, S., Lei, P., Jiaxiang, L., Deng, X., Fang, X., & Forrester, D. I. (2016). Species-specific and general allometric equations for estimating tree biomass components of subtropical forests in Southern China. European Journal of Forest Research, 135(5), 963–979. https://doi.org/10.1007/s10342-016-0987-2
- Xie, T. T., Su, P. X., An, L. Z., Shi, R., & Zhou, Z. J. (2017). Carbon stocks and biomass production of three different agroforestry systems in the temperate desert region of Northwestern China. Agroforestry Systems, 91(2), 239–247. https://doi.org/10.1007/s10457-016-9923-1
- Yang, J., Gong, P., Rong, F., Zhang, M., Chen, J., Liang, S., Bing, X., Shi, J., & Dickinson, R. (2013). The role of satellite remote sensing in climate change studies. Nature Climate Change, 3(10), 875–883. https://doi.org/10.1038/nclimate1908
- Yang, Y., Pin, L., Ding, J., Zhao, X., Wenhong, M., Chengjun, J., & Fang, J. (2014). Increased topsoil carbon stock across China’s forests. Global Change Biology, 20(8), 2687–2696. https://doi.org/10.1111/gcb.12536
- Yu, R., Luo, Y., Zhou, Q., Zhang, X., Dewei, W., & Ren, L. (2021). Early detection of Pine Wilt Disease using deep learning algorithms and UAV-based multispectral imagery. Forest Ecology and Management, 497(October), 119493. https://doi.org/10.1016/j.foreco.2021.119493