
 ?Mathematical formulae have been encoded as MathML and are displayed in this HTML version using MathJax in order to improve their display. Uncheck the box to turn MathJax off. This feature requires Javascript. Click on a formula to zoom.
ABSTRACT
Rapid urban development has led to severe land subsidence in Luoyang, Henan Province in the past few years. The current research on subsidence in urban areas of Luoyang is relatively few and early, and cannot reflect the current status of land subsidence in Luoyang. To grasp the current status of land subsidence in Luoyang and prevent the harm caused by subsidence. We used 57 Sentinel-1A Synthetic Aperture Radar (SAR) images covering Luoyang to obtain the land subsidence from April 2017 to December 2021 by using the small baseline subset interferometric SAR technique. The results show that there are several areas of land subsidence in Luoyang City, and the most serious area of subsidence is located near the highway in Jianxi District, with a cumulative subsidence of 130 mm. Land subsidence exists to varying degrees near transportation facilities (Expressway roads, railway, metro), key urban facilities (airports, high-speed railway stations) and ancient sites in Luoyang. A number of small-scale local subsidence in Luoyang is mainly related to high-intensity urban construction, and urban highway and building construction are the main causes of local land subsidence. Industrial activities are also an important factor in land subsidence in Luoyang. Groundwater and rainfall can impact land subsidence, and large amounts of rainfall during the flood season can replenish groundwater resources and slow down the rate of land subsidence. Loess foundations and large amounts of artificial fill in the city may also induce land subsidence.
1. Introduction
Land subsidence is a continuous, progressive, and cumulative geological hazard (Dinar et al., Citation2021; Lai et al., Citation2022). The accelerated global urbanisation (Shi et al., Citation2021) and excessive exploitation of groundwater (Larson et al., Citation2001) have made land subsidence one of the major geological hazards affecting urban development (Cigna & Tapete, Citation2021). At present, more than 150 cities around the world are facing the threat of land subsidence (e.g. Chaussard et al., Citation2014; Goorabi et al., Citation2020; Malik et al., Citation2022; Sneed & Brandt, Citation2015). Land subsidence can damage buildings, destroy urban infrastructure such as rail transportation and underground pipeline networks (Bru et al., Citation2017; Lyu et al., Citation2019; Lyu et al., Citation2020), and increase the risk of urban flooding (de Oliveira-Júnior et al., Citation2022; da Silva Monteiro, L et al., Citation2022; Lyu et al., Citation2019). In addition, poor urban management and governance, imperfect drainage facilities, weak disaster prevention capabilities and extreme events can exacerbate the hazards of land subsidence (Zheng et al., Citation2022), hinder the sustainable development of cities, and also threaten people’s lives and property safety (Herrera-García et al., Citation2021).China, as the world’s largest developing country, is experiencing massive and rapid urbanisation (Yin et al., Citation2005), and land subsidence caused by excessive groundwater extraction and high-intensity construction is becoming an increasingly prominent problem (Zhao et al., Citation2022). Land subsidence has occurred in Beijing (Zhu et al., Citation2015), Tianjin (Zhou et al., Citation2022), Shanghai (Li et al., Citation2022), Chengdu (Pan et al., Citation2020), Zhengzhou (Ye et al., Citation2022), and other provinces (Zhou et al., Citation2017); three major subsidence areas are formed: the North China Plain, the Yangtze River Delta, and the Fenwei Basin (Bai et al., Citation2021; Cao., Citation2022; Chen et al., Citation2021).
Luoyang is a famous historical and cultural city (Du & Liu, Citation2014), known as the ‘Ancient Capital of the Nine Dynasties’, and an important industrial city in central China (Fan et al., Citation2009). Luoyang has 7 counties and 7 districts, with a total area of 15,200 km2, including 2,274 km2 of urban area, and a resident population of 7.069 million. In recent years, Luoyang City has been developing rapidly and has invested heavily in urban and transportation construction by building a transportation network of highways, national roads, provincial roads, and expressways, as well as constructing two metro lines (Zhang, Citation2021). Geological disasters such as land subsidence, ground cracks and surface collapse often occur in Luoyang City because of large-scale human activities (e.g. mine development, engineering excavation, and urban construction) and complex geological conditions in the city (Hu et al., Citation2012).
Luoyang is one of the early cities in China to discover the phenomenon of land subsidence, and it has been 40 years since the discovery of the land subsidence phenomenon. In March 1979, the bench mark established in 1965 in Jianxi District was first found to have a large range of elevation decline during the second grade in Luoyang (Wang et al., Citation2000). Since then, the rate and extent of land subsidence in Luoyang have been increasing with the rise in human activities and over-exploitation of groundwater; as a result, several subsidence funnels have been formed in Luoyang. From 1965 to 1978, the subsidence area was mainly located near Shanghai Market in Jianxi District, with an average annual subsidence of 3.04 mm/a, and the cumulative subsidence in the central area reached 110 mm. Between 1978 and 1987, the subsidence area in the city began to expand, and significant land subsidence occurred in Jianxi District, Xigong District and Luonan water source. Among them, the average annual subsidence was
4.51 mm/a in Jianxi District,
2.9 mm/a in Xigong District, and
2.2 mm/a near the Luonan water source. The land subsidence area in Jianxi District expanded between 1993 and 2004, while large areas of subsidence occurred near the Dongjiao water source and the Lilou water source (Wang et al., Citation2000). The distribution of land subsidence in the city changed from 2004 to 2014, and land subsidence in Jianxi, Xigong and old city districts decreased or disappeared. However, Luolong District, where the original land subsidence is not obvious, has been observed with a large range of land subsidence, with the local average subsidence reaching more than 30 mm (Ma & Zhang, Citation2008). In recent years, the rapid economic development of Luoyang has increased the scale of urban construction, and the construction of various engineering projects has led to large-scale land subsidence in Luoyang.
The government has done a lot of work from the identification of land subsidence to monitoring and prevention. To monitor the ground deformation in Luoyang City, subsidence monitoring points were redeployed throughout the city in 2001, and several level observations were conducted. Land subsidence is mainly divided into three types: geological movement Tectonic subsidence, groundwater exploitation subsidence and underground resource goaf subsidence (Guo et al., Citation2016). At present, Luoyang City mainly relies on more than 200 subsidence monitoring points deployed in the city to monitor land subsidence, and it lacks a long-term effective ground subsidence detection network (Ma & Zhang, Citation2008). Traditional monitoring methods (level survey, GNSS, bedrock bench mark and step bench marks) can only work in a relatively small area, and conducting subsidence monitoring on a large scale is difficult (Chaussard et al., Citation2013; Huang et al., Citation2021; Li & Zhou, Citation2017; Poland et al., Citation2006; Serrano-Juan et al., Citation2016). Interferometric Synthetic Aperture Radar (InSAR) technology has the advantages of all-day, all-weather, wide coverage and high measurement accuracy (Alatza et al., Citation2020; Han et al., Citation2020), of which the Persistent Scatterer InSAR (PS-InSAR) (Ferretti et al., Citation2001), Small Baseline Subset InSAR (SBAS-InSAR) (Beradino et al., Citation2002), Stanford method for persistent scatterers (StamPS) (Hooper et al., Citation2007) and other time series InSAR technology have become important monitoring method in the fields of land subsidence, geohazard, and potential hazard point identification (Scaioni et al., Citation2018; Seidel et al., Citation2016; Zhang et al., Citation2022).
All the abovementioned studies are early land subsidence situation in Luoyang (before 2015), and most of them use traditional methods to study the land subsidence in local areas. Although InSAR technology has been used extensively in recent years for urban land subsidence monitoring studies, but the current reports focusing on the current status of land subsidence in Luoyang are less. To study the current situation and change characteristics of land subsidence in Luoyang, we used SBAS-InSAR technique to obtain the time series displacements and surface deformation average annual rate of Luoyang main urban area using 57 Sentinel-1A scenes acquired from April 2017 to December 2021, and analysed the spatial and temporal characteristics of land subsidence in Luoyang in recent years. On the one hand, we studied the effects of land deformation on important infrastructure and ancient sites in urban areas. On the other hand, we explored the mechanism of land subsidence from both anthropogenic and natural factors in the context of the actual situation in Luoyang. Our study can provide a reference basis for urban construction and land subsidence disaster prevention and control in Luoyang.
2. Study area and data sources
2.1. Study area
Luoyang is located in the west of Henan Province, bordering the Yellow River in the north and the Qinling Mountains in the south. The overall topography is high in the west and low in the east and belongs to the basin terrain. Luoyang has a maximum West – East directional distance of 179 km from east to west and a maximum North – South directional distance of about 168 km. Mountains, rivers, and hills are intertwined in the territory. The topography is complex, of which 45.51% is mountainous, 40.73% is hilly, and 13.8% is plain. The geographical location of the study area is 111.8° to 112. 59°E and 33.35° to 35.05°N, and it covers the main urban areas of Luoyang and surrounding areas. shows the geographical location of the study area. More than 10 mountain ranges can be found around the city, such as Xiaoshan Mountain, Xiong’er Mountain, Longmen Mountain, Wan’an Mountain, and Song Mountain. Luoyang has a warm temperate continental monsoon climate with four distinct seasons, namely, hot and rainy in summer and cold and snowless in winter, with an annual precipitation of 528–800 mm. Luoyang crosses two important rivers, the Yellow River and the Yangtze River, and is densely populated with rivers and lakes. The main watershed is formed by the Yellow River system, with more than 10 rivers winding through it, including the Luo River, the Yi River and the Jian River.
Figure 1. Location of the study area.
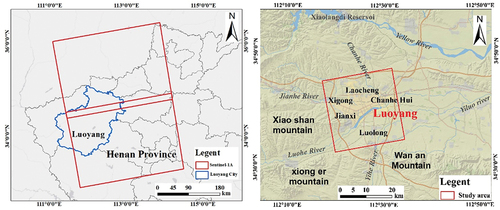
Luoyang is located in the Mesozoic Cenozoic fault basin among Xiaoshan Mountain, Xiong’er Mountain and Wan’an Mountain, with the Mangshan Mountain in the north and the Yiluo River valley in the middle (Jia et al., Citation2021). The urban area can be divided into three types of landforms: loess, residual mountain, and valley. Among them, the residual mountain landscape is mainly distributed in the south of the city. It extends east – west along Longmen Mountain. It has an elevation generally between 200 and 260 m, which is composed of Cambrian, Carboniferous and Permian. Loess landform can be divided into loess tableland and loess beam. Loess tableland is located in the Mangshan Mountain north of the city, and it has an elevation in 140 and 240 m. Loess beam is mainly distributed in the western and southern part of the city, and its terrain fluctuates greatly. The river valley landform can be collectively referred to as the river valley plain, with a plain area of about 259.22 km2. The topography of the Yiluo plain is flat and mainly composed of sandy and gravel.
2.2. Data sources
We acquired ascending Sentinel-1A images covering the main urban area of Luoyang City between April 2017 and December 2021, with a total of 57 images and a time interval of one month. The information of Sentinel-1A images is shown in . We used precise orbit ephemerides (POD) to eliminate orbital errors by the European Space Agency. Digital elevation model (DEM) with a spatial resolution of 30 m was used to remove topographic phases in the interferometric phase by the National Aeronautics and Space Administration.
Table 1. SAR data parameters.
We also collected data related to land subsidence affecting Luoyang. The metro information of Luoyang was obtained from Luoyang Metro Group Co., the traffic data of Luoyang were obtained from the website of Henan Provincial People’s Government (http://www.henan.gov.cn/2021/06–04/2158781.html), and the rainfall and groundwater data were obtained from the Water Resources Bulletin of Luoyang. We used Google Earth historical optical images as well to better analyse the urban construction of Luoyang.
3. Methodology
3.1. SBAS-InSAR technology
SBAS-InSAR technique forms several short baseline sets by freely combining the acquired SAR images according to the principle of relatively compact spatial baseline distance and large spatial baseline distance for interferometric image between sets. Appropriate spatial and temporal baseline thresholds are set so that the interferometric images satisfying the conditions can be registered and interfered to obtain small baseline interferograms. On the basis of the minimum norm criterion of deformation rate, the deformation phase and topographic noise phase of the study area at a certain time period are obtained by using the least square method or Singular Value Decomposition (SVD) (Beradino et al., Citation2002; Ferretti et al., Citation2001).
Suppose there are SAR images with a time series of
in the study area. One of the images is selected as the master image, and the remaining images are registered with it to generate
multi-view differential interferograms.
satisfies the following inequality (if
is an even number):
The differential interferogram is generated by interfering the SAR image maps at time
and time
(
). The phase of the differential interferogram at pixel coordinates
can be expressed as:
where and
represent the phase values of SAR images at
and
, respectively,
and
are the cumulative form variables in the Line of Sight (LOS) direction relative to
at moments
and
.
denotes the residual phase of the differential interferogram.
is the phase error caused by atmospheric delay.
denotes random noise phases.
When the effects of residual terrain phase, atmospheric phase and noise phase errors are not considered, Equation (2) can be expressed as:
Assuming that represents the major image of the time series and
represents the slave image of the time series, the difference equation is obtained as follows:
EquationEquation 8(8)
(8) is expressed in matrix as:
When the rank of matrix is
, the least square method is used to calculate:
When the rank of is less than
, the equation can be solved by using SVD. However, the results will cause the shape variable to jump and be discontinuous, which can be solved by solving the average rate of phase change at adjacent moments, as shown in equation:
represents the average rate of phase change, which can be obtained by combining EquationEquation 8
(8)
(8) :
Finally, the rate in each time period is integrated to obtain the amount of surface deformation in the target time period
3.2. Experimental flow
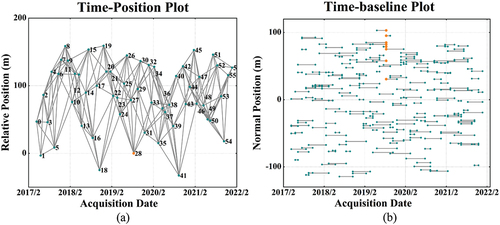
The main processing flow is shown in . The image acquired on 21 March 2019 is used as the master image with a time threshold of 180 days and a spatial baseline threshold of 2%, and the other 56 slave images are realigned with the master image. A total of 222 interferometric pairs are constructed, and shows their spatiotemporal baseline distribution. A total of 222 pairs of small baseline interferometric atlases were constructed, and shows their spatio-temporal baseline distribution. There is good interference between the images and no isolated images. Interferometric processing is performed on all interferometric pairs to generate differential interferograms. After the the flat-earth and topographic phase is removed, we conduct phase unwrapping and generate phase diagram. The least square method is utilised to calculate the phase after unwrapping according to the baseline distribution. The atmospheric phase and other errors are removed by two inversions to obtain the accurate displacement results on the time series. Next, we analysed the impact of land subsidence on important infrastructures and ancient sites in urban areas, and we explored the mechanisms of land subsidence in Luoyang from both anthropogenic and natural factors.
Figure 2. Flow chart of the experiment.
Figure 3. (A) time-position of interferometric pairs, (b) time-baseline of interferometric pairs. The orange diamond denotes the super master image. Grey lines represent interferometric pairs. Darkcyan diamonds denote slave images.
4. Results
4.1. Temporal and spatial distribution of land subsidence in Luoyang
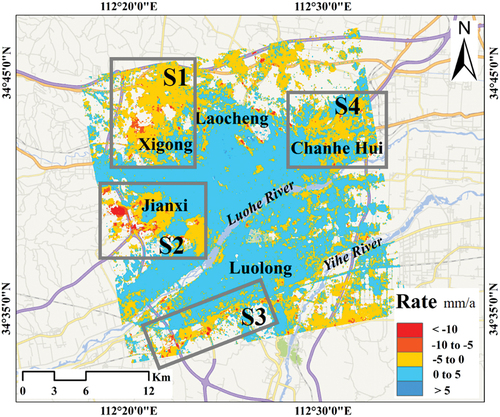
We extracted 2.06 million coherent target points in this experiment, and the temporal and spatial distribution information of subsidence in Luoyang from April 2017 to December 2021 was obtained. shows the land subsidence rate in the direction of LOS in Luoyang. Positive values in the figure indicate uplift, while negative values indicate subsidence. The land subsidence rate in the main urban area of Luoyang ranges from 23.9 mm/a to 12.9 mm/a, with an average subsidence rate of
0.3 mm/a. Four major subsidence areas are found, which are located in Jianxi, Xigong, Luolong, and Chanshui River Hui Autonomous Region. Among them, the subsidence in Jianxi District is the most serious, with a land subsidence rate of more than
20 mm/a, and the subsidence is mainly concentrated near the expressway road being built. The largest area of subsidence is found in Xigong District. The subsidence in Luolong District is mainly concentrated near the railroad line, and the land subsidence rate in some areas exceeds
10 mm/a. From the spatial distribution, the overall subsidence in Luoyang City is small, and most areas in the city are relatively stable. The land subsidence rate is between 0 and 5 mm/a, and the subsidence is mainly concentrated in the edge areas.
Figure 4. Map of subsidence rates in the LOS direction in Luoyang from 2017.04–2021.12. Major areas of subsidence are in grey boxes. S1, S2, S3 and S4 represent Xigong District, Jianxi District, Luolong District and Chanhe Hui Autonomous Region, respectively.
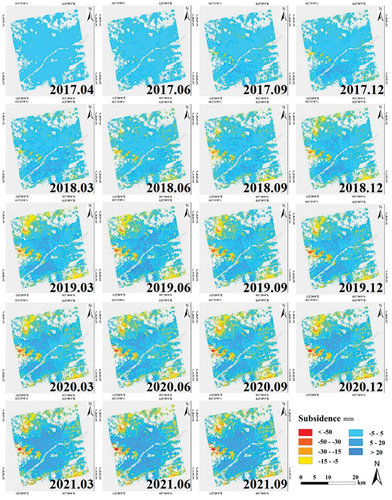
We calculated the time series of cumulative subsidence from April 2017 to December 2021 in Luoyang to study the spatial and temporal evolution of land subsidence. The results are shown in , with the image acquired on 12 April 2017 as the starting image. The distribution of cumulative subsidence is consistent with the distribution of subsidence rate, and the land as a whole shows the spatial distribution characteristics of ‘stable in the middle and subsidence at the edge’. Most of the study area is relatively stable, with cumulative subsidence ranging from 5 mm to 10 mm. The maximum subsidence of Luoyang during the study period is
134 mm, and it is located near Jianxi District. The amount of subsidence in major subsidence areas gradually increases over time, while the area of subsidence begins to expand. Land subsidence in Luoyang can exhibit significant nonlinear subsidence with seasonal changes. The area of subsidence increases rapidly between March and June during the same year. However, the change in subsidence is smaller between June and September, and a slowing trend in land subsidence is observed. Subsidence in Luoyang may be influenced by rainfall. Notably, Luoyang has more rainfall from June to August, and land subsidence is slowed down. A large amount of rainfall can effectively recharge groundwater, which may alleviate land subsidence.
Figure 5. Time series of cumulative subsidence in Luoyang from 2017.04–2021.09. (the image acquired in 2019.03 is the reference image).
4.2. Accuracy checking of subsidence results
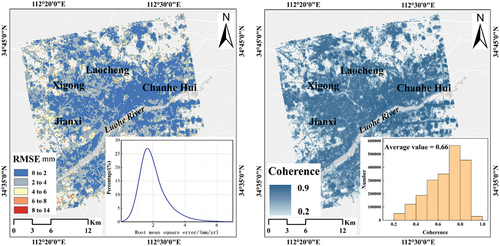
We obtained the root mean square error (RMSE) of the mean deformation rate results by calculating the deviation of rate linear fitting to evaluate the accuracy of the SBAS-InSAR monitoring results. The spatial distribution of RMSE and the probability density function of the subsidence rate are shown in , and the average value of RMSE is 2.2 mm/a. The RMSE of 98% of the coherent target points in the study area is less than 5 mm/a, which indicates the high accuracy of InSAR time series results. We also plotted the coherence distribution of the study area (). As shown in the figure, the average coherence reaches 0.66, which is a strong coherence. The RMSE is smaller in the downtown area of Luoyang and larger in the deformation and edge areas. The coherence is high in urban areas, and the deconvolution results are better. By contrast, the deformation area has uneven subsidence and the edge of the image is in the mountainous area. Thus, the coherence is low and the error is larger.
Figure 6. RMSE and coherence of deformation rate.
5. Analysis
Land subsidence not only affects the surface parts of Luoyang (buildings, roads, and bridges) but also damages the underground parts (subways and ancient sites). We will analyse the impact of land subsidence in Luoyang. The causes of land subsidence from urban infrastructure construction, groundwater and rainfall, and hydrogeology will also be explored.
5.1. Impact of subsidence on urban transportation facilities
The urban transportation network mainly includes expressway roads, urban highways, and metro railways, which are the main ways for urban residents to travel. Luoyang is an important transportation hub in the central and western regions of China. The ‘cross’ expressway railroad network, the ‘three horizontal, three vertical and three circular’ expressway road network, expressway network, and metro railways have greatly improved the traffic efficiency of Luoyang. Urban transportation network is closely related to urban development and the safety of residents’ personal property. Regular monitoring of its deformation is an important means to prevent disasters and guarantee the personal safety of passengers.
5.1.1. Expressway roads
Luoyang began to promote the construction of expressway and highway in 2015 by focusing on building a modern comprehensive transportation system and constructing a crisscrossing highway transportation network. The latest information shows the city’s road mileage reached 19,800 km by the end of 2020, including 576 km of expressway. Furthermore, more than 30 urban overpasses were built. Large-scale traffic construction has caused serious land subsidence along some roads, which threatens the safe operation of urban traffic. shows the land subsidence along the Nanning – Luoyang expressway in the western part of Luoyang. The subsidence is mainly concentrated at the intersection of Nanning – Luoyang expressway and Silu highway. show the two main subsidence areas of the Luoyang section of Nanning – Luoyang expressway, respectively.
Figure 7. Land subsidence rate in the LOS direction and cumulative deformation of expressway. In the black box are the major subsidence areas. Green dots indicate the location of PS points.
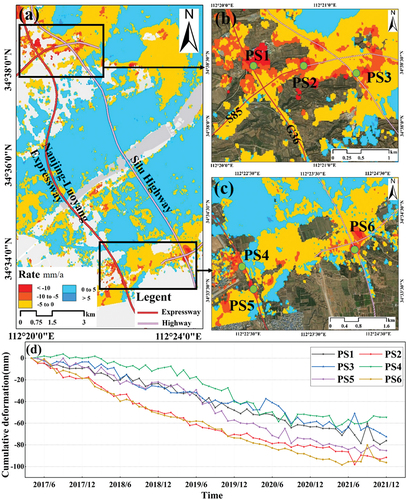
Some reference points in the centre of subsidence (PS1-PS6) were selected to plot the cumulative subsidence curve, and the subsidence trend in the area around the expressway is shown in . The subsidence at the northern end of the Nanning – Luoyang expressway is mainly concentrated on two urban interchanges, with a subsidence rate of 15 mm/a. The subsidence at the middle connection of the interchanges is the most serious, with a maximum subsidence rate of
19.718 mm/a and a cumulative subsidence exceeding 100 mm. The subsidence at the south end of Nanning – Luoyang expressway is greater than that at the north end, with the maximum subsidence rate at points PS5 and PS6 exceeding
20 mm/a and the cumulative subsidence amount approaching 100 mm. As observed from the time series, the subsidence started to accelerate in 2018, which is consistent with the construction time of expressway. After the road construction is completed in December 2020, the land subsidence starts to decrease and some of the area has a small uplift.
5.1.2. Subsidence along the railway line
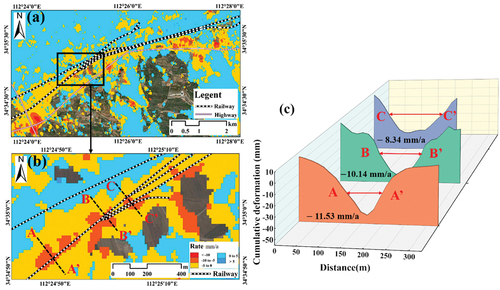
Uneven subsidence is a serious threat to the stability of railway operation, and subsidence deformation monitoring along high-speed railway is an important prerequisite for ensuring railway safety. Luoyang has three major railway lines, namely, Longhai, Jiaoliu, and Zhengxi. In this study, we find that extensive subsidence has occurred along the Zhengxi and Luoyi railways, as shown in . The subsidence along the Luoyi railway is serious, with a total of four subsidence funnels (). We conducted a profile analysis of three subsidence funnels along the railway (AA’, BB’, and CC’) and obtained the deformation rate of the subsidence centre to determine the subsidence along the Luoyi railway in detail, and the results are shown in . The subsidence along the railway line decreases from west to east, and the maximum subsidence rate reaches 11.53 mm/a on the west side, and the maximum deformation is close to 50 mm. With the bifurcation of the railway, the subsidence rate and cumulative deformation along the railway decreases. Moreover, the subsidence rate at the eastern CC’ of the railway is
8.34 mm/a. However, the subsidence range gradually expands.
Figure 8. Subsidence along the railway line. The black box shows the major areas of subsidence. The black dashed line is the profile.
5.1.3. Subsidence along the metro line
The metro can effectively relieve the pressure of urban surface traffic and improve commuting efficiency. The metro line construction in Luoyang is shown in . Up to December 2021, Luoyang metro has opened 2 lines of operation, for Luoyang metro line 1 and Luoyang metro line 2, with a total of 34 stations.
Table 2. Information of Luoyang metro under construction.
Metro line construction process can affect the surrounding soil, which result in land deformation. This phenomenon affects the safety of metro line construction and ground buildings. It can even lead to foundation deformation in dense building areas. We extracted the subsidence information in the 200 m area on both sides along the Luoyang metro line, and the results are shown in . Land subsidence exists at both ends of metro Line 1, and the situation is more serious from South Qiming Road Station to Yangwan Section. Subsidence has also occurred near Bailitang Station at the southern end of metro Line 2. shows the cumulative deformation curves in the centres of the three subsidence regions. The subsidence rate at both ends of Line 1 is about 10 mm/a. The south of Line 2 has a large subsidence, with a rate of
15.2 mm/a in the central area, and a maximum cumulative subsidence at PS3 exceeds 50 mm. The deformation curve shows that the ground is relatively stable in 2017, the rate of land subsidence accelerates from 2018, and the subsidence decreases after 2020. The time of curve change is consistent with the construction cycle of the metro line. Therefore, the metro line construction has caused land subsidence in the surrounding area.
Figure 9. Subsidence along the metro line. (a) subsidence of Luoyang metro line, the black box is the areas of subsidence, the black dashed line is the profile, and green dots indicate the location of PS points. (b) PS point cumulative deformation curve. PS1, PS2 and PS3 correspond to the points in . (c) the profile deformation rate and cumulative deformation of AA’.
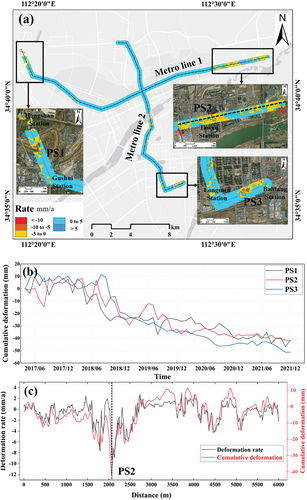
The section from South Qiming Road Station to Yangwan Station in the eastern section of metro Line 1 shows significant land subsidence. We conducted a profile analysis along the centerline (black dashed line AA’ in the figure) to analyse the subsidence variation in detail, and shows the profile deformation rate and cumulative deformation. The overall appearance is relatively stable, and the amount of subsidence is less than 10 mm. The subsidence rate at 1500 to 3000 m shows large fluctuations and rapid changes. The subsidence at PS2 of Tawan station is the most serious, with a subsidence rate of 12 mm/a and a maximum subsidence of over 70 mm.
5.2. Impact of land subsidence on important urban facilities
Airports and train stations, as important urban facilities, are one of the symbols of modern society. Airport runways and railway platform facilities are affected by natural and man-made factors. These factors can lead to land subsidence, crack, and collapse, which result in safety accidents. Therefore, we monitored the land subsidence around Luoyang Beijiao Airport and Luoyang Longmen High Speed Railway Station.
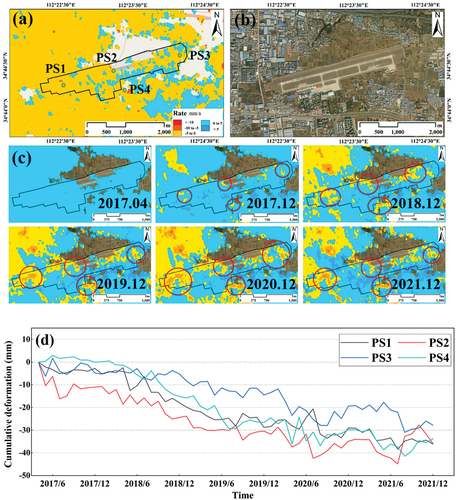
shows the land subsidence of the airport. A large area of subsidence is observed in the airport area, and several subsidence funnels appear. The optical satellite image of the airport (), also shows that the subsidence is mainly concentrated on the runway of the airport, and obvious subsidence funnels appear near the terminal. shows the change in cumulative subsidence at the airport from April 2017 to December 2021, with subsidence beginning near the airport runway in 2018 and increasing in extent and magnitude with time. We plotted the time series curves of the subsidence centres to explore the subsidence trends in the airport, as shown in . The airport subsidence starts to intensify after June 2018, and the cumulative deformation exceeds 40 mm by June 2020. Land subsidence decreases and some surface uplift occurs between 2020 and 2021. The subsidence in the middle of the airport runway (PS2) is severe, with a maximum of
44.9 mm. The subsidence near the airport terminal (PS4) may also be related to the expansion of the airport.
Figure 10. Subsidence of Luoyang Beijiao airport. (a) land subsidence around Luoyang Beijiao airport. Green dots indicate the location of PS points. (b) Google satellite optical images of the region. (c) time series of cumulative subsidence in Luoyang Beijiao airport. The red ellipse is the major subsidence area. (d) PS point cumulative deformation curve.
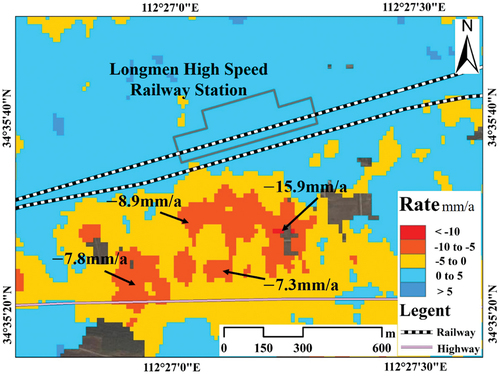
shows the land subsidence near Luoyang Longmen High speed Railway Station. Compared with the airport, the ground is relatively stable and no obvious subsidence has occurred. However, a large area of land subsidence has occurred in the south of the Longmen High speed Railway Station, with a maximum subsidence rate of 15.9 mm/a at the centre. The subsidence may be related to the surrounding urban construction, which may impact the safe operation of railway if the subsidence expands further.
Figure 11. Subsidence of Luoyang Longmen high speed railway Station.
5.3. Influence of subsidence on underground ancient sites
Luoyang has a civilisation history of more than 5,000 years, and 13 dynasties have built their capitals here. Five major city sites are preserved, namely, Erlitou Site of the Xia Capital, Yanshi City of Shang dynasty, the city of East Zhou dynasty, Hanwei Dynasty Capital of Luoyang, and Luoyang City established in the Sui and Tang dynasties. In the process of rapid urbanisation, the reconstruction and preservation of ancient sites are also an important part of urban modernisation. The Luoyang government pays attention to the protection of historical relics. Underground cultural relics are avoided as much as possible in the process of urban construction to protect the cultural relics above and below ground. However, the occurrence of land subsidence can affect the subsurface ancient sites and may damage them in severe cases (Qiao & Peng, Citation2016).
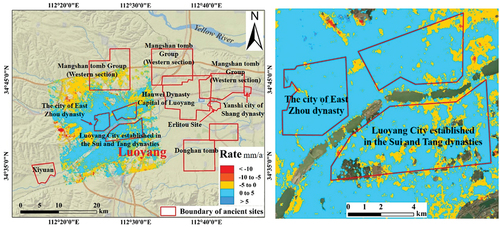
The spatial distribution of the existing ancient sites in Luoyang City is shown in . This experiment only obtained the subsidence of the ancient site area in the main urban area. Land subsidence occurred in the middle part of Luoyang City during the Luoyang City established in the Sui and Tang dynasties, with subsidence rates ranging from 10 mm/a to
5 mm/a. Mangshan tomb Group (west section), which is located in the north of Luoyang, has a large area of subsidence. The subsidence is concentrated near Lianhuo Expressway, with the maximum amount of subsidence exceeding 120 mm.
Figure 12. Distribution of ancient sites in Luoyang. The red polygon is the area of ancient sites.
5.4. Subsidence caused by urban infrastructure construction
Urban construction is an important cause of subsidence. Groundwater will be pumped out during the excavation of the foundation pit, and the construction of buildings will increase the ground load. These situations will result in compression of the soft soil layer and cause land subsidence. In reality, multiple buildings are often constructed at the same time, which can cause regional large-scale subsidence.
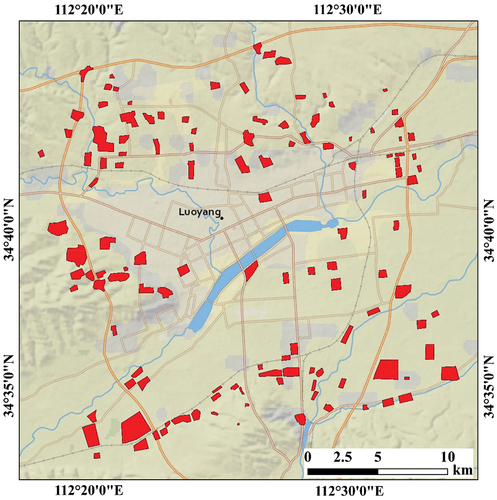
To explore the effect of urban construction on land subsidence, we extracted all areas in the study area where the subsidence rate exceeded 10 mm/a and mapped the extent of subsidence in combination with optical satellite imagery (red areas in ). A total of 126 areas of subsidence in Luoyang were extracted from this experiment. By comparing with optical satellite imagery, we briefly statistically analysed the causes of subsidence in different areas. Among them, the subsidence located on construction sites consists of 86 places, which account for about 68.25% of the total subsidence area, 19 places on roads and transportation hubs, and 21 places in other areas. In general, the spatial distribution of land subsidence in Luoyang is controlled by urban construction to a certain extent. Urban construction is the major cause of land subsidence.
Figure 13. Distribution of major subsidence areas in Luoyang.
5.5. Impact of industrial activities
Luoyang is a modern industrial city with a solid industrial base. Luoyang, as the old industrial base which is the key construction of new China, has many industrial bases such as tractors, bearings, and minerals. The earliest industrial base is located in Jianxi District. Industrial activities can extract large amounts of groundwater, which results in a reduction in pore water pressure in the soil aquifer. This phenomenon which can cause land subsidence. Long-term industrial activities have led to Jianxi District being the earliest area in Luoyang to experience subsidence and the most serious area of subsidence.
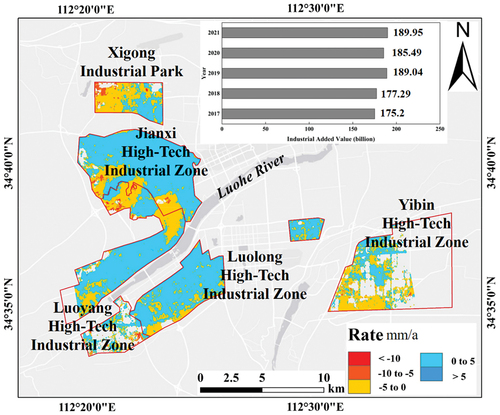
In recent years, Luoyang’s industrial added value has been growing continuously. Luoyang has established a relatively complete industrial system and planned to build a Luoyang National Innovation Demonstration Zone with a total area of 150 km2. The land subsidence in the industrial area is shown in . The subsidence in Xigong Industrial Park and Jianxi High-tech Industrial Zone is the most serious, with the maximum cumulative subsidence exceeding 130 mm. The land subsidence in Luolong High-tech Industrial Zone and Yibin High-tech Industrial Zone is relatively small, and the cumulative subsidence is nearly 60 mm. The overall spatial distribution of widespread subsidence is more consistent with the distribution of industrial areas, which implies that industry is one of the causes of land subsidence.
Figure 14. Distribution of land subsidence in industrial areas of Luoyang. Red polygons indicate industrial zone boundaries.
5.6. Influence of groundwater and rainfall on land subsidence
Luoyang is located in the Yiluo River Basin, and shallow groundwater is the main source of urban water supply. Its aquifer is characterised by shallow water layer, large thickness, and fast replenishment of surface water. In the past, the intensity of shallow groundwater extraction in Luoyang has been increasing, and groundwater over-exploitation has occurred, which has resulted in large-scale land subsidence. The construction of the Yiluo River project in recent years has increased the groundwater level and alleviated urban land subsidence in Luoyang to some extent.
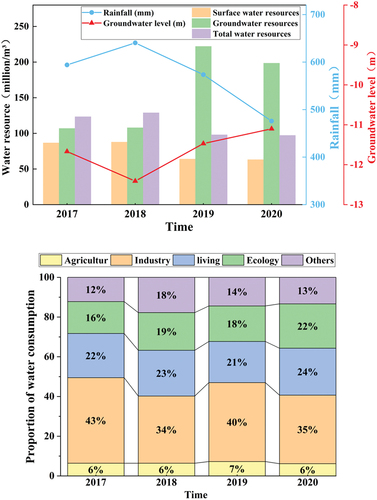
The changes in total water resources, average annual rainfall, and groundwater level between 2017 and 2020 in Luoyang are shown in , with data from the Water Resources Bulletin of Luoyang. After 2018, the annual rainfall in Luoyang and the total amount of water resources decrease. However, the total groundwater resources have been rising between 2017 and 2020, and the groundwater level has also risen significantly. This situation may be the cause of slight uplift in some areas of Luoyang. shows the proportional distribution of water consumption in Luoyang from 2017 to 2020. Industrial and residential water consumptions account for the largest share overall. Between 2017 and 2020, the proportion of industrial water declines, the proportion of residential water increases, and the proportion of water resources used for ecological environment rises. These factors lead to an increase in urban groundwater, which reduces subsidence.
Figure 15. Total water resources, rainfall and proportional of water consumption in Luoyang.
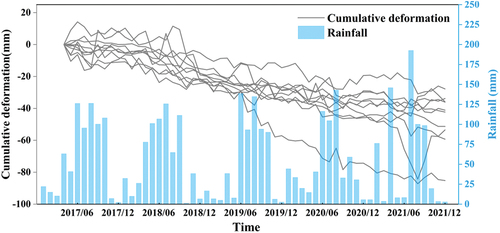
We selected 10 reference points in different areas of Luoyang and compared the cumulative deformation with the rainfall during the study period to analyse the relationship between rainfall and land subsidence, and the results are shown in . Rainfall in Luoyang is relatively concentrated, with the flood season occurring from June to September in summer, and less rainfall in other months. The trend of land deformation in Luoyang is associated with the magnitude of rainfall in a certain time range. After September, rainfall decreases significantly and the rate of land subsidence begins to increase. The decrease in subsidence during the time frame of heavier rainfall indicates that large amounts of rainfall can effectively replenish groundwater resources and slow down the rate of land subsidence.
Figure 16. Comparison between subsidence time series and rainfall.
5.7. Hydrogeology and ground uplift analysis
Luoyang is mostly distributed with loess or secondary loess except for the bedrock areas in the south and north. Loess foundations can produce wet sink deformation and cause building subsidence. Luoyang is the ancient capital of nine dynasties and has a large amount of artificial fill buried underground. The miscellaneous fill distributed in cities has complex composition, different properties, and uneven thickness. Its compressibility and strength are obviously different, which is very easy to cause uneven subsidence.
The major deformation in Luoyang is subsidence. However, significant uplift is also observed in the main urban area, with uplift rates ranging from 0 mm/a to 5 mm/a. The reason for the uplift may be related to the expansion of volume due to physical and chemical expansion effects of minerals and water in the soil after the groundwater is replenished. The ground uplift phenomenon in Luoyang has not been clearly explained, and further research is still needed.
6. Conclusions
This study shows the spatial and temporal distribution characteristics of land subsidence in Luoyang. The causes of land subsidence were also explored in the context of urban infrastructure construction, ancient sites, hydrogeology, groundwater and rainfall. The following conclusions can be drawn:
The spatial distribution of land subsidence in Luoyang is uneven, with a subsidence rate between 23.9 and 12.9 mm/a, and an average subsidence rate of
0.3 mm/a. Four major subsidence areas are found, which are located in Jianxi, Xigong, Luolong, and Chanshui River Hui Autonomous Region. Among them, the subsidence situation in Jianxi District is the most serious, the land subsidence rate in the central area is above 20 mm/a, and the subsidence range in Xigong District is the largest. The subsidence in Luolong District is mainly concentrated near the railway, and the land subsidence rate in some areas exceeds 10 mm/a. Most areas of Luoyang are relatively stable, with land subsidence rates ranging from 0 mm/a to 5 mm/a. Notably, subsidence mainly concentrates in the peripheral areas.
Land subsidence exists to varying degrees in the vicinity of important urban infrastructure and ancient sites in Luoyang. High-intensity urban construction can cause local land subsidence, and urban highway and building construction are also causes of land subsidence. As an industrial city, are also an important factor contributing to its land subsidence. Groundwater and rainfall also affect land subsidence. Large amounts of rainfall can replenish groundwater resources and slow the rate of land subsidence. Due to historical reasons, the artificial fill layer in Luoyang City is thick, and the loess foundation as well as a large amount of artificial fill can easily induce the occurrence of land subsidence.
Because the level data and detailed geological data are difficult to obtain, there are some shortcomings in the study of land subsidence in Luoyang. We will conduct a more in-depth study to investigate the causes and mechanisms of land subsidence in Luoyang in the future.
Author contributions
Conceptualization, Y.Z. and L.Z. conceived and designed the experiments; C.W., Y.L. and X.L. carried out the data acquisition; Y.Z., H.L. and L.Z. performed data processing and analyses, and Y.Z. contributed to the manuscript of the paper; Y.P., Y.H. and X.L. discussed and the results. All authors have read and agreed to the published version of the manuscript.
Acknowledgments
The authors thank all editors and reviewers for their valuable comments and suggestions on this manuscript.
Disclosure statement
No potential conflict of interest was reported by the author(s).
Data availability statement
Data incorporated in this research is available free through these webpages: Sentinel-1A (https://scihub.copernicus.eu/dhus/#/home), satellite precise orbit data (https://qc.sentinel1.eo.esa.int/aux_poeorb). 30 m SRTM DEM (http://dwtkns.com/srtm30m/). Optical data of Landsat satellites were obtained from Google Earth Pro software. Most of figures in this paper were drawn by Origin (version 2019b) and ArcMap (version 10.7) software.
Additional information
Funding
References
- Alatza, S., Papoutsis, I., Paradissis, D., Kontoes, C., & Papadopoulos, G. (2020). Multi-temporal InSAR analysis for monitoring ground deformation in Amorgos Island, Greece. Sensors, 20(2), 338. https://doi.org/10.3390/s20020338
- Bai, L., Jiang, L. M., Zhao, Y., Li, Z. H., Cao, G. L., Zhao, C. Y., Liu, R., & Wang, H. S. (2021). Quantifying the influence of long-term overexploitation on deep groundwater resources across Cangzhou in the north China plain using InSAR measurements. Journal of Hydrology, 605, 127368. https://doi.org/10.1016/j.jhydrol.2021.127368
- Beradino, P., Fornaro, G., Lanari, R., & Sansosti, E. (2002). A new algorithm for surface deformation monitoring based on small baseline differential SAR interferograms. IEEE Transactions on Geoscience and Remote Sensing, 40(11), 2375–2383. https://doi.org/10.1109/TGRS.2002.803792
- Bru, G., González, P. J., Mateos, R. M., Roldán, F. J., Herrera, G., Béjar-Pizarro, M., & Fernández, J. (2017). A-DInSAR monitoring of landslide and subsidence activity: A case of urban damage in Arcos de la Frontera, Spain. Remote Sensing, 9(8), 787–804. https://doi.org/10.3390/rs9080787
- Cao, J. T., Zhang, X. Y., Fan, H. D., Li, G. H., & Huang, C. (2022). Surface deformation monitoring in the Yellow River delta by using DS-InSAR technique. Journal of Geodesy and Geodynamics, 42(11), 1177–1183. https://doi.org/10.14075/j.jgg.2022.11.015
- Chaussard, E., Amelung, F., Abidin, H., & Hong, S. (2013). Sinking cities in Indonesia: ALOS PALSAR detects rapid subsidence due to groundwater and gas extraction. Remote Sensing of Environment, 128, 150–161. https://doi.org/10.1016/j.rse.2012.10.015
- Chaussard, E., Wdowinski, S., Cabral-Cano, E., & Amelung, F. (2014). Land subsidence in central Mexico detected by alos insar time-series. Remote Sensing of Environment, 140, 94–106. https://doi.org/10.1016/j.rse.2013.08.038
- Chen, J. L., Zhou, Y., Chen, G., & Hao, M. (2021). Decades of ground deformation in the Weihe Graben, Shaanxi Province, China, in response to various land processes, observed by radar interferometry and levelling. Remote Sensing, 13(12), 2374. https://doi.org/10.3390/rs13122374
- Cigna, F., & Tapete, D. (2021). Present-day land subsidence rates, surface faulting hazard and risk in Mexico city with 2014–2020 Sentinel-1 IW InSAR. Remote Sensing of Environment, 253, 112161. https://doi.org/10.1016/j.rse.2020.112161
- da Silva Monteiro, L., de Oliveira-Júnior, J. F., Ghaffar, B., Tariq, A., Qin, S., Mumtaz, F., Correia Filho, W. L. F., Shah, M., da Rosa Ferraz Jardim, A. M., da Silva, M. V., de Barros Santiago, D., Barros, H. G., Mendes, D., Abreu, M. C., de Souza, A., Pimentel, L. C. G., da Silva, J. L. B., Aslam, M., & Kuriqi, A. (2022). Rainfall in the urban area and its impact on climatology and population growth. Atmosphere, 13(10), 1610. https://doi.org/10.3390/atmos13101610
- de Oliveira-Júnior, J. F., Correia Filho, W. L. F., da Silva Monteiro, L., Shah, M., Hafeez, A., de Gois, G., Lyra, G. B., Carvalho, M. A. D., Barros Santiago, D. D., Souza, A. D., Mendes, D., Souza Costa, C. E. A. D., Blanco, C. J. C., Zeri, M., Pimentel, L. C. G., Jamjareegulgarn, P., & Silva, E. B. D. (2022). Urban rainfall in the capitals of Brazil: Variability, trend, and wavelet analysis. Atmospheric Research, 267, 105984. https://doi.org/10.1016/j.atmosres.2021.105984
- Dinar, A., Esteban, E., Calvo, E., Herrera, G., Teatini, P., Tomás, R., Li, Y., Ezquerro, P., & Albiac, J. (2021). We lose ground: Global assessment of land subsidence impact extent. Science of the Total Environment, 786(1), 147415. https://doi.org/10.1016/j.scitotenv.2021.147415
- Du, S. S., & Liu, F. L. (2014). Loessic palaeolith discovery at the Beiyao site, Luoyang, and its implications for understanding the origin of modern humans in northern China. Quaternary International, 349, 308–315. https://doi.org/10.1016/j.quaint.2014.05.037
- Fan, J., Wang, H. Y., Tao, A. J., & Xu, J. H. (2009). Coupling industrial location with urban System distribution: A case study of China’s Luoyang municipality. Acta Geographica Sinica, 64(2), 131–141. https://doi.org/10.3321/j.issn:0375-5444.2009.02.001
- Ferretti, A., Prati, C., & Rocca, F. (2001). Permanent scatterers in SAR interferometry. IEEE Transactions on Geoscience and Remote Sensing, 39(1), 8–20. https://doi.org/10.1109/36.898661
- Goorabi, A., Karimi, M., Yamani, M., & Perissin, D. (2020). Land subsidence in Isfahan metropolitan and its relationship with geological and geomorphological settings revealed by Sentinel-1A InSAR observations. Journal of Arid Environments, 181, 104238. https://doi.org/10.1016/j.jaridenv.2020.104238
- Guo, J. M., Zhou, L., Yao, C. L., & Hu, J. Y. (2016). Surface subsidence analysis by multi-temporal InSAR and GRACE: A case study in Beijing. Sensors, 16(9), 1495. https://doi.org/10.3390/s16091495
- Han, Y. K., Zou, J. G., Lu, Z., Qu, F. F., Kang, Y., & Li, J. W. (2020). Ground deformation of Wuhan, China, revealed by multi-temporal InSAR analysis. Remote Sensing, 12(22), 3788. https://doi.org/10.3390/rs12223788
- Herrera-García, G., Ezquerro, P., Tomás, R., Béjar-Pizarro, M., López-Vinielles, J., Rossi, M., Mateos, R. M., Carreón-Freyre, D., Lambert, J., Teatini, P., Cabral-Cano, E., Erkens, G., Galloway, D., Hung, W.-C., Kakar, N., Sneed, M., Tosi, L., Wang, H., & Ye, S. (2021). Mapping the global threat of land subsidence. Science, 371(6524), 34–36. https://doi.org/10.1126/science.abb8549
- Hooper, A., Segall, P., & Zebker, H. (2007). Persistent scatterer interferometric synthetic aperture radar for crustal deformation analysis, with application to Volcán Alcedo, Galápagos. Journal of Geophysical Research, 112(B7), B07407. https://doi.org/10.1029/2006JB004763
- Huang, J. S., Zhang, C. Y., & Wang, J. H. (2021). Monitoring surface deformation in Songming county using time series InSAR technology. Bulletin of Surveying & Mapping, 07, 103–106+116. https://doi.org/10.13474/j.cnki.11-2246.2021.0217
- Hu, Z. J., Zhao, Z. J., Mo, D. G., & Yang, J. C. (2012). Problems of geological hazards in Luoyang city and countermeasures for prevention and control. West-China Exploration Engineering, 24(3), 136–137+140. https://doi.org/10.3969/j.issn.1004-5716.2012.03.050
- Jia, Y., Zhang, Y. Z., Wang, N. L., Huang, C. C., Qiu, H. J., Wang, H. Y., Yu, Y. K., Seilbike, A., Zou, M. B., Lin, X., Tan, Z. H., Liu, W. Q., Hu, S., & Patton, N. R. (2021). Chronostratigraphic framework and paleoenvironmental interpretation of the Holocene loess-paleosol sequence in the Luoyang Basin, central China. Aeolian Research, 48, 100657. https://doi.org/10.1016/j.aeolia.2020.100657
- Lai, W. Y., Shen, Q., Wang, H. S., Shum, C. K., Jiang, L. M., Yang, B. H., Dong, J. L., Gao, F., Zhao, Y. L., & Liu, T. T. (2022). InSAR-derived land subsidence in Wuhan between 2015 and 2020. All Earth, 34(1), 224–242. https://doi.org/10.1080/27669645.2022.2110654
- Larson, K. J., Başaǧaoǧlu, H., & Mariño, M. A. (2001). Prediction of optimal safe ground water yield and land subsidence in the Los Banos-Kettleman city area, California, using a calibrated numerical simulation model. Journal of Hydrology, 242(1–2), 79–102. https://doi.org/10.1016/S0022-1694(00)00379-6
- Li, G. E., & Zhou, Y. H. (2017). Study on fusion methods of InSAR、Leveling and GPS data InSAR. Bulletin of Surveying & Mapping, 09, 78–82. https://doi.org/10.13474/j.cnki.11-2246.2017.0292
- Li, J. H., Zhou, L., Zhu, Z. Z., Qin, J., Xian, L. X., Zhang, D., & Huang, L. (2022). Surface deformation mechanism analysis in Shanghai areas based on TS-InSAR technology. Remote Sensing, 14(17), 4368. https://doi.org/10.3390/rs14174368
- Lyu, H. M., Shen, S. L., Zhou, A. N., & Yang, J. (2019). Risk assessment of mega-city infrastructures related to land subsidence using improved trapezoidal FAHP. Science of the Total Environment, 717, 135310. https://doi.org/10.1016/j.scitotenv.2019.135310
- Lyu, H. M., Zhou, W. H., Shen, S. L., & Zhou, A. N. (2020). Inundation risk assessment of metro system using AHP and TFN-AHP in Shenzhen. Sustainable Cities and Society, 56, 102103. https://doi.org/10.1016/j.scs.2020.102103
- Malik, K., Kumar, D., Perissin, D., & Pradhan, B. (2022). Estimation of ground subsidence of New Delhi, India using ps-insar technique and multi-sensor radar data. Advances in Space Research, 69(4), 1863–1882. https://doi.org/10.1016/j.asr.2021.08.032
- Ma, B. Q., & Zhang, Y. (2008). The analysis of ground sedimentation mechanism of Luoyang city. Shanxi Architecture, 03(34), 11–13. https://doi.org/10.3969/j.issn.1009-6825.2008.03.006
- Pan, C., Jiang, L. M., Sun, Q. S., & Jiang, Y. N. (2020). Monitoring and analyzing Chengdu ground subsidence based on InSAR technology by using Sentinel-1 radar image. Journal of Geodesy and Geodynamics, 40(2), 198–203. https://doi.org/10.14075/j.jgg.2020.02.017
- Poland, M., Burgmann, R., Dzurisin, D., Lisowski, M., Masterlark, T., Owen, S., & Fink, J. (2006). Constraints on the mechanism of long-term, steady subsidence at medicine Lake volcano, northern California, from GPS, leveling, and InSAR. Journal of Volcanology and Geothermal Research, 150(1–3), 55–78. https://doi.org/10.1016/j.jvolgeores.2005.07.007
- Qiao, Y. K., & Peng, F. L. (2016). Master planning for underground space in Luoyang: A case of a representative historic city in China. Procedia Engineering, 165, 119–125. https://doi.org/10.1016/j.proeng.2016.11.743
- Scaioni, M., Marsella, M., Crosetto, M., Tornatore, V., & Wang, J. (2018). Geodetic and Remote-Sensing Sensors for Dam deformation monitoring. Sensors, 18(11), 3682–3707. https://doi.org/10.3390/s18113682
- Seidel, M., Marzahn, P., & Ludwig, R. (2016). Monitoring of sea dike structures by the means of combined StaMPS multi-temporal InSAR approach. Procedia Computer Science, 100, 1147–1154. https://doi.org/10.1016/j.procs.2016.09.268
- Serrano-Juan, A., Pujades, E., Vázquez-Suñè, E., Crosetto, M., & Cuevas-González, M. (2016). Leveling vs. InSAR in urban underground construction monitoring: Pros and cons. Case of la sagrera railway station (Barcelona, Spain). Engineering Geology, 218, 1–11. https://doi.org/10.1016/j.enggeo.2016.12.016
- Shi, X. G., Zhang, S. C., Jiang, M., Pei, Y. Y., Qu, T. T., Xu, J. H., & Yang, C. (2021). Spatial and temporal subsidence characteristics in Wuhan (China), during 2015–2019, inferred from Sentinel-1 synthetic aperture radar (SAR) interferometry. Natural Hazards and Earth System Sciences, 21(8), 2285–2297. https://doi.org/10.5194/nhess-21-2285-2021
- Sneed, M., & Brandt, J. T. (2015). Land subsidence in the San Joaquin valley, California, USA, 2007–2014. Proceedings of the International Association of Hydrological Sciences, 372, 23–27. https://doi.org/10.5194/piahs-372-23-2015
- Wang, X. G., Wu, D. M., Ge, Y., & Wang, J. L. (2000). Study on the Countermeasure for the groundwater Leveling in Luoyang city. Resources Guide, 03, 205–210.
- Ye, Y. C., Yan, C. D., Luo, X. X., Zhang, R. F., & Yuan, G. J. (2022). Analysis of ground subsidence along Zhengzhou metro based on time series InSAR. National Remote Sensing Bulletin, 26(7), 1342–1353. https://doi.org/10.11834/jrs.20211246
- Yin, Y. P., Zhang, Z. C., & Zhang, K. J. (2005). Land subsidence and countermeasures for its prevention in China. The Chinese Journal of Geological Hazard and Control, 02(16), 1–8. https://doi.org/10.3969/j.issn.1003-8035.2005.02.001
- Zhang, L. P. (2021). Research on the impact of rail transit construction on urban high-quality development—taking Luoyang city as an example. Science Technology Information, 19(18), 55–57+61. https://doi.org/10.16661/j.cnki.1672-3791.2107-5042-7175
- Zhang, X. T., Yang, X. L., He, X. F., Ma, H. T., Yu, Z. X., Ren, G. W., Zhang, H., & Zhang, J. S. (2022). Integrated GB-InSAR images and terrain data for emergency deformation monitoring assisted by point clouds. Geomatics and Information Science of Wuhan University, 47(7), 1081–1092. https://doi.org/10.13203/j.whugis20200280
- Zhao, Y. Z., Zhou, L., Wang, C., Li, J. H., Qin, J., Sheng, H. Q., Huang, L. K., & Li, X. (2022). Analysis of the spatial and temporal evolution of land subsidence in Wuhan, China from 2017 to 2021. Remote Sensing, 14(13), 3142. https://doi.org/10.3390/rs14133142
- Zheng, Q., Shen, S. L., Zhou, A. N., & Lyu, H. M. (2022). Inundation risk assessment based on G-DEMATEL-AHP and its application to Zhengzhou flooding disaster. Sustainable Cities and Society, 86, 104138. https://doi.org/10.1016/j.scs.2022.104138
- Zhou, L., Guo, J. M., Hu, J. Y., Li, J. W., Xu, Y. F., Pan, Y. J., & Shi, M. (2017). Wuhan surface subsidence analysis in 2015–2016 based on Sentinel-1A data by SBAS-InSAR. Remote Sensing, 9(10), 982. https://doi.org/10.3390/rs9100982
- Zhou, L., Zhao, Y. Z., Zhu, Z. L., Ren, C., Yang, F., Huang, L., & Li, X. (2022). Spatial and temporal evolution of surface subsidence in Tianjin from 2015 to 2020 based on SBAS-InSAR technology. Journal of Geodesy and Geoinformation Science, 5(1), 60–72. https://doi.org/10.11947/j.JGGS.2022.0107
- Zhu, L., Gong, H. L., Li, X. J., Wang, R., Chen, B. B., Dai, Z. X., & Teatini, P. (2015). Land subsidence due to groundwater withdrawal in the northern Beijing plain, China. Engineering Geology, 193, 243–255. https://doi.org/10.1016/j.enggeo.2015.04.020