
 ?Mathematical formulae have been encoded as MathML and are displayed in this HTML version using MathJax in order to improve their display. Uncheck the box to turn MathJax off. This feature requires Javascript. Click on a formula to zoom.
ABSTRACT
The potential earthquake and tsunami hazard along the Sumatra subduction margin, especially around the coast of West Sumatra-Bengkulu, was investigated based on the availability of pre-seismic surface displacement data and shallow crustal earthquake catalogue data from 1907 to 2016. The pre-seismic surface displacement data is based on the displacement data prior to and corrected displacement data after major earthquakes. Using the results of our previous study on the local covariance function and the relationship of Correlation Dimension (DC) with the b-value of Gutenberg-Richter (GR) Law, we estimated the maximum horizontal crustal strain rate (SHmax) and DC around the study area. Least squares prediction based on horizontal displacement data using the local covariance function is used to estimate the displacement model in the entire gridding study area with a 10 km × 10 km size. Furthermore, DC is calculated based on the b-value using the maximum likelihood method based on the input of a constant number of earthquake samples, assuming the regional b-value of GR Law equals 1. Furthermore, the spatial correlation of SHmax and DC can define the area of possible earthquake hazard potential. The identification results are then linked with previous stress reconstruction results for seismic hazard study and analysis. Based on the finding, we then estimate the Seismic Hazard Function (SHF) and Tsunami Height simulation to estimate the possible hazard risk at several observation points. We suggest that the result of this study could be beneficial to understand better the potential seismic and tsunami hazard in the future, mainly to support mitigation purposes.
1. Introduction
Fitch (Citation1972) and Jarrard (Citation1986) pointed out that the island of Sumatra moved separately as it is composed of different segments caused by the interactions between several plates, in particular, the convergence of the Indo-Australian Plate, which was subducting towards the Eurasian plate. According to Sieh and Natawidjaja’s (Citation2000) and Bradley et al. (Citation2017) studies, the subduction plate movement along the Sunda Trench in the southwest part of Sumatra Island with low-obliquity subduction and right-lateral shear fault near the southwest coast of Sumatra Island, parallel to the trough, which is called the Sumatran Fault Zone (SFZ). Sieh and Natawidjaja (Citation2000) pointed out that the orientation and magnitude of the relative plate movement velocity vectors that vary along plate boundaries, namely by 52 mm/yr in the northern, 57 mm/yr in the middle, and 60 mm/yr in the southern part, are caused by the curved shape of the plate boundary (). Combining oblique subduction and Sumatran shear faults results in the complexity of Sumatra’s stress, strain, and deformation patterns. It causes displacement along the subduction plane and deformation along the overriding plate (Fitch, Citation1972). The convergent plate movement of about 49 mm/year (Zachariasen et al., Citation2000) causes a very high annual rate of earthquakes. In particular, over the last 250 years, five major earthquakes (Mw ≥ 8.0) have occurred along the Sumatran megathrust (Megawati and Pan, Citation2009). Earthquakes that occur in the subduction zones are often followed by subsequent earthquakes, as McClosky et al. (Citation2005) pointed out. It indicates that the existence of the stress interaction can affect the seismicity in the forearc area (Pollitz et al., Citation2006; Triyoso & Sahara, Citation2021). For example, the 2004 Sumatra-Andaman earthquake could have caused changes in the seismic activity in the Andaman Sea (Sevilgen et al., Citation2012), which could have induced the earthquakes in Nias and the northern part of the Sumatra Fault in 2005 (McClosky et al., Citation2005, Pollitz et al., Citation2006; Triyoso & Sahara, Citation2021; Rafie et al., Citation2021).
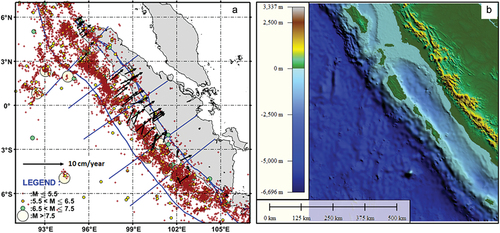
Figure 1. The distribution of shallow earthquakes with depths less than 50 km during 1963–2016 (Tim Pusat Studi Gempa Nasional-Citation2017(The 2017 PuSGeN), 2017) and the pre-seismic GPS data based on Triyoso et al (Citation2020, Citation2021, Citation2022). study and also the zones (I-VI) as mentioned by Shamim et al. (Citation2019). . the bathymetry data used in the tsunami simulation is based on geometric data provided by the General Bathymetric Charts of the Oceans (the GEBCO version 11.1, September 2008) and the digitised Nautical Chart of the Centre for Hydrographic Office (Pushidrosal) Indonesian Navy. The data are originally gridded on 1’arc (~1854 m) and have been resampled at 30’’ (~927) spatial resolution.
Natawidjaja et al. (Citation2006) studied the large uplifts and tilts that occurred on the Sumatran outer arc islands during the great historical earthquakes in 1797 and 1833, using data of the relative sea level changes recorded by annually banded coral heads and elastic forward modelling. Based on the pattern and magnitude of uplift, they suggest megathrust ruptures corresponding to moment magnitudes (Mw) in the range of 8.5 to 8.7. The patterns and magnitude of uplift and tilt in 1833 are similar to those experienced farther north during the giant Nias-Simeulue megathrust earthquake in 2005. The elastic dislocation forward modelling of the coral data yields megathrust ruptures with moment magnitudes ranging from 8.6 to 8.9. Konca et al. (Citation2008) pointed out that the Mw of the two large earthquakes around the Mentawai area in 1797 and 1833 were 8.8 and 9.0.
On 12 September 2007, two large megathrust earthquakes with Mw 8.4 and Mw 7.9 struck off the coast of Sumatra, around the Mentawai area. These two earthquakes occurred around the area where Mw 8.8 and Mw 9.0 large earthquakes occurred in 1797 and 1833, respectively. Konca et al. (Citation2008) studied the two earthquakes of 12 September 2007. They concluded that earthquakes with Mw 8.4 and Mw 7.9 broke only a small part of the fractured area in 1833 and other patches of megathrust that remained locked in the interseismic period. Konca et al. (Citation2008) suggested that the same megathrust section may rupture in different patterns depending on whether the asperity ruptures as an isolated seismic event or cooperates to produce a more significant rupture. Due to past earthquakes, the variability may arise from the influence of non-permanent resistance zones with lower local pre-stress. The stress state of the Sunda megathrust faults in 1833 and 1797 may not have been sufficient to develop one major fault in 2007. The 2007 release of the seismic moments was only a fraction of those released in 1833, and the accumulated moment deficit was due to interseismic strain since 1833. Potential megathrust events in the Mentawai area are thus still possible (Konca et al., Citation2008).
Many previous studies have shown that b values of GR Law (referred to as b-value henceforth) tend to decrease prior to large earthquakes. For instance, De Santis et al. (Citation2011) analysed the GR Law and Entropy of Earthquakes (Ben-Naim, Citation2008) in two case studies in central Italy. One was the recent seismic sequence in Abruzzi (central Italy; mainshock Mw 6.3, 6 April 2009 in L’Aquila) and the other was an older 1997 sequence (Umbria-Marche, central Italy; mainshock Mw 6.0, 26 September 1997 in Colfiorito). Their work reveals the strong correlation between GR coefficients and the entropy of an earthquake sequence. The most critical finding is that the b-value could be seismologically interpreted as a direct stress metre because it is directly sensitive to the differential stress over the region of concern. The temporal variations of b-values in the epicentre regions show a decreasing trend prior to a large earthquake. The low b-value around the area before a large earthquake can be interpreted as high-strain loading. The result aligned with that of De Santis et al. (Citation2022) in the Kermadec Islands (New Zealand) prior to a large earthquake with M7.2 that occurred on 15 June 2019. Wang et al. (Citation2021) assessed earthquake forecast performance based on the b-value in Yunnan Province, China. The result found moderate – large earthquakes in Yunnan are more likely to occur in the low b-value regions. They tested the forecast performance using the Molchan error diagram (MED), and the efficiency was quantified by probability gain (PG) and probability difference (PD). The MED analysis suggests considerable precursory information in spatial b-values and that the forecast efficiency increases with magnitude. Wang etal. (Citation2021) concluded that the b-value might be useful in the study area’s middle- and long-term earthquake forecasts.
Nuannin et al. (Citation2012) pointed out that there exists a correspondence between the low b-value and the occurrence of large earthquakes; their result showed that large earthquakes occur when b-values decrease before a large earthquake. The phenomenon is clear enough, as they showed in the diagrams for each catalogue data they used. The most critical of their finding (Nuannin et al., Citation2012) shows that about 15 largest earthquakes, Mw ≥ 7, occurred between 2000 and 2010 in the Andaman – Sumatra region; all of these events took place within areas of low b-value and were preceded by significant drops in b-values. The 15 most considerable observed correspondence between low b-value and the occurrence of large earthquakes suggests that b(t) (temporal b-value) has a potential that could be employed for probabilistic seismic hazard and analysis (PSHA) study and seismic mitigation of future earthquake potency (Triyoso & Yuninda, Citation2022; Triyoso et al., Citation2021). Based on Nuannin et al. (Citation2012), the temporal variations revealed significant drops in the b-value, which happened before the time of occurrence of the two large earthquakes (Ms ≥ 7) in 2002 and the Mw = 9.2 event in 2004. The spatial distribution exhibits low b around the epicentres of the 2002 and 2004 events. Some suggestions proposed by other workers are at hand. For example, a decrease in b is interpreted as an increase in stress before a seismic event Scholz (Citation1968); Wyss, Citation1973). Lower b-values can be expected near the hypocentre of future earthquakes. Thus, by using the earthquake catalogue before the significant earthquake events, we most likely could understand the area of the possible earthquake hazard that might happen in the future. However, Marzocchi et al. (Citation2020) noted that it is very easy to be fooled in searching for significant b-value variations through retrospective analyses. The proposed recipe conclusion is related to using the b-value as a precursor. The most important note is that as far as the search for b-value variations is aimed to improve earthquake forecasting, the best strategy to test this scientific hypothesis is through prospective tests (Zechar et al., Citation2010; Schorlemmer et al., Citation2018; Marzocchi, Citation2018).
Fractal analysis can describe the nature of the objects’ geometry (Mandelbrot, Citation1982). Most evidence of space-time phenomena, such as seismicity, can be characterised and interpreted by fractal models using power laws. In the chaos theory, Grassberger and Procaccia (Citation1983) pointed out that the correlation dimension (DC) is a measure of the dimension of the space occupied by a set of random points. It is often referred to as a type of fractal dimension. Based on a two-point correlation dimension (DC), the spatial and temporal distribution patterns of the fault and earthquake seismicity were shown to be fractal (Caneva and Smirnov, Citation2004; Goebell et al., Citation2017; Pailoplee & Choowong, Citation2014; Triyoso et al., Citation2022; Wyss et al., Citation2004; Roy et al., Citation2011). Pailoplee and Choowong (Citation2014) evaluated the a- and b-values of the frequency-magnitude distribution (FMD) and fractal dimension (DC) simultaneously for 13 recognised seismic source zones in mainland Southeast Asia, including northern Sumatra, using a complete earthquake dataset. They found the relationships of DC-b and DC-(a/b) are (DC = 2.80–1.22b) and (DC = 0.27(a/b) −0.01) with similar regression coefficients (R2 = 0.65 and 0.68) for both regressions. Pailoplee and Choowong (Citation2014) pointed out that the Sumatra-Andaman interplate and intraslab, the Andaman Basin, and the Sumatra fault zone were defined as high-tectonic stress regions that may pose risks of generating large earthquakes in the future. Triyoso et al (Citation2021, Citation2022). studied the possible correlation between the two seismotectonic parameters; they are DC and b-value, based on late quaternary active fault and the shallow earthquake data and correlate with the seismic moment rate derived based on the GPS on the island of Sumatra for PSHA. The study could characterise a reasonable correlation between two seismotectonic parameters, DC - b, as follow DC = 2.851 − 1.272b. The most critical finding is that relatively high DC coincides with a high SHF curve and the high seismic moment rate derived from the pre-seismic GPS data. The conclusion is aligned with Pailoplee and Choowong’s (Citation2014) finding. Therefore, it was concluded that the areas with relatively high DC overlap with high seismic moment loading rates, implying high tectonic stress loading that could pose the risk of producing significant earthquake hazards in the future. Triyoso et al. (Citation2021) evaluated the possible area of the potential earthquake hazard around the off-coast of West Sumatra-Bengkulu based on the availability of pre-seismic surface displacement data and the shallow crustal earthquake catalogue data. The result indicated that the possible earthquake hazards could be characterised based on the spatial correlation of SHmax and b-value or correlation dimension (DC).
Triyoso (Citation2023) evaluates the probabilistic seismic hazard function (PSHF) before large earthquake events based on the hypothesis earthquake forecast algorithm using the Akaike information criterion (AIC). The motivation for using the AIC is to understand better the reliability model used to construct the PSHF. The result found that the reliability of the use of b-value (DC) as a function of time and space before large earthquake events that have been used as a seismic precursor could be evaluated. Triyoso (Citation2023) proposed using the δAIC is then introduced as a function of (AICmodel–AICreference) during the observation time. The critical finding is a quantity of δAIC concerning Mw size or class. Therefore, a drastic change in the PSHF is found when δAIC is large enough. Furthermore, as the earthquake potency and PSHF are functions of the b-values (DC), applying the proposed method, we could measure how reliable the b-value (DC) is as the precursor before a large earthquake from the viewpoint of PSHA. The result is suggested to be very beneficial for PSHA and seismic mitigation realisation.
Shamim et al. (Citation2019) studied gravity modelling and stress reconstruction at the Sumatran subduction margin between the Indian-Australian and Asian plates providing insight into the geodynamic and kinematic settings of the area. Based on the gravity model, Shamim et al. (Citation2019) divided the region into two sectors, north and south. Using earthquake data with a magnitude of Mw ≥5.0 and a focal depth ≤100 km for the subducting plate, Shamim et al. (Citation2019) reconstructed the stress regime by performing stress inversion and classifying six zones, namely zone I to zone VI. Álvarez et al. (Citation2021) analysed seismic rupture behaviour along the Sumatra Subduction Zone for the recent large earthquake and its history, and they found that strong slip patches occurred along minima gravity gradient lobes and that the maximum vertical displacements were related quantitatively to the gravity-derived signal. The degree of interseismic coupling also presents an excellent correspondence to the vertical gravity gradient, showing an inverse relationship with low degrees of coupling over relatively high-density regions. Along-strike segmentation of the gravity signal agrees with the along-strike seismic segmentation observed from recent and historical earthquakes.
Konca et al. (Citation2008) pointed out that the potential megathrust events in the Mentawai area are still significant. Thus, the possible remaining earthquake potentiality around the Mentawai area needs to be evaluated more deeply. By referring to the result of Shamim et al. (Citation2019) and Álvarez et al. (Citation2021), and others (Nuannin et al., Citation2012; Pailoplee & Choowong, Citation2014; Triyoso & Yuninda, Citation2022; Triyoso et al., Citation2021), this study intends to characterise the possible remaining large earthquake and tsunami potentiality based on spatial correlation of the maximum shear strain loading rate and the correlation dimension (Triyoso et al., Citation2021) along the Sumatra subduction margin, especially around the coast of West Sumatra-Bengkulu. Therefore, this study’s motivation is to understand better future seismic and tsunami hazards to support mitigation purposes based on integrated data of instrumentally recorded earthquakes, historical catalogue, and geological and GPS data.
2. Data and method
2.1. Data
This study’s earthquake catalogue and geology data are based on the 2017 PuSGeN (The Citation2017; Tim Pusat Studi Gempa Nasional-Citation2017(The 2017 PuSGeN), 2017). PuSGeN is an Indonesian research consortium specialising in geohazard and consists of experts from government institutions, academic universities, and the private sector. The selected area is around the south coast of Sumatra Island, with the selected data based on earthquakes with magnitudes of Mw ≥4.7 and a maximum depth of 50 km from 1963 to 2016. In addition, the historical catalogue provided the data of the selected Mw ≥7.5 earthquake events from 1907 to 2010 (The 2017 Tim Pusat Studi Gempa Nasional-Citation2017(The 2017 PuSGeN), 2017) along the Sumatran subduction zone. The pre-seismic surface displacement data is based on displacement or GPS data before and the corrected displacement data after large earthquakes. The GPS data prior to the large earthquakes are based on Triyoso et al. (Citation2020) study, and those after the large earthquakes are retrieved from Yusfania et al. (Citation2014), Khaerani et al. (Citation2018), Triyoso et al. (Citation2022), and Triyoso’s (Citation2023) studies. The geological data used in this study refers to Triyoso et al. (Citation2020) study, in which adjustment and the fault geometry are based on the modified and simplified result of Natawidjaja et al. (Citation2006) and Konca et al. (Citation2008) that was obtained using a rectangular fault model. According to the fault dip and rake model, especially for the southern geometry of the subduction zone, in the case of co-seismic, there is about 20° dip and about 98° rake, and in the case of pre-seismic, there is about 278° rake (Shamim et al., Citation2019). shows the distribution of shallow earthquakes with depths less than 50 km during 1963–2016 (The 2017 Tim Pusat Studi Gempa Nasional-Citation2017(The 2017 PuSGeN), 2017) and the pre-seismic GPS data based on Triyoso et al (Citation2020, Citation2021, Citation2022). and Triyoso’s (Citation2023) studies and also the zones (I – VI) of Shamim et al. (Citation2019). shows the bathymetry data used in the tsunami simulation provided by the General Bathymetric Charts of the Oceans (The GEBCO version 11.1, September 2008) and the digitised Nautical Chart of the Centre for Hydrographic Office (Pushidrosal) Indonesian Navy. The data are originally gridded on 1’arc (~1854 m) and have been resampled at 30’’ (~927) spatial resolution.
2.2. The b-value
The b-value of the Gutenberg-Richter Equation (Gutenberg & Richter, Citation1944) is an essential statistical parameter and is related to the possible size of the scaling properties of seismicity. At a global scale, overall, the b-value usually is more stable around ~1, and on a regional scale, it can oscillate more (DeSalvio & Rudolph, Citation2021; Frohlich & Davis, Citation1993). The maximum likelihood is the most robust method for calculating the b-value (Aki, Citation1965). Following Utsu (Citation1978), the formula to estimate the b-value can be written as follows:
where is the average magnitude value greater or equal to Mc, and Mc is the minimum or magnitude completeness. The 0.05 in EquationEquation (1)
(1)
(1) is a correction constant. Nuannin et al. (Citation2012) analysed a resolution map related to the b-value estimation based on the seismic patterns along the Sumatran subduction zone. To evaluate the variation of the b-value, Nuannin et al. (Citation2012) used the 15 largest earthquakes, Mw ≥7, that had occurred between 2000 and 2010 in the Andaman – Sumatra region. The available USGS list of events used is complete for a threshold magnitude Mc = 4.5 and contains 6973 shocks. About 15 shocks that had magnitudes equal to or larger than 7.0 were used in the study, and it can be noted that the events in the central part, around 3°N, were removed. With two exceptions, these are shallow events. One event is an intermediate-focus earthquake, and the other is a deep-focus earthquake. The spatial distribution of b is estimated using the maximum likelihood method. The resolution result varies within a wide range between tens of kilometres to more than 200 km depending on the geographical distribution of epicentres. Following the resolution map of Nuannin et al. (Citation2012) for the examined b-value around the Sumatra subduction zone, the constant radius of 100 km is used in this study. The reason for choosing a 100 km radius is to represent the mean radius based on the analysis of the study results from Nuannin et al. (Citation2012).
2.3. Correlation dimension (DC)
The correlation dimension is a powerful tool to quantify the geometrical object of self-similarity (Grassberger & Procaccia, Citation1983), in which DC and the correlation sum C(r) are estimated as follows:
C(r) is the correlation function, and r is the distance between two epicentres. The earthquake epicentre distribution has a fractal structure, and the following relationship would be obtained (Pailoplee & Choowong, Citation2014; Triyoso et al., Citation2022):
In which N is the number of pairs of events separated by distance R < r.
DC is the correlation dimension, and r is the distance between two earthquakes in degrees. The spatial and temporal distribution patterns of earthquake seismicity were fractal using a two-point correlation dimension (DC). Following the result of the DC in mainland Southeast Asia especially off the Northern Coast and Northern mainland of Sumatra (Pailoplee & Choowong, Citation2014) and the DC on Sumatra Island (Triyoso et al., Citation2022), in this study, DC is evaluated based on the mean value of the following relationship:
And
DC is the Correlation Dimension, and b is the b-values of the Gutenberg-Richter Equation (Gutenberg & Richter, Citation1944).
Referring to Goebell et al. (Citation2017) and others (Caneva and Smirnov, Citation2004; Wyss et al., Citation2004; Roy et al., Citation2011), the lower b-values and high DC are associated with a low degree of heterogeneity of the fractured medium, a large amount of stress or strain, a high degree of deformation rates, large faults, and thus, a high degree of the maximum shear strain or seismic moment. Therefore, they could be interpreted as regions subjected to higher applied shear stress after the mainshock. The areas with higher b-values are often found in the areas that have experienced slip and those with increased geological complexity and multi-fracture. In our case, the b-value range is about 0.7 to 1.4, and that of DC is 1.1 to 2.0.
2.4. Geodetic modeling: SHmax rate estimation
This study makes the basic assumptions in the geodetic modelling data. First, the horizontal displacement field of each observation point over the entire seismogenic depth is assumed to be homogeneous and isotropic. Second, the horizontal displacement in E-W and N-S direction components that u and v denote is supposed to be uncorrelated (El-Fiky et al., Citation1999). Third, the study area was gridded into 10 km × 10 km cell sizes. Each cell’s horizontal displacement rate was estimated based on the previous studies’ procedures (Ward, Citation1998; Triyoso & Sahara, Citation2021; Triyoso & Suwondo, Citation2022; Triyoso et al., Citation2020, Citation2022). We then calculated each cell’s horizontal crustal strain rate using the input of the displacement rate model. Finally, the horizontal crustal strain was used as the input to estimate the maximum shear strain over the entire study area. Following El-Fiky et al. (Citation1999) and Triyoso’s (Citation2023) studies, the formula used in this study to calculate the maximum shear strain (SHmax) is as follows:
where SHmax is the maximum shear strain, and ɛij is the strain component.
2.5. Stress reconstruction
The stress reconstruction is based on the result of Shamim et al. (Citation2019), in which the stress inversion method was applied to the data of the pre-earthquake and post-earthquake phases of the Sumatra earthquake of December 2004. About six zones under pre-and post-December 2004 phases concerning the incidence of Mw 9.2 off the Sumatra mega-earthquake of 2004 are used in this study.
3. Seismic hazard function and PGA estimation based on the maximum possible earthquake (MPE) magnitude
3.1. Seismicity rate modelling: potential source area and rate formulation
Triyoso (Citation2023) modified the seismicity rate model of Triyoso et al. (Citation2020) and proposed that the potential earthquake occurrence rate above or equal to magnitude completeness as a reference (Mc) in the particular grid i is modelled by using the uniform background seismicity rate (Abackground) weighted by the normalised maximum shear strain rate (SHmax-rate). Since the primary purpose of this study is to anticipate the possible future earthquake potentiality, we follow Triyoso’s (Citation2023) research, in which the seismicity rate model used the following formulation:
Where Abackground is the uniform background seismicity with magnitude ≥ Mc in grid i, the SHmax-rate is the maximum shear strain rate estimated at the grid of i, and the maximum (SHmax-rate) is the maximum value of the SHmax-rate over the entire study area. vi represents the likelihood estimation of the 10a or seismicity rate with a magnitude greater than or equal to Mc.
Furthermore, by substituting 10a of EquationEquation (8)(8)
(8) in the Frequency-Magnitude of the Gutenberg–Richter equation (Gutenberg & Richter, Citation1944), we may write the following equation:
where ASHmax-rate is the estimated seismicity rate above or equal to magnitude completeness (Mc) and b is the b-value.
3.2. Seismic hazard function (SHF) estimation: Ground Motion Prediction Equation (GMPE) and Probability Exceedance (PE)
The Seismic Hazard Function is the cross plot between the Probability of Exceedance (PE) vs. Peak Ground Acceleration (PGA). The PE formulation of the annual earthquake rate with a magnitude greater than or equal to magnitude completeness, which is the estimated maximum ground acceleration denoted by a, is calculated using GMPE at an observation point due to the earthquake source on the grid l and can be written as:
in which Pl (m ≥ m (ao, Rl)) is the annual PE of earthquakes in the lth grid or cell, m(ao, Rl) is the magnitude in the lth source grid that would produce a PGA estimated of ao or larger at the site, and Rl is the distance between the site and the source grid. The depth of the seismogenic zone is a critical parameter for earthquake hazard models. The starting seismogenic depth (locking depth) and seismogenic thickness in the study area are about 3–5 km, with a seismogenic thickness is about 20 km (The 2017 Tim Pusat Studi Gempa Nasional-Citation2017(The 2017 PuSGeN), 2017). Following Triyoso et al. (Citation2020), Triyoso and Sahara’s (Citation2021), and Triyoso and Suwondo’s (Citation2022) studies, the SHF parameter calculation is based on the starting locking depth of 3 km with a seismogenic thickness of 20 km. The function m(ao, Rl) is the GMPE relation. The following equation was used to determine the total PE distribution of PGA at the site:
Thus, by substituting the GMPE in (10), we could calculate the annual PE of the particular PGA as follows:
For a given specified time of observation of T, the PE could be calculated as follows:
The annual PE of each grid or cell of specified ground motion is calculated using (12). For a time duration of T, the PE of specified ground motions is computed using EquationEquation (13)(13)
(13) .
3.3. PGA estimation based on the Maximum Possible Earthquake (MPE) magnitude
The characterised source area resulting in this study is used to estimate the PGA based on the MPE magnitude using the recommended GMPE – based on Atkinson and Boore’s (Citation2006), Youngs et al. (Citation1997), and Zhao et al. (Citation2006) studies – by Tim Pusat Studi Gempa Nasional-(Citation2017) (The 2017 PuSGeN), 2017 for the case of the megathrust source. Even though by referring to the recommendation results of Triyoso and Suwondo (Citation2022) and based on our present knowledge, the GMPE of Zhao et al.’s (2006) research tends to fit better, especially for Sumatra data, we estimate the mean PGA based on the MPE magnitude in this study using the GMPE recommended by Tim Pusat Studi Gempa Nasional-(Citation2017) (The 2017 PuSGeN), 2017. The MPE magnitude is based on the megathrust source model, which is based on the cross-correlation of DC and the SHmax-rate. The fault geometry and the simplified result of Natawidjaja et al. (Citation2006), Konca et al. (Citation2008), and Triyoso et al. (Citation2020) studies are modified with a rectangular fault model. The fault dip and rake are based on the result of the Shamim et al. (Citation2019) model of the southern geometry of the subduction zone. There are about 20° dip and 98° rake in the case of co-seismic and 278° rake in the case of pre-seismic.
4. Tsunami modeling
In this study, to simulate the tsunami of the possible sources, the COMCOT (Cornell Multi-grid Coupled Tsunami Model) version 1.7 developed by Xiaoming Wang at the Institute of Geological & Nuclear Science, New Zealand (Wang, Citation2009) and the TUNAMI N3 of Tohoku University, Japan (Imamura et al., Citation2006) are used. The potentiality of the earthquake and the tsunami source zone is characterised based on the cross-correlation of DC and the SHmax-rate. The geometry fault parameter in this study refers to the result of previous research (Borrero et al., Citation2007; Konca et al., Citation2008; Natawidjaja et al., Citation2006; Shamim et al., Citation2019). The possible potentiality of the co-seismic slip, which is about 8 metres, is based on the maximum slip model of Natawidjaja et al. (Citation2006) and Borrero et al. (Citation2007) studies. The Mw is estimated based on seismic moment summation of the proposed fault model usingHanks and Kanamori (Citation1979). The complete source parameters are listed in .
Table 1. The complete source parameter used in this study for tsunami simulation.
5. Results and discussion
The motivation of this study is to characterise the possible remaining significant earthquake potentiality around the Sumatran subduction zone, especially around the Mentawai; as Konca et al. (Citation2008) pointed out that the potency of the megathrust earthquake events in the Mentawai area is still significant. Therefore, the purpose is to estimate the Probabilistic Seismic Hazard Function (PSHF), PGA estimation based on the Maximum Possible Earthquake (MPE), and Tsunami Height simulation to realise the possible hazard to support mitigation purposes based on integrated data of instrumentally recorded earthquake, historical catalogue, and the geological and GPS data of the probable remaining large earthquake and tsunami potency based on spatial correlation of the maximum shear strain loading rate and the correlation dimension (Triyoso et al., Citation2021) along the Sumatra subduction margin, especially around the coast of West Sumatra-Bengkulu. To discover the possible remaining earthquake potency, we refer to the method and the result of Shamim et al. (Citation2019) and Álvarez et al. (Citation2021), and others (Nuannin et al., Citation2012; Pailoplee & Choowong, Citation2014; Triyoso & Yuninda, Citation2022; Triyoso et al., Citation2021). The method to characterise the possible remaining large earthquake and tsunami potency along the Sumatra subduction margin, especially around the coast of West Sumatra-Bengkulu, is based on the spatial correlation of the maximum shear strain loading rate and the correlation dimension (Triyoso et al., Citation2021). The estimated strain rate based on the pre-seismic GPS data is obtained after removing the effect of the series of sizeable earthquake events with a magnitude larger than or equal to 7.0. The data of this study was obtained by referring to the works of Triyoso et al. (Citation2022) and Triyoso (Citation2023).
Following Pailoplee and Choowong’s (Citation2014), Triyoso et al. (Citation2022), and Nuannin et al. (Citation2012) studies, the correlation dimension (DC) is estimated based on the mean of EquationEquations (5)(5)
(5) and (Equation6
(6)
(6) ), in which the b-value in each grid or cell is calculated based on the constant radius of 100 km with the number of the event being at least 50. The reason for selecting 50 occurrence events relies on the results by Triyoso and Yuninda (Citation2022). To enhance the contrast of characterising the relatively high and low DC, we then constructed the map of DC subtracted by the mean of DC over the entire area (δDC = DC – mean (DC)). First, the δDC (DC – mean (DC)) is calculated based on the b-value from 1963 to 1999.
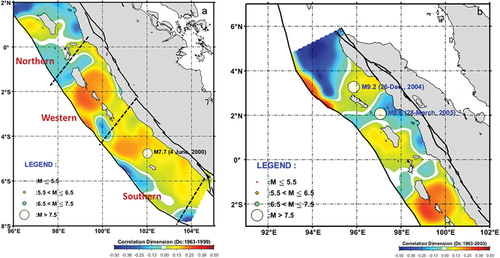
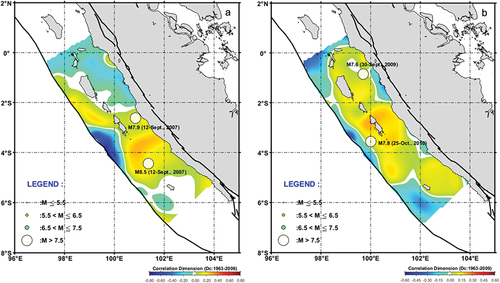
shows the result of DC from 1963 to 1999. It appears that relatively high DC (positive δDC) characterises the area around M7.7 of the 2000 earthquake. Therefore, based on , the DC map could reasonably describe high-strain loading around the southern part of the Sumatra subduction zone. Second, the δDC is estimated based on the b-value of 1963 to 2003 as well as 1963 to 2004, 1963 to 2006, and 1963 to August 2009. shows the result of DC from 1963 to 2003. Based on , relatively high DC (positive δDC) characterises the area around M9.2 of the 26 December 2004, event. Like the phenomenon shown in , the DC map () could also reasonably describe high-strain loading around the northern part of the Sumatra subduction zone. The M8.6 of March 2005 coincides with a relatively low value of DC.
Figure 2. The result of DC from 1963 to 1999 (a). The result of DC from 1963 to 2003 (b). It appears that relatively high DC (positive δDC) characterises the area around M7.7 of the 2000 event. Therefore, based on (A), the DC map could reasonably describe high-strain loading around the southern part of the Sumatra subduction zone. Likewise, the DC map (B) could also reasonably describe high-strain loading around the northern part of the Sumatra subduction zone.
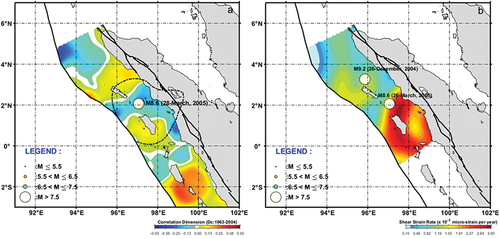
shows the result of DC from 1963 to 2004 in northern Sumatra. shows the maximum shear strain rate estimated based on pre-seismic GPS data (Triyoso et al., Citation2020). shows that DC around the area before M8.6 of March 2005 is close to the mean value of Dc. To understand the phenomenon better, we estimate the maximum shear strain rate (SHmax-rate), as shown in , using the pre-seismic GPS data of Triyoso et al. (Citation2020). The area around M8.6 of March 2005 shows a high SHmax-rate. Triyoso and Sahara (Citation2021) support Pollitz et al.’s (2005) suggestion that this area is interpreted as a closed-to-mature place where the effect of stress transfer of M9.2 affect the time advance of the M8.6 event to rupture. show that high DC and strain loading rates coincide, which supports the previous finding of Triyoso et al (Citation2021, Citation2022).
Figure 3. The result of DC from 1963 to 2004 in northern Sumatra (a). The boundary (black) shows the area of M8.6; refer to Triyoso and Sahara (Citation2021). The maximum shear strain rate is estimated based on the pre-seismic GPS data (b). The DC around the area before M8.6 of March 2005 is close to the mean value of Dc. To understand the phenomenon better, we estimate the maximum shear strain rate (SHmax-rate), as shown in (B), using the pre-seismic GPS data of Triyoso et al. (Citation2020). The area around M8.6 of March 2005 shows a high SHmax-rate. Triyoso and Sahara (Citation2021) support Pollitz et al’.s (2005) suggestion that this area is interpreted as a closed-to-mature place where the effect of stress transfer of M9.2 affect the time advance of the M8.6 event to rupture.
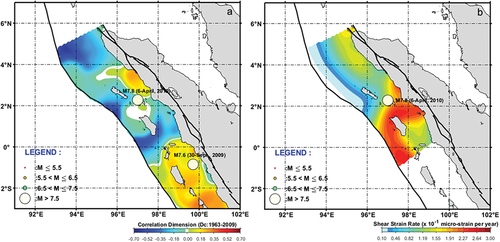
shows the result of DC from 1963 to 2009 in northern Sumatra. shows the maximum shear strain rate estimated using pre-seismic GPS data in which earthquakes are removed from the effects of 26 December 2004, and 28 March 2005 (Triyoso & Sahara, Citation2021). The DC around the area before M7.8 of April 2010 is close to its mean value of Dc. Therefore, following the previous study comparing the result of , it is suggested that stress accumulation around the area indicated by Triyoso and Sahara (Citation2021) is partially ruptured and followed by M7.8.
Figure 4. The result of DC from 1963 to 2009 in northern Sumatra (a). The maximum shear strain rate is estimated based on the pre-seismic GPS data in which the effect of December 26, 2004, and March 28, 2005 earthquakes are removed (b). The DC around the area before M7.8 of April 2010 is close to the mean value of Dc. Following the previous study by comparing the result of (B), it is suggested that stress accumulation around the area indicated by Triyoso and Sahara (Citation2021) is ruptured partially and followed by M7.8.
show the result of DC from 1963 to 2006 and from 1963 to August 2009 in southern Sumatra. Both results show that relatively high DC (positive δDC) characterises the area around M8.5 and M7.9 of the 12 September 2007 events and the M7.6 on 30 September 2009, and M7.8 on 25 October 2010. The cross-correlation result of and the estimated SHmax shows a better correlation with the area of the 1797 subduction earthquake event (Natawidjaja et al., Citation2006) and the result of the stress reconstruction of zone IV (Shamim et al., Citation2019). It suggested that the finding could be used to characterise the possible future earthquake or tsunami potency source.
Figure 5. The result of DC was from 1963 to 2006 (a) and from 1963 to August 2009 (b) in southern Sumatra. Both results show that relatively high DC (positive δDC) characterises the area around M8.5 and M7.9 of the September 12, 2007 events and the M7.6 on September 30, 2009, and M7.8 on October 25, 2010.
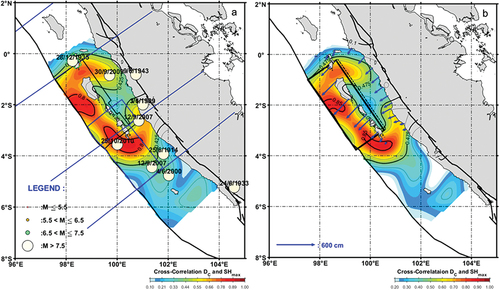
shows the cross-correlation of DC and the SHmax-rate overlaid with the historical earthquake and fault model of the 1797 and 1833 megathrust events of M8.8 and M9.0 (Natawidjaja et al., Citation2006). Following the finding of Konca et al. (Citation2008), we then adjust the fault parameter model by referring to the 1797 fault model to estimate possible seismic and tsunami hazards. shows our adjustment fault parameter model and simulation of the forward model (Okada, Citation1985; Okada, Citation1992) co-seismic surface displacement with a slip of about 8 metres. The possible co-seismic slip is based on the maximum slip model in Natawidjaja et al. (Citation2006) and Borrero et al. (Citation2007). Other fault parameters, such as dip and rake, are based on the result of Shamim et al. (Citation2019). The model of the southern geometry of the subduction zone is used to determine fault dip, and the possible rake is based on the outcome of stress inversion of zone IV of post-December 2004 (Shamim et al., Citation2019). Thus, based on , we could identify the potential seismic gap area of the potential seismic and tsunami hazard source in the future. The likely potential source area shows a high correlation between the high DC and the present-day strain loading, the historical earthquake, and possible source zonation based on the previous stress reconstruction.
Figure 6. The cross-correlation of DC and the SHmax-rate (a). This overlaid with the historical earthquake and fault model of the 1797 and 1833 megathrust events (Natawidjaja et al., Citation2006). Following the finding of Konca et al. (Citation2008), we adjust the fault parameter model by referring to the 1797 fault model to estimate possible seismic and tsunami hazards. The fault parameter model and simulation of the forward model (Okada, 1985; Okada, Citation1992) co-seismic surface displacement with the slip of about 8 metres (b). The possible co-seismic slip is based on the maximum slip model in Natawidjaja et al. (Citation2006) and Borrero et al. (Citation2007). Other fault parameters, such as dip and rake, are based on the result of Shamim et al. (Citation2019).
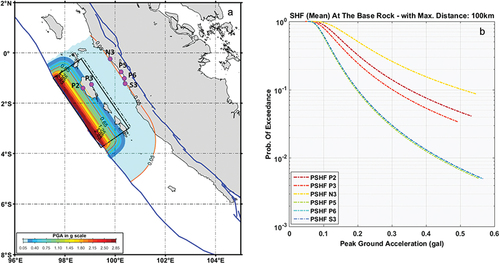
shows the estimated seismic hazard expressed as the Peak Ground Acceleration (g) at the base rock based on the defined fault parameter in this study. The estimated mean PGA is calculated based on the MPE magnitude using the GMPEs recommended by Tim Pusat Studi Gempa Nasional-(Citation2017) (The 2017 PuSGeN), 2017. The possible high ground shaking of about ~0.65 g at the base rock at P2 and P3 is about 0.25 g. The observation points of N3, P5, P6, and S3 are about 0.05 g. estimates the selected sites’ (P2, P3, N3, P5, P6, and S3) Probabilistic Seismic Hazard Function (PSHF). The PSHF curve estimates the total probability of an exceedance value of 10% of earthquake events in 50 years versus the mean PGA values. Following Triyoso et al. (Citation2020), Triyoso and Sahara’s (Citation2021), and Triyoso and Suwondo’s (Citation2022) works, in this study’s probabilistic seismic hazard calculation, the maximum radius distance of about 100 km is used with a magnitude range of 6.0–9.0. The estimated PSHF curve of the total probability of an exceedance value of 10% of earthquake events in 50 years versus the PGA values calculated at P2, P3, N3, P5, P6, and S3 is 0.2 g to 0.5 g. The N3 is the highest PSHF among the six selected observation points in which the estimated PGA of 10% PE is about 0.5 g. The tsunami modelling results from the proposed tsunamigenic area show that the maximum tsunami height along the coastline occurred perpendicular to the source region along the west coast of West Sumatera and the offshore island of Siberut. The mean PGA of 10% PE of this study is then compared with the PGA estimated by the 2017 PuSGen (Tim Pusat Studi Gempa Nasional-Citation2017The 2017 PuSGeN, 2017). The result shows that the mean PGA estimated in this study is almost comparable and tends to be slightly lower than the 2017 PuSGeN (Tim Pusat Studi Gempa Nasional-Citation2017The 2017 PuSGeN, 2017). This is because the 2017 PuSGeN (Tim Pusat Studi Gempa Nasional-Citation2017The 2017 PuSGeN, 2017) used multi-sources to estimate the PGA of 10% PE in 50 years.
Figure 7. The estimated seismic hazard is expressed as the Peak ground Acceleration (g) at the base rock based on the defined fault parameter in this study (a). The possible high ground shaking of about ~0.65 g at the base rock at P2 and P3 is about 0.25 g. The observation points of N3, P5, P6, and S3 are about 0.05 g. The selected sites’ (P2, P3, N3, P5, P6, and S3) probabilistic seismic hazard function (PSHF) estimated (b). The PSHF curve of the total probability of an exceedance value of 10% of earthquake events in 50 years versus the PGA values is estimated. Following Triyoso et al. (Citation2020), Triyoso and Sahara’s (Citation2021), and Triyoso and Suwondo’s (Citation2022) studies, in this study’s probabilistic seismic hazard calculation, the maximum radius distance of about 100 km is used with a magnitude range of 6.0–9.0. N3 shows the highest PSHF among the six selected observation points.
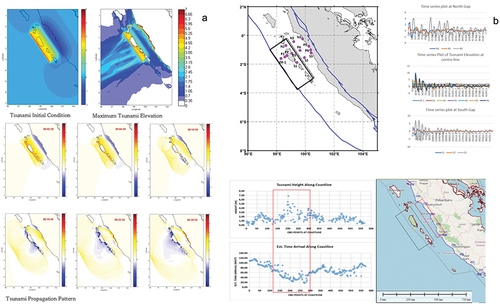
The tsunami propagation pattern shows how the tsunami impacted the offshore island and west coast of West Sumatra (). The tsunami generated offshore propagated to the west coast of West Sumatera through the gap between Siberut and Banyak Island in the north and between Siberut and Sipora to the south. In contrast, the tsunami generated inside the basin between Siberut and the mainland directly impacted the West Coast of Sumatra. The arrival time of a tsunami at the offshore island is less than 3 minutes, with a maximum tsunami elevation of 5.0 m. While on the West Coast of Sumatera Island, perpendicular to the source region, the tsunami reaches up to 10 m between 19 and 30 minutes. The offshore island experienced an uplift between 0.5 and 3.0 m, while on the mainland along the west coast of West Sumatra, a subsidence of up to −1.0 m occurred. The time series and scatter plot of the tsunami along the west coast of Sumatra () show that the area perpendicular to the source region had the highest tsunami elevation with a shorter arrival time. In this case, the tsunami arrival time is between 19 and 30 minutes with height ranges between 4 and 7 m, except inside Teluk Bayur, which reaches up to 10 m, as shown on the time series plot.
Figure 8. The initial condition and maximum tsunami height distribution show that the most affected areas are perpendicular to the source region (a). For example, the tsunami affecting the west coast of West Sumatra is coming from the offshore gap between Siberut and Banyak island and between Siberut and Sipora island, as well as a tsunami generated inside the basin Siberut and the main island of Sumatera. The time series and the scatter plot of tsunami height and arrival time along the coastline (b). It shows the areas perpendicular to the source region that had the highest tsunami height and shortest arrival time. The red rectangle in the left figure (b) and the right figure show the areas perpendicular to the source region (black rectangles in the right figure).
6. Conclusions
Based on the result of this study, we can identify the possible source area of potential earthquake hazards or seismic gaps and tsunami hazards. The possible future potency of the source area is characterised by the cross-correlation between relatively high DC (positive δDC) and the estimated SHmax-rate. When we overlaid it with the historically large earthquake data from 1907 to 2010, it most likely coincides with the 1797 subduction earthquake event (Natawidjaja et al., Citation2006). Therefore, this study could better support our critical finding that the areas with relatively high DC coincide with high seismic strain rates and, thus, seismic moment loading rates. Therefore, it likely implies that high tectonic stress loading could pose the risk of producing significant earthquake hazards in the future. The advantage of this study is that we could understand the correlation between the high DC with the possible present-day strain loading since we incorporate the present-day shallow crustal dynamic data.
This study estimates the annual seismicity rate model around possible future earthquake and tsunami hazards for mitigation purposes based on the uniform background seismicity rate of the magnitude ≥ Mc weighted by the normalised maximum shear strain rate calculated at the grid over the entire study area.
The result of the mean of the PGA estimated based on the MPE magnitude using the three GMPEs recommended by Tim Pusat Studi Gempa Nasional-(Citation2017) (The 2017 PuSGeN), 2017 shows that the possible high ground shaking of about ~0.65 g at the base rock at P2 and P3 is about 0.25 g. The observation points of N3, P5, P6, and S3 are about 0.05 g. The estimated PSHF curve of the total probability of an exceedance value of 10% of earthquake events in 50 years versus the PGA values calculated at P2, P3, N3, P5, P6, and S3 is 0.2 g to 0.5 g. The N3 is the highest PSHF among the six selected observation points in which the estimated PGA of 10% PE is about 0.5 g. The comparison of the mean PGA of 10% PE of this study with the PGA estimated by the 2017 PuSGen (Tim Pusat Studi Gempa Nasional-Citation2017The 2017 PuSGeN, 2017) shows that the mean PGA estimated in this study is almost comparable and tends to be slightly lower than the 2017 PuSGeN (The 2017 PuSGeN, 2017). This is because the 2017 PuSGeN (The 2017 PuSGeN, 2017) used multi-sources to estimate the PGA of 10% PE in 50 years.
The tsunami modelling results based on the proposed tsunamigenic area in this study show that we can characterise the maximum tsunami height along the coastline likely to occur at the location perpendicular to the source region along the west coast of West Sumatera and the offshore island of Siberut. The tsunami height distribution varies between 4.0 and 10 m facing the source region along the west coast of Sumatra, with arrival times between 19 and 30 minutes. While at the offshore island, the tsunami reaches up to 5.0 m with an arrival time of less than 3 minutes. We suggest that the result of this study could be beneficial to understand better the potential seismic and tsunami hazard in the future, mainly to support mitigation purposes.
Author Contributions
WT developed the main idea and algorithm and analysed and prepared the figures and the manuscript. WK and GSP helped in tsunami modelling and analysis and drafted the manuscript in the Tsunami Modelling section. DAS helped to collect the GPS data based on several manuscripts. All authors contributed to the preparation of the manuscript.
Acknowledgments
The authors thank the Global Geophysics Group, the Faculty of Mining and Petroleum Engineering, and the Bandung Institute of Technology for their support in producing this paper. The authors also thank several anonymous reviewers for their suggestions and valuable comments.
Disclosure statement
The author(s) declare that the research was conducted without any commercial or financial relationships construed as a potential conflict of interest.
Data availability statement
The earthquake data utilised in this study is based on Public Domain Data from The 2017 PusGen (The 2017 PusGen, 2017). The selected data used is based on the magnitude of Mw ≥4.7 with a maximum depth of 50 km from 1963 to 2016. In addition, the historical catalogue is based on selected Mw ≥7.5 earthquake events from 1907 to 2010 (The 2017 PusGen, 2017) along the Sumatran subduction zone. The GPS data are based on Yusfania et al. (Citation2014), Khaerani et al.’s (2018), Triyoso et al. (Citation2020), Triyoso and Sahara’s (Citation2021), Triyoso et al. (Citation2021) and Triyoso et al. (Citation2022) studies. The geological data are based on Natawidjaja et al.’s (2004) and Konca et al. (Citation2008) works. The result of the six domains (zones I-VI) is based on Shamim et al. (Citation2019) research.
Additional information
Funding
References
- Aki, K. (1965). Maximum likelihood estimate of b in the formula log N = a bM and its confidence limits-. Bulletin of the Earthquake Research Institute, University of Tokyo, 43, 237–239.
- Álvarez, O., Pechuan Canet, S., Gimenez, M., & Folguera, A. (2021). Megathrust slip Behavior for great earthquakes along the Sumatra- Andaman subduction zone Mapped from Satellite GOCE gravity Field Derivatives. Frontiers in Earth Science, 8, 581396. https://doi.org/10.3389/feart.2020.581396
- Atkinson, G. M., & Boore, D. M. (2006). Earthquake ground-motion prediction equations for Eastern north America. Bulletin of the Seismological Society of America, 96(6), 2181–2205. https://doi.org/10.1785/0120050245
- Ben-Naim, A. (2008). A Farewell of Entropy: Statistical Thermodynamics Based on Information. New Jersey: World Scientific.
- Borrero, J. C., Sieh, K., Chlieh, M., & Synolakis, C. E. (2007) Tsunami inundation modeling for western Sumatra. Proceedings of the National Academy of Sciences, January 2006. https://doi.org/10.1073/pnas.0604069103. Source: PubMed.
- Bradley, K. E., Feng, L., Hill, E. M., Natawidjaja, D. H., & Sieh, K. (2017). Implications of the diffuse deformation of the Indian Ocean lithosphere for slip partitioning of oblique plate convergence in Sumatra. Journal of Geophysical Research: Solid Earth, 122(1), 572–591. https://doi.org/10.1002/2016JB013549
- Caneva, A., & Smirnov, V. (2004). Using the Fractal Dimension of Earthquake Distributions and Slope of the Recurrence Curve to Forecast Earthquakes in Colombia. Earth Sciences Research Journal, 8, 3–9.
- DeSalvio, N. D., & Rudolph, M. L. (2021). A Retrospective analysis of b -value changes Preceding strong earthquakes. Seismological Research Letters, 93(1), 364–375. https://doi.org/10.1785/0220210149
- De Santis, A., Cianchini, G., Favali, P., Beranzoli, L., & Boschi, E. (2011). The Gutenberg–Richter Law and Entropy of Earthquakes Two Case Studies in Central Italy. Bulletin of the Seismological Society of America, 101(3), 1386–1395. https://doi.org/10.1785/0120090390
- El-Fiky, G. S. A., Kato, T., & Oware, E. N. (1999). Crustal deformation and interplate coupling in the Shikoku district, Japan, as seen from continuous GPS observation. Tectonophysics, 314(1999), 387–399. https://doi.org/10.1016/S0040-1951(99)00226-7
- Fitch, T. J. (1972). Plate convergence, transcurrent faults, and internal deformation adjacent to southeast Asia and the western Pacific. Journal of Geophysical Research, 77(23), 4432–4460. https://doi.org/10.1029/JB077i023p04432
- Frohlich, C., & Davis, S. (1993). Teleseismic b-values: Or, much ado about 1.0-. Journal of Geophysical Research, 98(B1), 631–644. https://doi.org/10.1029/92JB01891
- The General Bathymetric Charts of the Oceans: The GEBCO version 11.1, September 2008. (2008) GEBCO website. [Online]. https://www.gebco.net/
- Goebell, T. H. W., Kwiatek, G., Becker, T. W., Brodsky, E. E., & Dresen, G. (2017). What allows seismic events to grow big? Insights from b-value and fault roughness analysis in laboratory stick-slip. Geology, 45(9), 815–818. https://doi.org/10.1130/G39147.1
- Grassberger, P., & Procaccia, I. (1983). Measuring the strangeness of strange attractors. Physica D Nonlinear Phenomena, 9(1–2), 189–208. https://doi.org/10.1016/0167-2789(83)90298-1
- Gutenberg, B., & Richter, C. F. (1944). Frequency of earthquake in California. Bulletin of the Seismological Society of America, 34(4), 185–188. https://doi.org/10.1785/BSSA0340040185
- Hanks, T. C., & Kanamori, H. (1979). A moment magnitude scale. Journal of Geophysical Research, 84(5), 2348–2350, 9B0059. https://doi.org/10.1029/JB084iB05p02348
- Imamura, F., Yalciner, A. C., & Ozyurt, G. (2006). Tsunami modelling manual (TUNAMI model) ( Revision due on APRIL 2006). Disaster Control Research Center, Tohoku University.
- Jarrard, R. D. (1986). Terrane motion by strike-slip faulting of forearc slivers. Geology, 14(9), 780–783. https://doi.org/10.1130/0091-7613(1986)14<780:TMBSFO>2.0.CO;2
- Khaerani, D., Meilano, I., Sarsito, D. A., & Susilo, D. Deformation of West Sumatra due to the 2016 earthquake (M7.8) based on Continuous GPS data. In Proceedings of the 2018 IEEE Asia-Pacific Conference on Geoscience, Electronics and Remote Sensing Technology (AGERS), Jakarta, Indonesia, 18–19 September. 2018.
- Konca, A. O., Avouac, J. P., Sladen, A., Meltzner, A. J., Sieh, K., Fang, P., Li, Z., Galetzka, J., Chlieh, M., & Natawidjaja, D. H. (2008). Partial rupture of a locked patch of the Sumatra megathrust during the 2007 earthquake sequence. Nature, 456(7222), 631–635. https://doi.org/10.1038/nature07572
- Mandelbrot, B. B. (1982). The Fractal Geometry of Nature. San Francisco, CA, USA: Freeman Press.
- Marzocchi, W. (2018). Predictive seismology, Seismol. Res. Lett, 89, 1998–2000.
- Marzocchi, W., Spassiani, I., Stallone, A., & Taroni, M. (2020). Erratum to How to be fooled searching for significant variations of the b-value. Geophysical Journal International, 221(1), 351. doi:10.1093/gji/ggaa061
- McClosky, J., Nalbant, S., & Steacy, S. (2005). Indonesian earthquake: Earthquake risk from co-seismic stress. Nature, 434(7031), 291. https://doi.org/10.1038/434291a
- Megawati, K., & Pan, T. (2009). Regional seismic hazard posed by the mentawai segment of the sumatran megathrust. Bull. Seismol. Soc. Am, 99, 566–584. https://doi.org/10.1785/012008010
- Natawidjaja, D. H., Sieh, K., Chlieh, M., Galetzka, J., Suwargadi, B. W., Cheng, H., Edwards, R. L., Avouac, J. P., & Ward, S. N. (2006). Source parameters of the great Sumatran megathrust earthquakes of 1797 and 1833 inferred from coral microatolls. Journal of Geophysical Research, 111(B6), https://doi.org/10.1029/2005JB004025
- Nuannin, P., Kulhánek, O., & Persson, L. (2012). Variations of b-values preceding large earthquakes in the Andaman–Sumatra subduction zone. Journal of Asian Earth Sciences, 61(2012), 237–242. https://doi.org/10.1016/j.jseaes.2012.10.013
- Okada, Y. (1985). Surface deformation due to shear and tensile faults in a halfspace. Bulletin of the Seismological Society of America, 75(4), 1135–1154. https://doi.org/10.1785/BSSA0750041135
- Okada, Y. (1992). Internal deformation due to shear and tensile faults in a half-space. Bulletin of the Seismological Society of America, 82(2), 1018–1040. https://doi.org/10.1785/BSSA0820021018
- Pailoplee, S., & Choowong, M. (2014). Earthquake frequency-magnitude distribution and fractal dimension in mainland Southeast Asia. Earth, Planets and Space, 66(1), 8. https://doi.org/10.1186/1880-5981-66-8
- Pollitz, F. F., Banerjee, P., Burgmann, R., Hashimoto, M., & Choosakul, N. (2006). Stress changes along the Sunda trench following the 26 December 2004 Sumatra-Andaman and 28 March 2005 Nias earthquakes. Geophy, Res. Lett, 33, L06309. https://doi.org/10.1029/2005GL024558
- Rafie, M. T., Cummins, P. R., Sahara, D. P., Widiyantoro, S., Triyoso, W., & Nugraha, A. D. (2021). Variations in forearc stress and changes in principle stress Orientations caused by the 2004–2005 megathrust earthquakes in Sumatra, Indonesia. Frontiers in Earth Science, 9, 712144. https://doi.org/10.3389/feart.2021.712144
- Roy, S., Ghosh, U., Hazra, S., & Kayal, J. R. (2011). Fractal dimension and b-value mapping in the Andaman-Sumatra subduction zone. Natural Hazards, 57, 27–37.
- Scholz, C. H. (1968). The frequency-magnitude relation of microfracturing in rock and its relation to earthquakes. Bulletin of the Seismological Society of America, 58(1), 399–415. https://doi.org/10.1785/BSSA0580010399
- Schorlemmer, D., Werner, M. J., Marzocchi, W., Jordan, T. H., Ogata, Y., Jackson, D. D., Mak, S., Rhoades, D. A., Gerstenberger, M. C., Hirata, N., Liukis, M., Maechling, P., Strader, A., Taroni, M., Wiemer, S., Zechar, J. D., & Zhuang, J. (2018). The collaboratory for the study of earthquake predictability: achievements and priorities, Seismol. Res. Lett, 89, 1305–1313.
- Sevilgen, V., Stein, R. S., & Pollitz, F. F. (2012). Stress imparted by the great 2004 Sumatra earthquake shut down transforms and activated rifts up to 400 km away in the Andaman Sea. Proceedings of the National Academy of Sciences, 109(38), 15152–15156. https://doi.org/10.1073/pnas.1208799109
- Shamim, S., Khana, P. K., & Mohanty, S. P. (2019). Stress reconstruction and lithosphere dynamics along the Sumatra subduction margin. Journal of Asian Earth Sciences, 170(2019), 174–187. https://doi.org/10.1016/j.jseaes.2018.11.008
- Sieh, K., & Natawidjaja, D. H. (2000). Neotectonics of the Sumatran fault, Indonesia. Journal of Geophysical Research, 105(B12), 28295–28326. https://doi.org/10.1029/2000JB900120
- Tim Pusat Studi Gempa Nasional-2017 (The 2017 PuSGeN). (2017). Peta Sumber dan Bahaya Gempa Indonesia Tahun 2017. Kementrian Pekerjaan Umum dan Perumahan Rakyat (In Indonesian).
- Triyoso, W. (2023). Probabilistic seismic hazard function based on spatiotemporal earthquake likelihood simulation and Akaike information criterion: The PSHF study around off the west coast of Sumatra island before large earthquake events. April 2023. Frontiers in Earth Science, 11, 1104717. https://doi.org/10.3389/feart.2023.1104717
- Triyoso, W., & Sahara, D. P. (2021, April 28). Seismic hazard function mapping using estimated horizontal crustal strain off West coast northern Sumatra, front. Frontiers in Earth Science, 9. https://doi.org/10.3389/feart.2021.558923
- Triyoso, W., Sahara, D. P., Sarsito, D. A., Natawidjaja, D. H., & Sukmono, S.(2022). Correlation dimension in Sumatra island based on active fault, earthquake data, and estimated horizontal crustal strain to Evaluate seismic hazard Functions (SHF). 2022, 3.https://doi.org/10.3390/geohazards3020012
- Triyoso, W., & Suwondo, A. (2022). From the geodynamic aspect to earthquake potential hazard analysis of Liwa city and its surrounding. Natural Hazards, 116(1), 1329–1344. https://doi.org/10.1007/s11069-022-05705-0
- Triyoso, W., Suwondo, A., Sahara, D. P., & Sarsito, D. A. (2021) Earthquake potential hazard around off coast the West Sumatra-Bengkulu: Application spatial correlation between estimated SHmax and correlation dimension. Proceedings of the 18th Annual Meeting of the Asia Oceania Geosciences Society (AOGS 2021), August 1-6, 2021, Singapore.
- Triyoso, W., Suwondo, A., Yudistira, T., & Sahara, D. P. (2020). Seismic hazard function (SHF) study of coastal sources of Sumatra island: SHF evaluation of Padang and Bengkulu cities. Geoscience Letters, 7(1), 2. https://doi.org/10.1186/s40562-020-00151-x
- Triyoso, W., & Yuninda, O. (2022) Seismic hazard function (SHF) study prior to large earthquake event of the year 1994 and 2006 off coast of the Java island: The SHF analysis based on the change of the b-value. Proceedings of the 19th Annual Meeting of the Asia Oceania Geosciences Society (AOGS 2021), August 1-5, 2022, Singapore.
- Utsu, T. (1978). Estimation of parameter values in the formula for the magnitude-frequency relation of earthquake occurrence. Zisin, 31(4), 367–382. https://doi.org/10.4294/zisin1948.31.4_367
- Wang, X. (2009). User manual for comcot version 1.7. Institute of Geological & Nuclear Science.
- Wang, R., Chang, Y., Miao, M., Zeng, Z., Chen, H., Shi, H., Li, D., Liu, L., Su, Y., & Han, P. (2021). Assessing Earthquake Forecast Performance Based on b Value in Yunnan Province, China. Entropy, 23, 730. https://doi.org/10.3390/e23060730
- Ward, S. N. (1998). On the consistency of earthquake moment rates, geological fault data, and space geodetic strain: The United States. Geophysical Journal International, 134(1), 172–186. https://doi.org/10.1046/j.1365-246x.1998.00556.x
- Wyss, M. (1973). Towards a Physical Understanding of the Earthquake Frequency Distribution. Geophysical Journal of the Royal Astronomical Society, 31(4), 341–359. https://doi.org/10.1111/j.1365-246X.1973.tb06506.x
- Wyss, M., Sammis, C. G., Nadeau, R. M., & Wiemer, S. (2004). Fractal dimension and b-value on creeping and locked patches of the San Andreas fault near Parkfield, California. Bulletin of the Seismological Society of America, 94(2), 410–421. https://doi.org/10.1785/0120030054
- Youngs, R. R., Chiou, S. J., Silva, W. J., & Humphrey, J. R. (1997). Strong ground motion attenuation relationships for subduction zone earthquakes. Seismological Research Letters, 68(1), 58–73. https://doi.org/10.1785/gssrl.68.1.58
- Yusfania, M., Meilano, I., & Sarsito, D. A. (2014). The utilization of spatial filtering for tectonic strain study based on SUGAR (SUMATRAN GPS ARRAY) data 2006 – 2008 study case: The September 2007 Bengkulu earthquake, (7226). FIG Congress 2014 Engaging the Challenges – Enhancing the Relevance.
- Zachariasen, J., Sieh, K., Taylor, F. W., & Hantoro, W. S. (2000). Modern vertical deformation above the Sumatran Subduction Zone: paleo geodetic insights from coral microatolls. Bull. Seismol. Soc. Am, 90, 897–913. https://doi.org/10.1785/0119980016
- Zechar, J. D., Schorlemmer, D., Liukis, M., Yu, J., Euchner, F., Maechling, P. J., & Jordan, T. H. (2010). The Collaboratory for the Study of Earthquake Predictability perspective on computational earthquake science, Concurrency Comput. Pract. Ex., 22, 1836–1847.
- Zhao, J. X., Zhang, J., Asano, A., Ohno, Y., Oouchi, T., Takahashi, T., Ogawa, H., Irikura, K., Thio, H. K., Somerville, P., & Fukushima, Y. (2006). Attenuation relations of strong ground motion in Japan using site classification based on predominant period. Bulletin of the Seismological Society of America, 96(3), 898–913. https://doi.org/10.1785/0120050122