
 ?Mathematical formulae have been encoded as MathML and are displayed in this HTML version using MathJax in order to improve their display. Uncheck the box to turn MathJax off. This feature requires Javascript. Click on a formula to zoom.
ABSTRACT
The aim of this study was to investigate the causes of building failures in a part of Ilorin. Vertical electrical sounding (VES) was conducted, and 1D inverted resistivity indicates four distinct layers. The first layer is top soil with resistivity values of 16.1 Ωm to 81.1 Ωm and a depth of 0.1 m to 0.3 m. The second layer is clay/silty clay with resistivity values between 12.6 Ωm and 59.6 Ωm and a depth of 1.1 m to 2.8 m. The third geoelectric layer is weathered basement with resistivity values between 5.9 Ωm and 38.4 Ωm and a depth of 1.3 m to 6.2 m, and the fourth layer is fresh basement layer. Four pits were dug to a depth of 1.5 m, and undisturbed soils were collected for geotechnical test. Maximum dry density of the soils falls between 1.73 and 1.84 with an average of 1.90 Mg/m. Dynamic cone penetration test (DCPT) was conducted, and the quantity of blows to achieve 1000 mm (1 m) penetration depth (n) was recorded. DCPT of the soils varies between 89.8 kN/m2 and 314.3 kN/m2, with low bearing capacity of 89.8 kN/m2 to 134.7 kN/m2 at a depth of 0.1 m to 0.3 m, which is below the recommended minimum value of 150 kN/m2, and this contributed to the building failures in the study area.
1. Introduction
The rapid rate of urbanisation requires an increase in infrastructural developments, particularly, construction of buildings (Ansari et al., Citation2023). Buildings are places for living, working and storage. The buildings can be categorised into three types (Mbimda et al., Citation2017): monumental structures such as churches, city halls and sport areas. The second type is called institutional structures, which include block of flats and tertiary institutional buildings for academic and administrative purposes. The third category of structures is represented by ordinary small-scale industrial types. Building collapse or failure is a state of complete failure when the structure has given way and most members caved in or buckled (Adetunji et al., Citation2018). When a material is pushed past its breaking point, structural failure begins, leading to severe deformations or fractures, and also placing a building foundation within low-bearing-capacity soil will cause displacements that may alter the stress distribution significantly (Al-Marwaee, Citation2017).
Collapse of buildings is so rampant in Nigeria that there is hardly any day when it does not happen (Adeyemi, Citation2017), and it is now a series of concerns to all the building construction stakeholders including the general public. There are several factors that are attributed to the causes of building failures among which are wrong construction techniques or foundation problems (Agbede et al., Citation2015; Amadi et al., Citation2012). Building failures could also occur from natural factors (Bazant & Verdure, Citation2007; Kelechi et al., Citation2023) such as volcanicity, subsidence, flooding, erosion, earthquakes, landslides, mud-flow and faulting within the rocks (Maduka et al., Citation2016). Geological factors such as rock types, shrinkage and swelling clay soils, and groundwater conditions of an area could also result in the building failures (Arora, Citation2008; Sabtan, Citation2005). Man-made activities lead to building failures, and these include poor design and construction, use of substandard material, hasty construction, poor supervision (Fagbenle & Olawumi, Citation2010), absence of qualified site engineer and improper follow-up with the standard building laws, especially by the quakes from town planning officials (Ede, Citation2010; Kelechi et al., Citation2023).
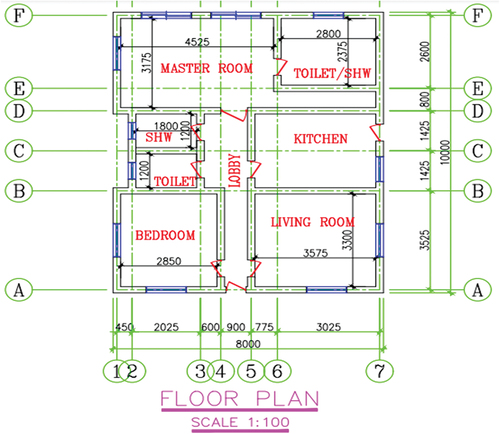
In many urban cities of Nigeria, safety of lives and properties is under serious threat due to continuous report of building failures. Over 400 lives have been claimed in Lagos in the last five decades due to building failures (Adetunji et al., Citation2018). Also, there have been many cases of building collapse in Abuja and Port Harcourt in recent times (Mbimda et al., Citation2017). Recently, cases of building failures have been reported in a part of Ilorin (). Some of these buildings are designed with two toilets, two bathrooms, two bedrooms, a kitchen, living room and a lobby (). Building collapse has become a serious problem that requires urgent solutions from all stakeholders in the building industry and government. However, some studies have been carried out on groundwater potential, groundwater quality and waste management in Ilorin (Adeoye et al., Citation2019; Ahmed, Citation2008; Ibrahim et al., Citation2019), but no research work has been reported on the causes of building failures in Ilorin. The aim of this study was to investigate the causes of building failures in a part of Ilorin and suggest lasting solutions to prevent future occurrences.
Figure 1. Building failures observed in the study area.
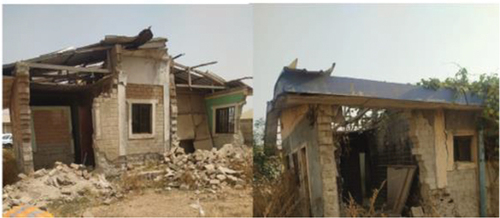
Figure 2. Engineering design of a structure in the study area.
2. Location and geology of the study area
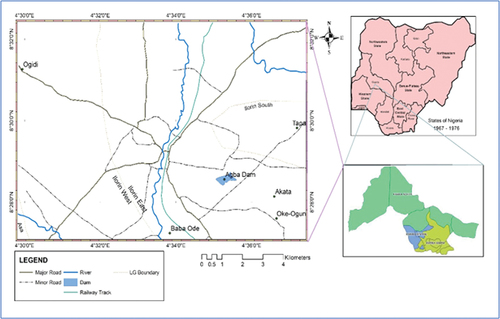
The study area is located in the northern part of Ilorin, Kwara State, Nigeria. The area is situated along Ilorin–Shao road, and close to Sobi Hills. The study location falls within Ilorin sheet 223NW (1:50,000) and lies between longitudes E4° 30′ 06″ to E4° 37′ 08″E and latitudes N8° 27′ 08″ to N8° 32′ 04″. Ilorin is the capital of Kwara State and geographically located in the Northcentral Nigeria (), with a population of 2,365,353 (NPC, Citation2023). The total annual rainfall in the State ranges from 800 mm to 1,200 mm in the northwest and 1,000 mm to 1,500 mm in the southeast. The area has a mean annual temperature ranging between 30–35°C and relative humidity of 60% on the average. The socio-economic and environmental activities in the study area include trading, farming, weaving, pot making and most indigenes are engaged in civil service work or are self-employed.
Figure 3. Location map of the study area.
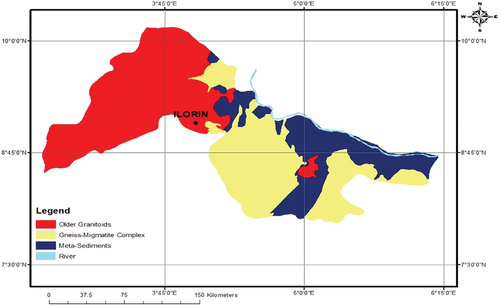
The study area falls within the Southwestern Nigerian Basement Complex. It is underlain by the Migmatite–Gneiss–Quartzite complex of Precambrian to Cambrian age intruded by suites of granitic bodies (porphyritic-granite, medium/coarse-grained biotite granite, hornblende granite, granodiorite and granite gneiss) known as the Older Granitoids, which are of Pan-African age in the northern, central and south-western regions and Schist Belt (Egbe-Isanlu Schist Belt) adjacent to each other (). Apart from the isolated common hills called Sobi Hills, most parts of the study area are covered by dark sandy or clayey loamy top soils (Ojo et al., Citation2014). The underlying lithologies contain weathered to fresh crystalline basement rocks that include porphyritic granite, gneiss and granite-gneiss.
Figure 4. Geological map of Kwara State showing the study area (NGSA, Citation2009).
3. Materials and methods
This study employed an integrated method to assess the causes of building failures in the study area, and these methods include geophysical, geotechnical and geochemical. The geophysical study was conducted using electrical resistivity method by Schlumberger array in seven locations, and four pits were dug to a depth of 1.5 m. Four undisturbed soil samples were collected from four dug pits for geotechnical investigations (). However, the choice of sites for drilling was based on the understanding of the situation and environmental implications of the test in relation to the in-situ state of the materials that includes material composition, presence of hard layers, moisture content (MC), density, among others. After sample collection, the samples were subjected to geotechnical tests in the laboratory. The geotechnical tests include natural MC, Atterberg limit test, permeability test, compaction test and also dynamic cone penetration test (DCPT), conducted in four locations (). Geochemical analysis of groundwater samples was carried out to determine the chemical and physical parameters of groundwater from shallow aquifer in the study area.
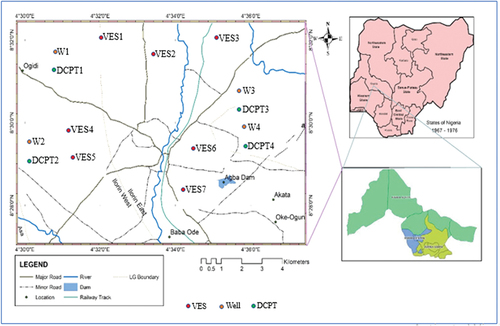
Figure 5. Location map of the study area showing VES, Wells and DCPT sites.
3.1. Geophysical method
Geophysical methods are used both in geological and engineering studies to provide information about the nature of subsoil materials, geological sequence and structures. Understanding the geophysical structure of any site is quite essential in mapping site conditions, especially in geotechnical engineering (Alao, Citation2024). The response of the earth’s subsurface depends on several factors such as clay content, porosity, soil water content (SWC), mineral content and topography (Osumeje et al., Citation2023). In subsurface investigations, the target’s geophysical properties such as density, velocity (Balogun et al., Citation2023), electrical resistivity, attenuation and relative dielectric constant usually depend on pore content, rock types and geometry (Alao et al., Citation2023). Building failures could be linked to poor plan with no consideration of the subsoil materials and inhomogeneities in the subsurface rocks (Ademila, Citation2018, Citation2022). Therefore, information on the geologic condition and subsurface rock types is very important for safety of building foundations. To understand the subsurface lithology in the study area, electrical resistivity data were acquired using a resistivity meter MODEL SSR MP1. With this meter, the distance between the two current electrodes (AB/2) was increased to a maximum spread of 50 m, while the distance between the potential electrodes (MN/2) was increased to a maximum of 15.0 m. A total of seven vertical electrical soundings (VES) were acquired across the study area.
3.2. Atterberg consistency limit test
The Atterberg limit test is used to measure the nature of a fine-grained soil. Depending on the water content of the soil, it may appear in four states: solid, semi-solid, plastic and liquid. In each state, the consistency and behaviour of a soil are different and thus so are its engineering properties. However, the boundary between each state can be defined based on a change in the soil’s behaviour. The Atterberg limit test can be used to distinguish between different types of silts and clays. Soils normally contain a finite amount of water, which can be expressed as the soil MC. This moisture exists within the pore spaces in between soil aggregates (inter-aggregate pore space) and within soil aggregates (intra-aggregate pore space). Normally, this pore space is occupied by air and/or water. If all the pores are occupied by air, the soil is completely dry, and if all the pores are filled with water, the soil is said to be saturated. The MC is calculated based on the American Society for Testing and Materials (ASTM, Citation2000) standards, as given in EquationEquation 1(1)
(1) .
3.3. Permeability test results (falling head method)
The test was carried out in the laboratory using EquationEquation 2(2)
(2) (Elhakim, Citation2016). The purpose of the test was to determine the permeability coefficient of the soil samples and thereby use the values for drainage interpretation.
where, A = cross-sectional area of the sample = 100 mm
a = the bore area of the standpipe tube with a diameter of 3 mm
L = length of the sample = 130 mm
t2 = final time reading and t1 = initial time reading
t1 = 0 s and t2 = 45 s
3.4. Compaction test
A compaction test is a process by which expending compactive energy on soil, causing the soil grains to be more closely rearranged. Compaction increases the shear strength of soil and reduces its compressibility and permeability (Apparao & Rao, Citation1995). According to Prakash and Jain (Citation2002), compaction of soils increases the density, shear strength and bearing capacity but reduces their void ratio, porosity, permeability and settlements. The MC at which the soils are compacted in the field is controlled by the value of optimum MC determined by the laboratory proctor compaction test. The compaction energy applied in the field is also controlled by the maximum dry density determined in the laboratory.
3.5. Dynamic cone penetration test
To evaluate the bearing capacity of subsoil layers, the DCPT was carried out. This method was designated in ASTM D 6951/D 6951-09. DCPT consists of the DCP’s free-falling hammer to strike the cone (), causing the cone to penetrate the base or subgrade soil, and then measuring the penetration per blow (n), referred to as the penetration rate in mm/blow (Anthony & Okeke, Citation2018). The measurement represents the stiffness of the tested soil layers, with a smaller penetration index or resistance (PR) number indicating a stiffer material. DCP test stands out for its affordability and its superior ability to deliver repeatable results (Salgado & Yoon, Citation2003). Measurements of the penetration rate of the dynamic cone penetrometer with a 10 kg hammer through undisturbed soil were taken in the study area. In the field, the number of blows (n) required to advance the cone to 1000 mm (1 m) depth into the soil was targeted and recorded. DCPT was conducted in four locations in the study area. Equation (7) proposed by Ampadu (Citation2005) was used to establish a correlation between the DCPT readings and the bearing capacity of the soil.
Figure 6. Assembled DCP equipment (modified after Hidayat et al., Citation2020).
3.6. Hydrochemical test
The quality of groundwater is usually important whether for industrial, domestic or agricultural uses (Ibrahim et al., Citation2019). Shallow groundwater samples were collected from five shallow aquifer hand-dug wells of depth 7 m to 8 m in the study area and analysed for physical and chemical parameters to understand the quality of groundwater for construction purposes. Prior to the chemical analysis, all groundwater samples were stored under hygienic and required temperature in the water chemistry laboratory at the University of Ilorin. The pH, chloride and sulphate concentrations were determined in accordance with the ASTM standards.
4. Results and interpretation
4.1. Geophysical
shows the measured apparent resistivities, curve types, thicknesses, depths and lithologies in seven VES locations in the study area. The apparent resistivity (ρa) is plotted against the corresponding half electrode spacing (AB/2) on a bi-logarithm graph to generate the sounding curves. Sounding curves were initially interpreted by partial curve matching and inverted using WIN resist. shows the 1D inversion curves for the seven VES locations. However, high RMSE error in some of the VES readings could be that probe resistance was low, causing current leakages in the cause of measurements. There are four geoelectric layers: top soil, clay/silty clay, weathered basement and fresh basement. The generated curve types include QH (locations 1, 2, 3 and 5), HA (locations 4 and 6) and KH (location 7), respectively. The first top soil layer possesses resistivity values between 16.1 and 81.1 Ωm, thickness of 0.1 to 0.3 m and depth between 0.1 and 0.3 m. The second geoelectric layer is clay/silty-clay, with resistivity values from 12.6 to 59.6 Ωm, thickness between 0.8 and 11.3 m and depth of 1.1 to 2.8 m. The third geoelectric layer is the weathered basement having resistivity values between 5.9 and 38.4 Ωm, thickness of 0.9 to 4.0 m and depth ranges between 1.3 and 6.2 m, while the fourth geoelectric layer is the fresh basement, with resistivity values between 75.9 and 493.6 Ωm. The clay and silty-clay as subsoil materials in the study area could impede groundwater flow because the soil particles become compacted as the soil particles are too close together. When the clays turn or become hard, dry and even cracked, it makes it difficult for water to pass through the earth, and the clay soils become waterlogged. This occurrence results in structural damages, especially in lightweight structures. Also, weathered basement units as witnessed in the area enhance accumulation of water and form pathways for groundwater, and these are disastrous to structural foundation of civil earth works without adequate foundation planning.
Figure 7. Resistivity curves generated from electrical resistivity data (locations 1, 2, 3, 4, 5, 6 and 7).
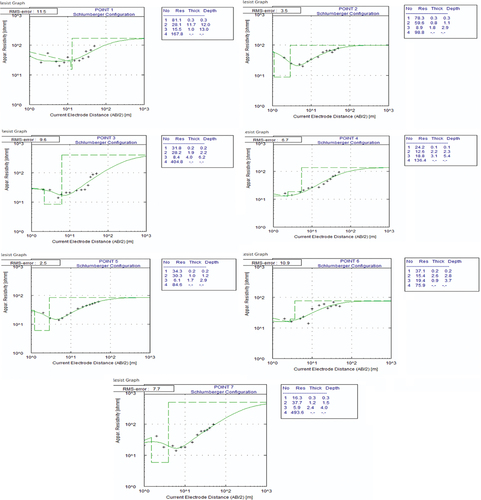
Table 1. Inversion of electrical resistivity sounding data in the study area.
4.2. Geotechnical results
The soils in the study area have MCs between 20% and 30%, with a mean value of 25%, revealing that the soils are wet (). Liquid limit values in the soils range from 25% to 38%, with a mean value of 32.5%, as shown in and . The liquid limit of a soil is the water content, expressed as a percentage of the weight of the oven-dried soil, at the boundary between the liquid and plastic states of consistency of the solid. Plasticity limits varies between 14.2% and 28.5% in the soil samples with an average value of 21.7%. The plastic limit of a soil is the water content, expressed as a percentage of the weight of oven-dried soil, at the boundary between the plastic and semi-solid states of consistency of the soil. Plasticity index (PI) for the samples lies between 7.5% and 13.2%, with an average value of 9.6%. PI is the plastic limit subtracted from the liquid limit and indicates the size of the range between the two boundaries. If the PI value is low to mid-20s, the soil may be expansive under wet conditions or exhibit shrinkage in dry conditions (Globalgilson, Citation2022). shows that soil samples from well 1 and well 2 are classified as inorganic clay of low plasticity. Clay is an expansive soil made up of tiny particles, and when wet, it expands, but when it is dry, it will shrink significantly. When clay is moist, it is very pliable and can easily be moved, manipulated and shifted. These extreme changes can put a great deal of pressure on foundations, usually causing them to shift up and down or crack, which leads to building failures. Samples from well 3 and well 4 are classified as inorganic silt of medium compressibility and organic silt in USCS soil classification scheme (Wagner, Citation1957).
Figure 8. Liquid limit determination for soil samples in the study area.
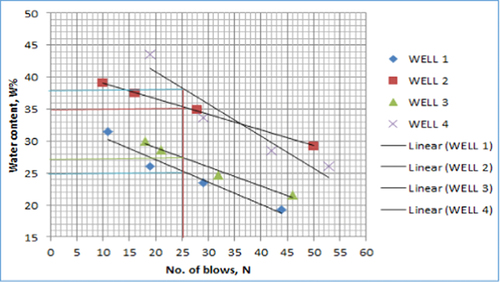
Figure 9. Plasticity index against liquid limit for soil classifications.
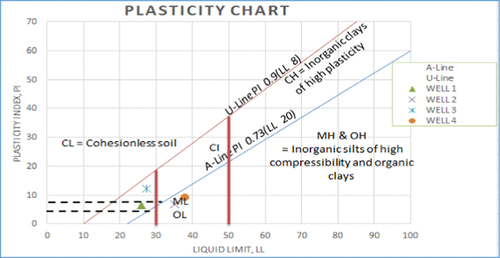
Table 2. Summary of Atterberg limit tests (plasticity test) conducted on soil samples in the study area.
Table 3. Summary of Atterberg tests conducted on soil samples in the study area.
The compaction test () revealed the optimum MC on which the soil attains maximum density due to a specific amount of compaction energy. The values for the maximum dry density (MDD) of the soils range from 1.73 to 1.84, with an average of 1.90 Mg/m, while the optimum moisture content (OMC) falls between 12.5 and 15.5%. The specific gravity of the soils ranges between 2.42 and 2.47, with a mean value of 2.44 (). De Graft-Johnson (Citation1969) observed that the specific gravity of clay is between 2.20 and 2.60. The specific gravity of the majority of the soils falls within the clay groups. The clays have affinity for water and possess low permeability, with the ability to exhibit shear under loads. These could be attributed to the conspicuous failures of buildings in the study area. The measured permeability index for the soils in the study area () ranges from 2.62 × 10⁻⁷ to 3.21 × 10⁻⁷. According to U.S. Bureau of Reclamation, soils are classified as (i) Impervious: k (coefficient of permeability) less than 10–6 cm/s, (ii) Semi-pervious: k between 10–6 and 10–4 cm/s and (iii) Pervious: k greater than 10–4 cm/s. It is, hence, seen that the soils in the area are impervious. The calculated bearing capacity from DCPT increases with depth, as presented in and . Calculated bearing capacity of the soils in the study area varies from 89.8 kN/m2 to 314.3 kN/m2, with low bearing capacity of 89.8 kN/m2 to 134.7 kN/m2 at depths of 100 mm to 300 mm (0.1 m to 0.3 m), which are below the recommended minimum value of 150 kN/m2 based on the recommended bearing capacity values of the soils in the six geopolitical zones of Nigeria (Salahudeen et al., Citation2018), and these depths with low bearing capacity are likely to experience building failure.
Figure 10. Compaction curves showing MDD and OMC of soil samples.
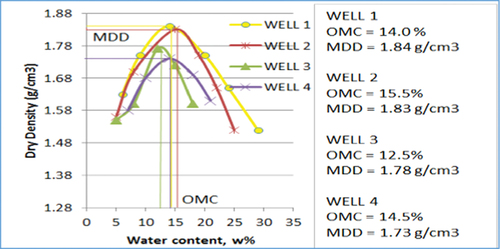
Figure 11. Graph of penetration index (mm/blow) against penetration depth (mm).
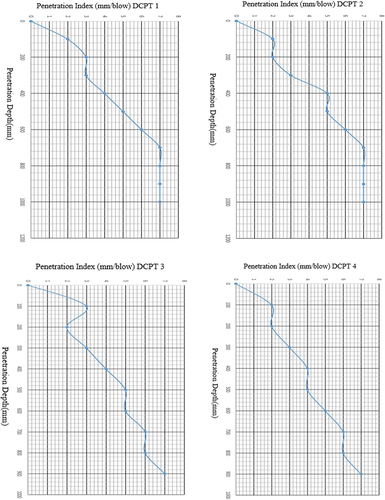
Table 4. Specific gravity for the soil samples in the study area.
Table 5. Coefficient of permeability and their interpretations for the samples (U.S. Bureau of Reclamation).
Table 6. Result of DCPT in the study area.
4.3. Hydrochemical results
Based on the chemical analysis of the groundwater from the study area, the pH ranges from 6.6 to 7.3, with an average of 6.8 (). The chloride values are between 1.07 mg/l and 1.16 mg/l, with an average of 1.114 mg/l. The sulphate values are between 0.48 mg/l and 0.93 mg/l, with an average of 0.68 mg/l. Electrical conductivity (EC) and total dissolved solids (TDS) values range between 105–132 μS/cm and 68–98 mg/l, respectively. The ASTM standards stipulate 500 mg/l as the permissible limit for chloride and sulphate for concrete work, and the limit value for pH value is 6. Scatter plots of the parameters are presented in . The red line in each plot represents the permissible limits for concrete works. The pH value is above the permissible limit of 6.0, which means that the pH is less acidic and is unlikely to attack concrete installations in the area. Also, chloride and sulphate concentrations are below the permissible limits of 500 mg/l, and it is clear that there is no credence that the groundwater within the study area would have contributed to the observed structural failure.
Figure 12. Scatter plots of sulphate (top), chloride (middle) and pH (bottom). In each subplot, the ASTM standards for concrete work are represented by red dashed horizontal line.
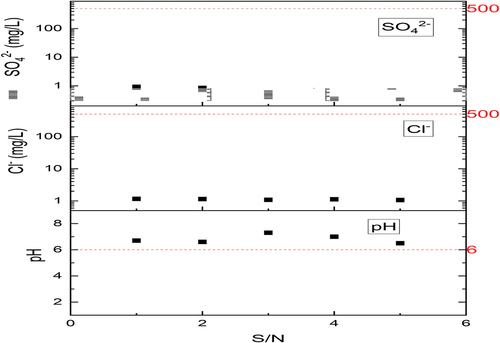
Table 7. Chemical characteristics of water samples.
5. Conclusion
The lithology of the area from geophysical study revealed four distinct layers. The first layer is the top soil with resistivity values between 16.1 and 81.1 Ωm and a depth from 0.1 to 0.3 m. The second layer is clay/silty clay with resistivity values from 12.6 to 59.6 Ωm and a depth from 1.1 to 2.8 m. The third geoelectric layer is weathered basement with resistivity values between 5.9 and 38.4 Ωm and a depth from 1.3 to 6.2 m. The fourth layer is the fresh basement layer. The presence of clays lying within the top 2 m in the subsurface is critical to the stability of the building in the study area. Clay soils absorb water and retain such water in their complex chain structures and release water slowly under pressure. This also indicates that any structure placed on this type of soil material lies on swelling material and shrinks later. This process may contribute to the building failure in the study area. The bearing capacity of the soils in the study area is lower at depths ranging from 100 mm to 300 mm (0.1 m to 0.3 m) with values of 89.8 kN/m2 to 134.7 kN/m2 below minimum recommended value of 150 kN/m2 to 350 kN/m2, and there are possibilities of failures at these depths. It is recommended that the foundation in the study area should be set below the clay and silty clay units, and this can be achieved by excavation of the foundation lines and laying of concrete bases or pilling, and if a foundation is proposed above the clay layer, then a raft foundation mesh is expected to be used. Also, weep pipe (PVC) holes should be used to drain storm water away from the clay into the drainage system. There is no report of seismic hazard that might have contributed to the building failures in the study area. Also, socio-economic and environmental activities in the study area are not affecting the stability of the buildings. However, clay as a subsoil material in enormous quantity in the area can be useful, i.e. clay exhibits plasticity when mixed with water in the right proportions, which allows clay to be used for making both utilitarian and decorative pottery. Different types of clay, when used with different minerals and firing conditions, are used to produce earthenware, stoneware and porcelain.
Highlights
Clays possess low permeability and exhibit shear under loads that are attributed to the conspicuous failures of building.
Calculated bearing capacity from dynamic cone penetration test increases with depth.
Four geoelectric layers are recognised, which are top soil, clay/silty clay, weathered basement and fresh basement.
Weep pipe (PVC) holes should be used to drain storm water away from the clay into the drainage system.
Author contribution statement
Ibrahim K.O.: Designed the research, performed, analysed, interpreted the data and drafted the paper.
Ahmed A.: Designed the research, performed, analysed, interpreted the data and corrected the paper.
Oke S.A.: Contributed reagents, materials analysis tools, data analysis and corrected the paper.
Yusuf M.A.: Contributed reagents, field support and corrected the paper contents.
Oniyangi A.K.: Contributed reagents and data interpretation.
Olawumi H.B.: Contributed reagents, field support and data interpretation.
Disclosure statement
No potential conflict of interest was reported by the author(s).
Data availability statement
The authors confirm that the data supporting the findings of this study are available within the article.
Additional information
Funding
References
- Ademila, O. (2018). Geotechnical influence of underlying soils to pavement failure in Southwestern part of Nigeria. Malaysian Journal of Sustainable Environment, 4(1), 19–36. https://doi.org/10.24191/myse.v4i1.5604
- Ademila, O. (2022). Pre-foundation geophysical investigation of a site for structural development in Oka, Nigeria. NRIAG Journal of Astronomy and Geophysics, 11(1), 81–112. https://doi.org/10.1080/20909977.2021.1953297
- Adeoye, T. O., Ibrahim, K. O., Ologe, O., & Popoola, J. T. (2019). Geophysical investigation for groundwater development around chapel of light hostel area, University of Ilorin. Nigerian Journal of Pure and Applied Science, 32(2), 3534–3544.
- Adetunji, M. A., Oyeleye, O. I., & Akindele, O. A. (2018). Assessment of building collapse in Lagos Island, Nigeria. American Journal of Sustainable Cities and Society, 7(1), 18–28. https://doi.org/10.26808/rs.aj.i7v1.04
- Adeyemi, G. O. (2017). Solution to buildings collapse in Nigeria. https://guardian.ng/opinion/solution-to-buildings-collapse/
- Agbede, O. A., Jatau, N. D., Oluokun, G. O., & Akinniyi, B. D. (2015). Geotechnical investigation in to the causes of cracks in building: A case study of Egbogha building, University of Ibadan, Nigeria. International Journal of Engineering Science Innovation, 4(11), 18–22.
- Ahmed, Y. A. (2008). Waste management in Ilorin metropolis: Lessons for Nigeria. FUTY Journal of the Environment, 3(1), 49–56. https://doi.org/10.4314/fje.v3i1.50802
- Alao, J. O. (2024). Determination of the geophysical signature of soft-clay and hard lateritic soils and the implications on geotechnical works using electrical resistivity imaging. Results in Earth Sciences, S2211 – 7148(24), 00012–8. https://doi.org/10.1016/j.rines.2024.100025
- Alao, J. O., Lawal, K. M., Dewu, B., & Raimi, J. (2023). The evolving roles of geophysical test sites in engineering, sciences and technology. Acta Geophysica, 72(1), 161–176. https://doi.org/10.1007/s11600-023-01096-3
- Al-Marwaee, M. (2017). Structural failure of buildings: Issues and Challenges. World Scientific News, 66(1), 97–108.
- Amadi, A. N., Eze, C. J., Igwe, C. O., Okunlola, I. A., & Okoye, N. O. (2012). Architect’s and geologist’s view on the causes of building failures in Nigeria. Modern Applied Science, 6(6), 31–38. https://doi.org/10.5539/mas.v6n6p31
- Ampadu, S. (2005). A correlation between the dynamic cone penetrometer and bearing capacity of a local soil formation. Proceedings of the 16th International Conference on Soil Mechanics and Geotechnical Engineering (pp. 655–658). Publisher IOS Press.
- Ansari, R. A., Ramachandran, A., & Thomas, W. (2023). GPU based building footprint identification utilising self-attention multiresolution analysis. All Earth, 35(1), 102–111. https://doi.org/10.1080/27669645.2023.2202961
- Anthony, C. N., & Okeke, O. C. (2018). Using dynamic cone penetration tester to determine CBR and bearing pressures of subsurface soils in parts of Owerri, Southeastern Nigeria. European Journal of Engineering Research and Science, 3(12), 1–7. https://doi.org/10.24018/ejers.2018.3.12.973
- Apparao, K. V. S., & Rao, V. C. S. (1995). Soil testing laboratory manual and question bank. Universal Science Press.
- Arora, K. A. (2008). Soil mechanics and Foundation Engineering (8th ed., pp. 69–356). Standard Publisher Dist.
- ASTMD 6951/D 6951- 09. (2000). American standard test method for use of the dynamic cone penetrometer in shallow pavement.
- Balogun, O. B., Agbonjaru, D. C., & Ayolabi, E. A. (2023). Site investigation of soil competence by electrical resistivity and refraction seismic methods at a proposed building—a case study from Nigeria. Arabian Journal of Geosciences, 16(7), 409. https://doi.org/10.1007/s12517-023-11498-8
- Bazant, P. Z., & Verdure, M. (2007). Discussion of “mechanics of progressive collapse: Learning from world trade centre and building demolitions”. Journal of Engineering Mechanics, 133(3), 308–319. https://doi.org/10.1061/(ASCE)0733-9399(2007)133:3(308)
- De Graft-Johnson, J. W. S. (1969). The Engineering characteristics of the lateritic gravels of Ghana. Proceedings of 7th International Conference on Soil Mechanics and Foundation Engineering, Mexico, 2, 28-29 (pp. 13–43). Asian Institute of Technology, Bangkok.
- Ede, A. N. (2010). Building collapse in Nigeria: The trend of casualties in the last decade. International Journal of Civil Environment, 10(6), 32–42.
- Elhakim, A. F. (2016). Estimation of soil permeability. Alexandria Engineering Journal, 55(3), 2631–2638. https://doi.org/10.1016/j.aej.2016.07.034
- Fagbenle, O. I., & Olawumi, A. O. (2010). Building failure and collapse in Nigeria; the influence of the informal sector. Journal of Sustainable Development, 3(4), 264–276. https://doi.org/10.5539/jsd.v3n4p268
- Globalgilson. (2022). Atterberg limits: A quick reference guide. https://www.globalgilson.com/blog/atterberg-limits-a-quick-reference-
- Hidayat, R. F., Kiyota, T., Tada, N., Hayakawa, J., & Nawir, H. (2020). Reconnaissance on liquefaction-induced flow failure caused by the 2018 Mw 7.5 Sulawesi Earthquake, Palu, Indonesia. Journal of Engineering Technology, 52(1), 51–65. https://doi.org/10.5614/j.eng.technol.sci.2020.52.1.4
- Ibrahim, K. O., Gomo, M., & Oke, S. A. (2019). Groundwater quality assessment of shallow aquifer hand dug wells in rural localities of Ilorin, Northcentral Nigeria: Implications for domestic and irrigation uses. Implications for Domestic and Irrigation Uses, 9(2019), 100226. https://doi.org/10.1016/j.gsd.2019.100226
- Kelechi, N. E., Ogbonnaya, I., Daniel, N. O., Chinenyem, S. U., & Kelechi, P. U. (2023). Foundation integrity assessment of failed buildings in Ehamufu and Aguamede, South East Nigeria. Scientific Reports, 13(1), 719. https://doi.org/10.1038/s41598-023-28043-y
- Maduka, R. I., Igwe, O., Ayogu, N. O., Ayogu, C. N., & Nwachukwu, M. (2016). Geotechnical assessment of road failure and slope monitoring along Nsukka Adoru – Idah highway Southeastern Nigeria. Environmental Monitoring and Assessment, 189(1), 30. https://doi.org/10.1007/s10661-016-5699-z
- Mbimda, A. M., Yakubu, I., & Timothy, D. (2017). Assessment of building failures in Nigeria: A case study of Jos Metropolis. International Journal of Advanced Engineering and Science, 6(2), 1–9.
- National Population Commission. (2023, September 23). https://www.un.ng.com.https://google.com
- Nigerian Geological Survey Agency. (2009). Geological map of Kwara State, Nigeria. Nigerian Geological Survey Agency, Federal Ministry of Mines and Steel Development.
- Ojo, O. J., Adepoju, S. A., & Alhassan, N. (2014). Geochemical and mineralogical studies of kaolinitic clays in parts of Ilorin, Southwestern Basement Rock area, Nigeria. Universal Journal of Geosciences, 2(7), 212–221. https://doi.org/10.13189/ujg.2014.020704
- Olatunji, A. S., & Oloruntola, M. O. (2008). Integrated geological, geophysical and geotechnical appraisal of a site for civil construction in Ago-Iwoye, Southwestern Nigeria. African Journal of Pure and Applied Sciences, 1(1), 78–84.
- Osumeje, J. O., Eshimiakhe, D., Kudanmya, E. A., Ojo, I., & Lawal, K. M. (2023). Geophysical investigation of part of Ahmadu Bello University Farm, Nigeria. African Scientific Reports, 2, 49. https://doi.org/10.46481/asr.2023.2.1.49
- Prakash, S., & Jain, P. K. (2002). Engineering soil testing. Nem Chand & Bros.
- Sabtan, A. A. (2005). Geotechnical properties of expansive clay shale in Tabuk, Saudi Arabia. Journal of Asia Earth Sciences, 25(5), 747–757. https://doi.org/10.1016/j.jseaes.2004.07.003
- Salahudeen, A. B., Eberemu, A. O., Ijimdiya, T. S., & Osinubi, K. J. (2018). Foundation settlement and bearing capacity in the six geo-political zones of Nigeria. Umudike Journal of Engineering and Technology, 4(3), 53–62.
- Salgado, R., & Yoon, S. (2003). Dynamic Cone Penetration Test (DCPT) for subgrade assessment. FHWA/IN/JTRP-2002/30. Purdue University.
- Wagner, A. A. (1957). The use of the unified soil classification system by the bureau of reclamation. Proceedings, 4th International Conference on Soil Mechanics and Foundation Engineering, London (Vol. 1. pp. 125).