
 ?Mathematical formulae have been encoded as MathML and are displayed in this HTML version using MathJax in order to improve their display. Uncheck the box to turn MathJax off. This feature requires Javascript. Click on a formula to zoom.
ABSTRACT
Long-term mining activities without proper protections can cause geo-environmental problems. These problems have negative effects on the environment and agriculture, and also pose risks to the safety of local residents. This paper aims to propose an assessment system with authority and practicality for evaluating the influence of mining on the geo-environment in China. The proposed assessment system is based on the national technical specification and considers the natural conditions of the mining area. The study area for this research is the Huodong Mining Area (HMA) in Shanxi Province, China. To evaluate the impact of mining activities on the geo-environment, an assessment system with 5 criteria and 17 factors was established. The weights of the criteria and factors were calculated using the Analytic Hierarchy Process (AHP) method. The membership degrees of impact factors to the evaluation grades were determined using the Fuzzy Comprehensive Evaluation (FCE) method. The evaluation results of each divided element were then combined to obtain the final evaluation results for the entire study area. The final results demonstrate that the geo-environment in the HMA has been significantly affected by mining activities.
1. Introduction
China’s economy is heavily reliant on coal, which makes up more than 70% of the country’s energy mix. Over 45% of the coal production is used in the industrial sector, and the remaining portion is used to generate electricity (Jiang et al., Citation2023). Among China’s 34 first-level administrative regions, Shanxi Province holds the top position in both total and annual coal production, extracting over one-third of the country’s coal reserves (C. Zhang et al., Citation2023). By the end of 2022, over 1 × 10¹¹ t of coal resources have been exploited in Shanxi Province.
The mining of coal resources in Shanxi Province has contributed to China’s economic development. However, long-term mining without proper protection measures has caused significant geo-environmental problems, such as devastation of landforms and landscapes, occupation of land resources, breakage of groundwater aquifers, and frequent occurrence of geo-disasters (Huang et al., Citation2012; X. Wang et al., Citation2020). Despite local mining enterprises’ reluctance to admit it, the field investigation of 1035 coal mines in the entire Shanxi Province conducted by our research group has revealed that mining activities have occupied 1488 km2 land resources and contaminated 5248 km2 groundwater aquifers. Additionally, 1924 locations have been destroyed by geo-disasters. These geo-environmental problems not only have a negative impact on the environment and agriculture, but also pose a threat to the safety of miners and local residents. To maintain a sustainable framework while exploiting mineral resources, it is necessary to establish a proper assessment system to evaluate the impact of mining on the geo-environment (Castilla-Gómez & Herrera-Herbert, Citation2015; Gorman & Dzombak, Citation2018).
Commonly used methods in the assessment system include the comprehensive index method, the AHP method, and the FCE method (Bascetin, Citation2007; J. He et al., Citation2021; Shen et al., Citation2021). The AHP method is favoured over the comprehensive index method due to its structured approach to decision-making, allowing for the quantification of criteria through pairwise comparisons (J. He et al., Citation2021; W. Wang et al., Citation2018). However, the application of the AHP method may lead to deviations in results, as the evaluation factors in the process are uncertain. Additionally, the expert-based AHP method introduces inherent subjectivity. To mitigate these issues, it is recommended to invite a panel of experts with diverse backgrounds and expertise to provide varied perspectives, ensuring a balanced and informed approach. Consistency checks should also be utilised to validate the judgements made. On the other hand, the FCE method addresses uncertainty and fuzziness in complex systems by employing fuzzy logic in the assessment process (Huang et al., Citation2012; Jia et al., Citation2021).
Significant efforts have been made in improving models and algorithms to obtain more accurate evaluation results. Gerassis et al. (Citation2021) utilised AI-based AutoML and Bayesian Models for the construction of environmental impact assessment system. In the study of Y. Wang et al. (Citation2021), two machine learning models, support vector machine model and the classification and regression tree model were used to evaluate the ecological environment in Gongyi mining area, China. Based on the game theory combined with Analytic Network Process and Coefficient of Variation, Wu et al. (Citation2022) evaluated the ecological and geological environment quality in the mineral exploitation area of Tonghua City, China. While these studies show that improved models and algorithms can lead to more precise evaluation results, this accuracy holds importance primarily for scientific research rather than practical management of mines (Xi et al., Citation2021). The complexity and intricacy of these models and algorithms pose challenges for local mining enterprises and government managers in learning and utilising them. Consequently, the assessment system with simple and user-friendly models and algorithms is more effective when applied to practical problems.
China initiated the evaluation of geo-environmental issues resulting from mining activities in the 1990s. Despite the early initiation of studies, few studies have been done to develop an assessment system with the criteria aligned with national specifications. When establishing the framework for an assessment system, experts often use different evaluation criteria, leading to variations in final evaluation results. Liu et al. (Citation2016) studied the impact of mining on the environment in the Yangquan Coal Mine in Shanxi Province, China, using land use and landform changes as the assessment criteria. Their finding indicated that the mine was maintained in a favourable environment. Wan and Zhao (Citation2021) utilised the ecological restoration, artificial assisted restoration, and ecological agriculture as three criteria to evaluate the environmental conditions of the Yangquan Coal Mine. Their conclusion suggested that the environment of the mine was moderately impacted by mining.
The primary aim of this paper is to develop an assessment system with multi-criteria that are fully based on national specifications. Under the criteria, the paper proposes specific social and natural factors to quantitatively evaluate the influence of mining on the geo-environment. The research introduced in this paper was conducted in collaboration with local government and mining enterprises in the Huodong concentrated mining area, Shanxi Province, China. To ensure practicality and ease of use, the system employed AHP and FCE methods due to their simplicity and user-friendly nature, avoiding the use of complex models and algorithms.
2. Description of the study area
2.1. Location and coal mines in the study area
Shanxi Province, renowned as abundant coal deposits and extensive coal production, is located between latitudes 34°34’−40°43’N and longitudes 110°14’-114°33’E (see ). It is 290 km long from east to the west and 590 km wide from north to south, with a total area of 1.56 × 10⁵ km2. Two-thirds of China’s provinces rely on coal sourced from Shanxi province for their energy needs. Shanxi province has 12 concentrated mining areas including the HMA and other 11 mining areas (see ).
Figure 1. Location of the study area: (a) map of China; (b) map of Shanxi Province; and (c) satellite image from national platform for common geospatial information service (https://www.Tianditu.gov.cn/), showing the location of the HMA. The reference coordinate system in (a) is WGS84. The figure was created using ArcGIS ver.10.8 (https://www.esri.com/).
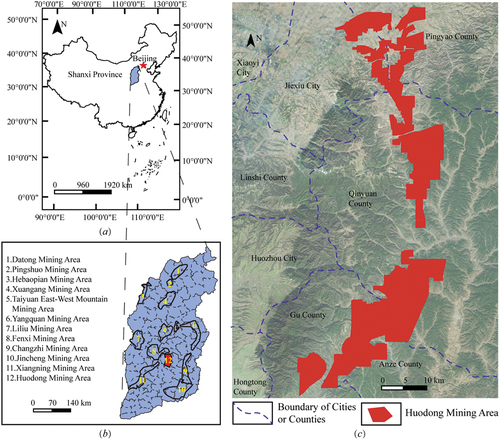
HMA is selected as the study area, which is a concentrated mining area at the eastern foot of Taiyue Mountain in Shanxi Province. HMA is situated between latitudes 36°56’−37°18’N and longitudes 111°21’-111°56’E, with an area of 1 × 10³ km2 (see ). The mining area comprises 65 coal mines, covering an area of 560.60 km2. Among the 65 coal mines, 49 are still in operation, while 12 are currently closed for reconstruction. Additionally, four coal mines have been decommissioned. These 65 mines have an annual production capacity of 39.75 × 10⁶ t.
As shown in , five city-county-level administrative regions, including Pingyao County, Jiexiu City, Qinyuan County, Gu County and Anze County, share the territorial jurisdiction of the HMA. Out of the 65 coal mines, 7 are located in Pingyao County, 10 in Xiujie City, 11 in Guxian County, 4 in Anze County, and the remaining 33 in Qinyuan County.
2.2. Geological condition of the study area
Taiyue Mountain lies in the middle and south part of Shanxi Province, with the highest elevation of 2532 m. As part of the Taiyue Mountain range, the HMA is a middle-low mountain with the elevation ranging from 590 m to 2346.8 m. The highest point in the study area is the Laoyeding Peak, while the lowest point is the Jianhe Valley.
As shown in , the HMA is long and narrow in shape, approximately 80 km long and 2 km wide at its widest point. Huoshan anticline in the west and Qinshui depression in the east jointly control the distribution of the mining area, forming a main fold in the north-north-east direction with a series of smaller faults and folds in the north-north-east direction and north-west direction.
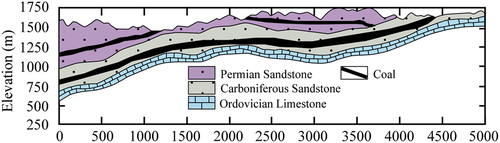
The exposed strata in the mining area consist of Paleozoic Ordovician limestone, Carboniferous sandstone with coal, Permian sandstone with coal, and Quaternary loose sediments (see ). The coal-bearing strata found in the mining area mainly consist of the Taiyuan Formation and the overlying Shanxi Formation, which were deposited during the Carboniferous and Permian periods in the intracratonic paralic setting of the North China Plate and are currently preserved in a sequence of thrust-related folds (B. Sun et al., Citation2022). The Taiyuan Formation strata distribute in the central and southern mining areas, whereas the Shanxi Formation strata are found in the northern and western mining areas. The former strata contain 11–15 coal seams in the central mining area and 5–7 coal seams in the southern mining area. The latter ones contain 1–6 coal seams in the northern mining area and 3–6 coal seams in the western mining area.
Figure 2. Typical strata profile of the HMA.
3. Geo-disasters caused by mining
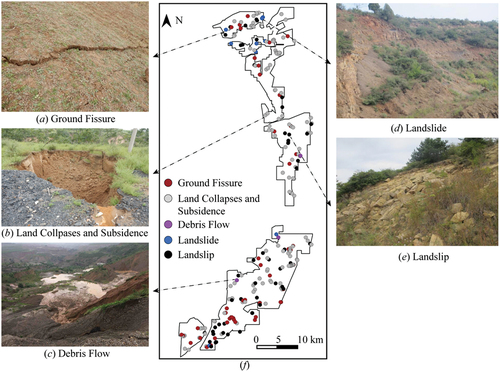
The ‘Specification for risk assessment of geological hazard’ (GB/T 40,112–2021), issued by the Chinese National Certification and Accreditation Administration (CNCA) and the Standardization Administration of China (SAC), provides the classification of geo-disasters, including ground fissure, ground collapse and subsidence, debris flow, landslide, and landslip (CNCA & SAC, 2021). Ground collapse can be further categorised into karst collapse and mine-out area collapse. It is important to note that ‘landslide’ and ‘landslip’ are often confused. Landslide refers to the downward movement of rock, debris, and soil, while landslip, also known as collapse or crumble, describes the sudden and steep tipping movement of rock and soil on a steep hillside due to gravity.
According to an official document issued by the Government of Huozhou City (GHC), the majority of geo-disaster sites in the study area are closely related to coal mining activities (GHC, Citation2022). Geo-disasters induced by coal mining activities have been noticeably increasing since the 1970s. By the early 2000s, local mining enterprises began to use the long-wall integrated mechanised mining method for coal extraction. However, the advanced technology with environmental protection measures lagged behind. For example, roof management still relied on the all-caving method, resulting in extensive geo-disasters. Our research group conducted a field investigation in 2022 and identified 42 ground fissures, 121 ground collapses and subsidence, 3 debris flows, 9 landslides, and 46 landslips in the study area. As shown in , the aforementioned five types of geo-disasters are widely distributed throughout the entire mining area; especially, coal mining subsidence has the largest number, accounting for 54.75% of all geo-disasters.
Figure 3. Distribution and photos of geo-disasters: (a) photo of a typical ground fissure; (b) photo of a typical coal mining subsidence site; (c) photo of a typical debris flow; (d) photo of a typical landslide; (e) photo of a typical collapse; and (f) distribution of geo-disasters in the HMA. The figure was created using ArcGIS ver.10.8 (https://www.esri.com/).
4. Methods
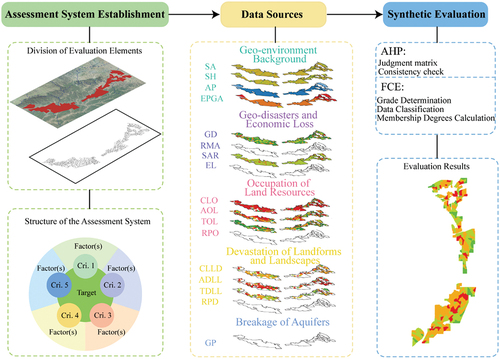
The whole evaluation process can be generalised into three steps. As shown in , the work in the first step includes the division of evaluation elements and the establishment of the structure of the assessment system. In the second step, data on impact factors are collected. In the final step, the influence of mining on the geo-environment in each divided element is evaluated using AHP and FCE methods. AHP method includes the establishment of the judgement matrix and the check of consistency. FCE method includes the determination of grades, the classification of data, and the calculation of membership degrees. The overall evaluation is finally determined by combining the results from each element.
Figure 4. Pseudo-flowchart of the methodological approach.
4.1. Establishment of the assessment system
4.1.1. Division of evaluation elements
The division of evaluation elements in geo-environment assessment is a process of organising and classifying large, complex, and diverse data (B. Wang, Citation2019). The most common referred methods of division in geo-environment assessment are primarily based on landforms and landscapes, administrative regions, land use types, watershed, and regular grids (Gebre et al., Citation2021; Lin et al., Citation2022). A proper division method not only enhances the efficiency of evaluation but also guarantees the logic and accuracy of results. To better effectively incorporate various factors and provide a more accurate and comprehensive reflection of the geo-environmental conditions in the HMA, the division method based on the watershed was selected in this study. Watersheds were delineated from digital elevation model (DEM) data with the scale of 1:50000. The minimum number of cells that constitute a stream (the threshold value) was set to be 3 × 3. The division was realised using the Hydrology Analyst Tool in ArcGIS 10.8. The flowchart of the division of elements is shown in . A total of 389 elements were divided based on watersheds (see ).
Figure 5. The flowchart of the division of evaluation elements based on watershed.
Figure 6. Evaluation elements of the geo-environment assessment system in the HMA. The figure was created using ArcGIS ver.10.8 (https://www.esri.com/).
4.1.2. Structure of the assessment system
The assessment system is structured into three layers from the inside to the outside. The inner layer, also known as the target layer, is used to determine the objective of a task. The middle layer, known as the criterion layer, is set to provide the criteria for evaluating the factors in the outer layer. The outer layer, known as the factor layer, consists of the factors that influence the geo-environment. As shown in , the objective in the inner layer focuses on assessing the impact of mining on the geo-environment in the HMA.
Figure 7. Evaluation framework of the assessment system for the influence of mining on the geological environment. Inner layer: target layer; middle layer: criterion layer; outer layer: factor layer.
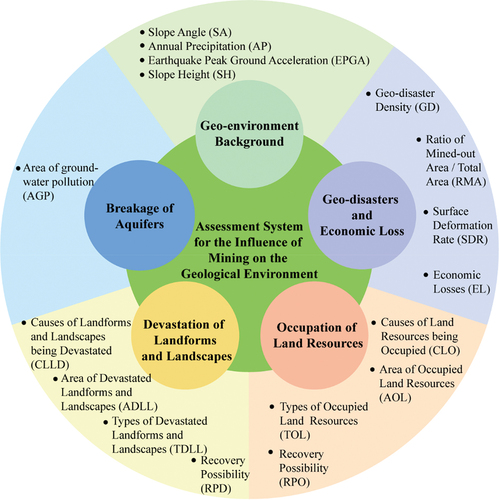
The principles for selecting evaluation criteria and factors for the impact on the geo-environment are based on alignment with national technical specifications, consideration of the mining area’s natural conditions, and the comprehensive coverage of socio-economic and environmental aspects. The criteria in the middle layer are based on an official document ‘Technical specification for ecological restoration of mines- Part 2: Coal Mine’ (TD/T 1070.2–2022), which was issued by the Ministry of Natural Resources (MNR) in China (MNR, Citation2022). This document outlines the fundamental principles of reclamation and specifies the criteria for assessing the geo-environment of mines. These principles include geo-environment background, geo-disasters and their resulting economic losses, occupation of land resources, devastation of landforms and landscapes, and breakage of aquifers, which were utilised as the criteria in our study (see ). However, more detailed factors under these principles have not yet been provided in the specification, as mining activities vary significantly between mines. One of the purposes of this study is to propose detailed socio-natural factors.
The geo-environment of mines is not controlled by one single factor, but by multiple socio-natural factors. Based on previous literature (Wu et al., Citation2022; Xi et al., Citation2021), geological condition of the HMA, and data collected by our research group, 17 factors were finally selected to form the outer layer of the assessment system (see ). These 17 factors include slope angle (SA), slope height (SH), annual precipitation (AP), earthquake peak ground acceleration (EPGA), geo-disaster density (GD), ratio of mined-out area to total area (RMA), surface deformation rate (SDR), economic losses (EL), causes of land resources being occupied (CLO), area of occupied land resources (AOL), types of occupied land resources (TOL), recovery possibility of occupied land resources (RPO), causes of landforms and landscapes being devastated (CLLD), area of devastated landforms and landscapes (ADLL), types of devastated landforms and landscapes (TDLL), recovery possibility of devastated landforms and landscapes (RPD), and area of groundwater pollution (AGP). As shown in , SA, SH, AP, and EPGA are under the criterion of geo-environment background; GD, RMA, SDR, and EL are under the criterion of geo-disasters and economic losses; CLO, AOL, TOL, and RPO are under the criterion of occupation of land resources; CLLD, ADLL, TDLL, and RPD are under the criterion of devastation of landforms and landscapes; AGP is the unique factor under the criterion of breakage of aquifers.
In addition to the 17 factors mentioned, various socio-natural factors such as faults, lithology, vegetation coverage, soil quality, groundwater withdrawal and number of local residents can also influence the geo-environment in mines. However, when evaluating the effects of mining on the geo-environment, it is neither practical nor essential to consider every factor, due to the differing significance of impact factors and the constraints of available data that can be collected. Therefore, only the 17 factors outlined above are utilised in this evaluation.
4.2. Data sources
Due to a confidential agreement, the data of RMA, EL, RPO, RPD, and AGP collected from local mining enterprises are not presented in this paper. Other remaining 12 factors, including SA, SH, AP, EPGA, GD, SDR, CLO, AOL, TOL, CLLD, ADLL, and TDLL, are shown in .
Figure 8. Spatial distribution maps of 12 evaluation factors in the HMA: (a) slope angle; (b) slope height; (c) annual precipitation; (d) earthquake peak ground acceleration; (e) geo-disaster density; (f) surface deformation rate; (g) causes of land resources being occupied; (h) area of occupied land resources; (i) types of occupied land resources; (j) causes of landforms and landscapes being devastated; (k) area of devastated landforms and landscapes; and (l) types of devastated landforms and landscapes. The figure was created using ArcGIS ver.10.8 (https://www.esri.com/).
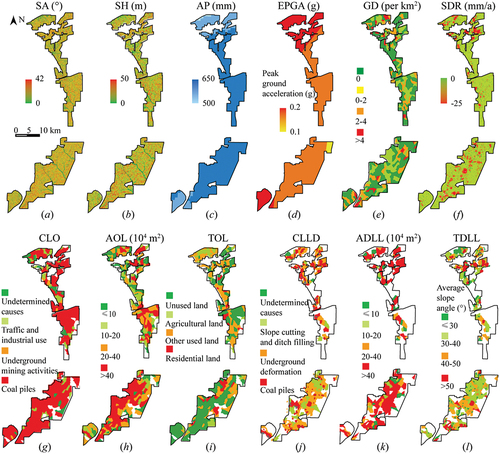
SA and SH are factors that represent the topographic variations in the study area, derived from DEM data (see . The DEM data with a spatial resolution of 30 m were obtained from Version 3 of the Advanced Spaceborne Thermal Emission and Reflection Radiometer Global Digital Elevation Model (ASTER GDEM V3) datasets, which were downloaded from the Geospatial Data Cloud Platform (https://www.gscloud.cn/).
AP is the factor reflecting the spatial distribution of the basic climate conditions in the study area. The data for AP were derived from average rainfall measurements spanning from 1960 to 2010, sourced from the Resource and Environment Science and Data Center (https://www.resdc.cn/). The Kriging interpolation was used in ArcGIS 10.8 to generate .
The EPGA is the factor for evaluating the seismic damage in the study area. The data of EPGA were downloaded from online national technical specification datasets ‘Seismic ground motion parameters zonation map of China’ (GB18306–2015) (https://www.gb18306.net/). The Kriging interpolation was used in ArcGIS 10.8 to generate .
GD and SDR are factors for evaluating the influence of geo-disasters on the geo-environment. The distribution of GD shown in was obtained by calculating the number of geo-disaster events per square kilometre within each divided element. shows the distribution of the accumulated SDR in the study area, which was derived from points with coherence coefficient larger than 0.35. No interpolation method was applied to generate . The SDR time series for the study area during the period of 2016–2018 were based on Sentinel-1 satellite SAR datasets, which were downloaded from the Copernicus Data Space Ecosystem (https://dataspace.copernicus.eu/).
CLO, AOL, and TOL are factors under the criterion of occupation of land resources. As shown in , traffic and industrial construction, underground mining activities, coal piles and other undetermined mining activities are the primary causes contributing to land resource occupation and degradation. The distribution of CLO, shown in , was obtained by identifying the causes of land occupation within each element. The distribution of AOL, shown in , was obtained by totalling the occupied land area within each element. In , class limits of 10 × 104, 20 × 104, 40 × 104 were selected for classification after consulting with experts. The distribution of TOL, shown in was obtained by aggregating the occupied land types within each element. As shown in , occupied lands can be categorised into unused land (waste land), agricultural land, residential land, and other types of land.
CLLD, ADLL, and TDLL are factors assessing the impact of mining on landforms and landscapes. The distributions of CLLD and ADLL are shown in , respectively. In , slope cutting and ditching filling, underground deformation, coal piles, and other undetermined factors are the main causes leading to the devastation of landforms and landscapes. The classification of ADLL in utilises the same class limits of 10 × 104, 20 × 104, 40 × 104 as in . The distribution of TDLL, shown in , integrates the types of devastated landforms and landscapes within each element. As shown in , the average angle of the slope serves as an indicator for classifying TDLL into four categories based on angle ranges: less than 30°, between 30° and 40°, between 40° and 50°, and greater than 50°. Although the slope angles are utilised in , they are applied for different purposes. The slope angle in is used for classifying TDLL, whereas the angle in is used to evaluate the susceptibility of geo-hazards in the study area.
The data of CLO, AOL, TOL, CLLD, ADLL, and TDLL were obtained by visual interpretation from RS images of Gaofen-2 (GF-2) satellite. The GF-2 satellite was the first civil optical RS satellite designed and developed by China Academy of Space Technology. It is capable of collecting satellite imagery with a ground sampling distance of 0.8 m panchromatic and 3.2 m multispectral bands on a swath of 45 km (Yu et al., Citation2021). In this study, the GF-2 RS image was acquired on 2 February 2021. The datasets were provided by the Geographic Remote Sensing Ecological Network Platform (www.gisrs.cn).
4.3. Synthetic evaluation
The influence of selected factors on the geo-environment in each divided element was analysed using AHP and FCE methods. The weights of criteria and factors were calculated by AHP method. The membership degrees of impact factors to evaluation grades in each divided element were determined by FCE method. The synthetic evaluation result for the whole study area was finally obtained by combining the evaluation results of each element.
(1) AHP method
AHP is a reliable, rigorous, and robust decision-making method, which operates under the assumption that complex decision-making problems can be effectively managed by structuring them into clear and comprehensible hierarchical structures (Saaty, Citation1977; Sadiq & Solomon, Citation2009; Tavana et al., Citation2023; R. Zhang et al., Citation2023). Two steps make up the AHP weight calculation process: the judgement matrix and the consistency check.
A judgement matrix is utilised to compare each element within a constructed hierarchy structure in a pairwise manner with the aim of equalising the relative priorities of the elements. The general form of a judgement matrix is as follows:
where A is the judgement matrix; xij=δi/δj (i = 1, 2, … , n; j = 1, 2, … , n) represents the relative importance of the ith criterion over the jth criterion, which is provided by experts according to Saaty’s nine-point scale (see ); n is the order of the judgement matrix.
Table 1. Scale of importance of binary comparison (Saaty, Citation1977)
To avoid self-contradictory or non-compliant situations and to ensure the rationality of the weights derived from the application of the AHP method, it is necessary to check the importance of each alternative factor. The testing process is carried out using the following equations:
where W and λmax are the eigenvector and the principal eigenvalue of the judgement matrix A, respectively; ωi (i = 1, 2, … , n) is the weight set of factors or criteria; CI is the consistency index; CR is the consistency ratio; RI is the mean randomness index.
The value of RI in EquationEquation (5)(5)
(5) is related to the order of the matrix established. For example, if A is a square matrix of order 5 × 5, the RI will be 0.89. The specific values of RI for n ranging from 1 to 10 are given in (W. Wang et al., Citation2018). The value of CR calculated by EquationEquation (5)
(5)
(5) is used to validate the consistency of the judgements by experts. When CR is smaller than 0.1, the consistency test is passed, and the eigenvector W with the weight set is acceptable. Otherwise, the judgements should be modified until the criterion of CR < 0.1 is satisfied.
Table 2. Values RI of judgement matrix (W. Wang et al., Citation2018).
(2) FCE method
The impact factors in assessing the geo-environmental influence on mines are always complex, uncertain, and fuzzy. The FCE method is an approach for tackling uncertain and fuzzy boundary issues. It focuses on quantifying the impacts of various factors in a comprehensive manner and utilises membership functions to decrease the fuzziness (J. Sun et al., Citation2006; Zadeh, Citation1978). The evaluation process using FCE can be divided into three steps: the determination of grades for evaluation, the classification of data based on determined grades, and the calculation of membership degrees of each factor to the evaluation grade.
The evaluation grades are determined based on expert advice and the actual research area conditions. Increasing the number of grade divisions yields more detailed results, but it also requires a higher workload. Three to five grade divisions are commonly utilised in the evaluation process. The evaluation set representing the grades is shown as follows:
where vi (i = 1, 2, … , z) represents the grades for evaluation. In this study, four grade divisions (mild, moderate, severe, and very severe) were defined to assess the effects of mining.
The attribute values of factors are classified into distinct parts that correspond to the number of grades. The principle of classification in this study is primarily based on the experience of experts and unpublished technical reports provided by local mining enterprises.
Factors can be classified into two types: categorical factors, also known as qualitative factors, and numerical factors, also known as quantitative factors. The evaluation grade for each factor is expressed by the degree of membership. Experts determine the membership degree of categorical factors, while the membership function is used to calculate the membership degree of numerical factors. Various membership functions can be utilised to calculate membership degrees, with rectangular, trapezoidal, parabolic, Gaussian, Cauchy, and ridge membership functions being the most common (Prokopowicz et al., Citation2017; J. Sun et al., Citation2008). While individuals may choose membership functions differently, utilising the same one in a fuzzy evaluation can ensure a consistent representation and yield accurate and reliable results (Jia et al., Citation2021). Previous studies (Gao et al., Citation2021; Zhou & Chan, Citation2017) have shown that the trapezoidal membership function is frequently used in assessing the elevation of the geo-environment in mines, which is also used in our study. The trapezoidal membership function is shown as follows:
where µ1, µ2, µ3, µ4 represent calculated membership degrees ranging from 0 to 1, corresponding to the grades of mild, moderate, severe, and very severe, respectively; yi is the measured value (actual data) of impact factors; ai, bi, ci, di are the standard values corresponding to the grades of mild, moderate, severe, and very severe, respectively. When dealing with factors that have interval attribute values, the upper limit of the interval for the mild grade is assigned as the value of ai, whereas the lower limit for the very severe grade is assigned as the value of di. For the moderate and severe grades, bi and ci are determined by calculating the average of the lower and upper limits within each interval, respectively. It is important to note that this method of assigning values applies specifically to factors with positive attribute values. For factors with negative values, such as SDR, ai is determined by the lower limit of the interval for the mild grade, while di is determined by the upper limit for the very severe grade. The method of assigning values for bi and ci remains the same as that for factors with positive attribute values.
By considering the membership degree of each factor, the fuzzy evaluation matrix can be constructed as follows:
where R is the fuzzy evaluation matrix; µ is the membership degree of each factor.
The result of evaluation within each element can be obtained by multiplying the weight and the membership degree of impact factors (or criteria), shown as follows:
where B is the matrix of the ranking grade of the evaluation objective; W is the matrix of weights.
The grade of each element is determined according to the maximum membership degree principle of the fuzzy theory. The overall evaluation result of the study area was determined by combining the evaluation results of each element.
5. Results
5.1. Weights of factors and criteria calculated by AHP method
The calculation of weights of factors and criteria were conducted using Equationequations (1)(1)
(1) -(Equation5
(5)
(5) ). Python and its libraries AHPy, Pandas and NumPy were utilised for the calculation. After passing through the consistency check, the calculated weights were obtained and presented in .
Table 3. Weights of criteria and factors.
Yij represents the jth factor under the ith criterion; ωij represents the weight of the jth factor under the ith criterion.
The calculated weights in can be expressed in the matrix form, as follows:
where WYI, WY2, WY3, WY4, WY5 are weight matrices of factors under the criteria, respectively; WY is the weight matrix of the criteria.
5.2. Evaluation by FCE method
To study the influence of factors with different attribute values and to standardise the evaluation criteria, attribute values of every factor were classified into the aforementioned four grades (see ). The grades ‘mild’, ‘moderate’, ‘severe’ and ‘very severe’ were assigned scores 1, 2, 3, and 4, respectively.
Table 4. Classification of attribute values of factors.
Element No.3 was randomly selected out of 389 elements as an example to show the evaluation process using the FCE method. Python, along with the Scikit-fuzzy and NumPy libraries, was utilised for calculating membership degrees.
Based on the scores provided by experts and the calculated results by using Equation (7) and Equation (8), the fuzzy evaluation matrices containing the information of membership degrees for the factors to the grades were obtained as follows:
where RYI, RY2, RY3, RY4, RY5 represent the fuzzy evaluation matrices of the factors under five criteria, respectively.
The assessment system considered the importance of grades for both factors and criteria, resulting in a two-level evaluation structure. In the first-level evaluation, the matrices of ranking grades for factors were calculated by using EquationEquation (9)(9)
(9) . In the second-level evaluation, membership degrees in the matrices of ranking grades for factors were integrated into the fuzzy evaluation matrix for criteria. The matrix of ranking grades for all criteria in the second-level evaluation was also determined using EquationEquation (9)
(9)
(9) , which provided the membership degree for the final assessment of the influence of mining on the geological environment in each divided element.
(1) First-level evaluation
Evaluation results of the factors under five corresponding criteria are shown as follows:
where BY1, BY2, BY3, BY4, BY5 are the matrices of ranking grades for factors under five criteria, respectively.
The maximum membership degrees in BY1, BY2, BY3, BY4, BY5 are 0.87, 0.64, 0.73, 0.78, and 1, respectively. Based on the maximum membership degree principle of the fuzzy theory, the corresponding grades are ‘mild’, ‘mild’, ‘moderate’, ‘mild’, and ‘mild’. The evaluation results indicate that factors under the criteria of ‘geo-environment background’, ‘geo-disasters and economic loss’, ‘devastation of landforms and landscapes’, and ‘breakage of aquifers’ have mild impacts on the geo-environment, while factors under the criterion of ‘occupation of land resources’ have a moderate impact on the geo-environment.
(2) Second-level evaluation
The fuzzy evaluation matrix for all criteria is composed of calculated membership degrees in BY1, BY2, BY3, BY4, and BY5, shown as follows:
where RY is the fuzzy evaluation matrix for the criteria.
The evaluation result of the criteria is shown as follows:
where BY is the matrix of ranking grades for criteria.
The result in EquationEquation 14(14)
(14) shows that the membership degree of all the criteria belongs to the grade of ‘mild’, indicating that mining activities in Element No.3 have mild influence on the geo-environment in the selected elements.
5.3. Combination of results
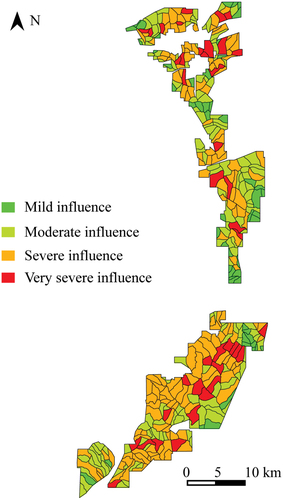
By combining the evaluation results of each element, the synthetic evaluation result for the entire study area was finally obtained (see ). The impact of mining on the geo-environment of each element was classified using four different colours, as shown in . Green indicates a mild effect of mining activities on the geo-environment. Cyan indicates a moderate effect, while orange indicates a severe effect. Red indicates a very severe effect on the geo-environment of the selected element in the study area.
Figure 9. Evaluation result of the influence of mining on the geo-environment in the HMA.
6. Discussion
6.1. Analysis of the evaluation result
The evaluation result suggests that mining has significantly impacted the geo-environment in the HMA. As shown in , out of the total 389 elements analysed, only 54 (13.87%) show a mild influence from mining. However, a notable number of elements, specifically 145 (10.80%), 148 (13.87%), and 42 (30.05%), exhibit moderate, severe, and very severe impacts from mining activities, respectively. This indicates that a majority of elements in the study area have been affected by mining. When considering the distribution of impact levels, only 51.10 km2 (9.12%) of the total area experiences mild impacts from mining. Areas with moderate, severe, and very severe impacts cover 184.50 km2, 250.11 km2, and 74.89 km2, constituting 32.91%, 44.61%, and 13.36% of the total area, respectively. This highlights that a significant portion of the study area is influenced by mining activities.
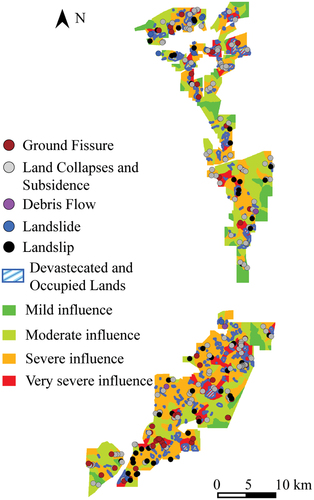
6.2. Comparison of the evaluation result and field investigations
To ensure the reliability of the evaluation, the distribution of geo-environmental problems identified in the field investigation was compared with the evaluation results. As shown in , sites with geo-environmental problems are located in areas which are very severely and severely influenced by mining activities. This simple comparison provides initial evidence that the assessment system can accurately identify areas impacted by mining activities and assess the relative degree of impact, demonstrating the reliability of the system. The assessment system has been successfully implemented by local government and mining enterprises, receiving positive feedback. However, the current comparison method mainly emphasises the spatial correlation between investigations and evaluation results, lacking adequate quantitative evidence in a more scientific manner. In our future research, our team intends to integrate additional methods, including machine learning and deep learning models, to offer a more scientifically rigorous validation of the assessment system’s reliability.
Figure 10. Evaluation results and field investigations.
6.3. Strength, weakness and remedy proposal for the assessment system
This study proposes an assessment system with both authority and practicality by referring to national technical specifications, conducting extensive field investigations, and collecting materials on actual geo-environmental conditions. After careful consideration, 5 criteria and 17 factors were selected to form the assessment system to evaluate the geo-environment of the HMA.
However, this assessment system relying on expert scores in the assessment system may introduce subjectivity. To address this issue, our group initially planned to involve at least 20 experts in scoring the evaluation system. Due to time and funding limitations, only five experts from the China Geological Survey and universities in China, along with the authors of this paper, were ultimately invited. The invited experts are professor Yang Yu, professor Cai Li, and professor Xia Li from the China Geological Survey; professor Lichun Wang and professor Yonggeng Zhang from Tianjin University. The average scores provided by the experts were then utilised in the assessment system.
It is recommended that researchers focus on gathering more reliable materials and involving a sufficient number of experts in future studies utilising this assessment system.
7. Conclusion
The study presents a multi-criteria assessment system for evaluating the impact of mining on the geo-environment, with a focus in the HMA, Shanxi Province, China. The system, developed in accordance with national technical specifications, employs AHP and FCE to quantify the effects of mining across 17 factors categorised under five criteria.
Based on the aforementioned contents, the following conclusions can be drawn:
The evaluation results indicate that over half of the total area in the HMA has been severely and very severely impacted by mining activities, highlighting the significant effects of mining on the geo-environment. The current situation in the HMA reflects the challenges faced by numerous mines in China. Managing mining activities to protect the geo-environment is a crucial issue that requires attention in China.
AHP and FCE, commonly used methods in decision-making systems with multiple factors, are effectively utilised in our assessment system to provide quantitative and comprehensive tools for evaluating the impact of mining on the geo-environment.
The assessment system, which relies on expert scores, may be subject to bias. To mitigate this, it is essential to gather more reliable data and invite an adequate number of experts.
Considering practicality and applicability, we do not recommend complex models and complicated calculations in the assessment system. Although they may yield better results, the urgency and importance of application outweigh the potential gains.
Author contributions
All authors worked collectively. Data curation, formal analysis, investigation, and methodology, T.Q.; conceptualisation, funding acquisition and project administration, T.Q.; validation and visualisation, D.N. and H.W.; resources and supervision, C.Z.
Disclosure statement
No potential conflict of interest was reported by the author(s).
Additional information
Funding
References
- Bascetin, A. (2007). A decision support system using analytical hierarchy process (AHP) for the optimal environmental reclamation of an open-pit mine. Environmental Geology, 52(4), 663–672. https://doi.org/10.1007/s00254-006-0495-7
- Castilla-Gómez, J., & Herrera-Herbert, J. (2015). Environmental analysis of mining operations: Dynamic tools for impact assessment. Minerals Engineering, 76, 87–96. https://doi.org/10.1016/j.mineng.2014.10.024
- Gao, J., Yao, J., & Chen, L. (2021). The statistical methods of membership function in structural serviceability failure criterion. KSCE Journal of Civil Engineering, 25(11), 4314–4321. https://doi.org/10.1007/s12205-021-2089-z
- Gebre, S. L., Cattrysse, D., Alemayehu, E., & Orshoven, J. V. (2021). Multi-criteria decision making methods to address rural land allocation problems: A systematic review. International Soil and Water Conservation, 9(4), 490–501. https://doi.org/10.1016/j.iswcr.2021.04.005
- Gerassis, S., Giráldez, E., Pazo-Rodríguez, M., Saavedra, Á., & Taboada, J. (2021). AI approaches to environmental impact assessments (EIAs) in the mining and metals sector using AutoML and bayesian modeling. Applied Sciences, 11(17), 7914. https://doi.org/10.3390/app11177914
- GHC. (2022). 14th five-year plan for geo-disaster prevention and control in Huozhou City. http://www.huozhou.gov.cn/zfxxgk/zcwj/bgswj/202212/t20221216_110641.html, accessed on 2024-2-17. (in Chinese.
- Gorman, M. R., & Dzombak, D. A. (2018). A review of sustainable mining and resource management: Transitioning from the life cycle of the mine to the life cycle of the mineral. Resources, Conservation & Recycling, 137, 281–291. https://doi.org/10.1016/j.resconrec.2018.06.001
- He, J., Liu, S., Li, W., Qiao, W., Yang, Z., Wang, Q., & Zhang, H. (2021). Operating environment assessment of the coalface in underground coal mining based on analytic hierarchy process (AHP) and matter-element theory (MET). Geofluids, 1–8. https://doi.org/10.1155/2021/9083547
- Huang, S., Li, X., & Wang, Y. (2012). A new model of geo-environmental impact assessment of mining: a multiple-criteria assessment method integrating fuzzy-AHP with fuzzy synthetic ranking. Environmental Earth Sciences, 66(1), 275–284. https://doi.org/10.1007/s12665-011-1237-z
- Jia, H., Liu, J., Yin, X., Wang, C., Geng, H., Chi, H., & Tang, S. (2021). Ecological evaluation of the Tongling pyrite mining district in Anhui Province. Earth Science Frontiers, 28(4), 131–141. (in Chinese.
- Jiang, T., Zhang, R., Zhang, F., Shi, G., & Wang, C. (2023). Assessing provincial coal reliance for just low-carbon transition in China. EIA Review, 102, 107198–107207. https://doi.org/10.1016/j.eiar.2023.107198
- Lin, S., Xie, J., Deng, J., Qi, M., & Chen, N. (2022). Landform classification based on landform geospatial structure- a case study on loess plateau of China. Int J Digit Earth, 15(1), 1125–1148. https://doi.org/10.1080/17538947.2022.2088874
- Liu, X., Fu, J., Niu, H., Zhang, H., & Liu, W. (2016). Analysis on changes of land use structure and assessment of landscape comprehensive stability in Yangquan 1st mine. Journal of China Coal Society, 41(3), 719–726. (in Chinese.
- MNR. (2022). Technical specification for ecological restoration of mines- part 2: Coal mine. http://gi.mnr.gov.cn/202207/t20220725_2742733.html, accessed on 2023-12-31. (in Chinese.
- Prokopowicz, P., Czerniak, J., Mikołajewski, D., Apiecionek, L., Slezak, D. (2017). Theory and applications of ordered fuzzy number. In J. Kacprzyk Studies in fuzziness and soft computing (p. 322). Springer Charm.
- Saaty, T. L. (1977). A scaling method for priorities in hierarchical structures. Journal of Mathematical Psychology, 15(3), 234–281. https://doi.org/10.1016/0022-2496(77)90033-5
- Sadiq, R., & Solomon, T. (2009). Environmental decision-making under uncertainty using intuitionistic fuzzy analytic hierarchy process (IF-AHP). Stochastic Environmental Research and Risk Assessment, 23(1), 75–91. https://doi.org/10.1007/s00477-007-0197-z
- Shen, L., Jing, G., Zeng, Q., & Cavallaro, F. (2021). Online evaluation method of coal mine comprehensive level based on FCE. PLoS One, 16(8), e0256026. https://doi.org/10.1371/journal.pone.0256026
- Sun, B., Shao, Y., Gao, Z., Li, J., Sun, B., Yang, M., Zhou, J., Yao, H., Sun, F., & Shao, L. (2022). Coalbed methane enrichment characteristics and exploration target selection in the zhuozishan coalfield of the western ordos basin, China. American Chemical Society Omega, 7(48), 43531–43547. https://doi.org/10.1021/acsomega.2c04141
- Sun, J., Mou, Z. G., & Zhang, X. (2006). Analysis of the fuzzy reliability in geotechnical engineering based on choosing the membership functions. Geotechnical Engineering Technique, 20(4), 200–207. (in Chinese.
- Sun, J., Zhang, X., & Mou, Z. G. (2008). Analysis of effect of different membership function on calculation of fuzzy reliability in underground continuous wall. Rock and Soil Mechanics, 29(3), 838–840. (in Chinese.
- Tavana, M., Soltanifar, M., & Santos-Arteaga, F. J. (2023). Analytical hierarchy process: revolution and evolution. Annals of Operations Research, 326(2), 879–907. https://doi.org/10.1007/s10479-021-04432-2
- Wan, Y., & Zhao, Q. (2021). Research on ecological environment protection of mining area based on Yangquan No. 3 mine. IOP Conference Series: Earth and Environmental Science, 781(3), 032001. https://doi.org/10.1088/1755-1315/781/3/032001
- Wang, B. (2019). Geo-environmental quality evaluation based on GIS in Shiyan-Wudang mountain area. International Journal of Environmental Protection and Policy, 7(2), 72–79. https://doi.org/10.11648/j.ijepp.20190702.14
- Wang, W., Dai, Y., Li, K., Tang, X., & Liu, T. (2018). Development and application of mining methods optimization assistant system based on fuzzy-AHP. Gold Science and Technology, 26(3), 312–317. (in Chinese.
- Wang, X., Jiao, S., & Wang, A. (2020). Effect of coal resources mining on soil quality evaluation in huodong mining area. Geology of Chemical Minerals, 42(2), 150–154. (in Chinese.
- Wang, Y., Wu, X., He, S., & Niu, R. (2021). Eco‑environmental assessment model of the mining area in Gongyi, China. Scientific Reports, 11(1), 17549. https://doi.org/10.1038/s41598-021-96625-9
- Wu, C., Zhang, Y., Zhang, J., Chen, Y., Duan, C., Qi, J., Cheng, Z., & Pan, Z. (2022). Comprehensive evaluation of the Eco-geological environment in the concentrated mining area of mineral resources. Sustainability, 14(11), 6808. https://doi.org/10.3390/su14116808
- Xi, X., Wang, S., Yao, L., Zhang, Y., Niu, R., & Zhou, Y. (2021). Evaluation on geological environment carrying capacity of mining city – a case study in Huangshi city, Hubei Province, China. International Journal of Applied Earth Observation and Geoinformation, 102, 102410. https://doi.org/10.1016/j.jag.2021.102410
- Yu, J., Du, S., Xin, Z., Huang, L., & Zhao, J. (2021). Application of a convolutional neural network to land use classification based on GF-2 remote sensing imagery. Arabian Journal of Geosciences, 14(21), 2914. https://doi.org/10.1007/s12517-021-08555-5
- Zadeh, L. A. (1978). Fuzzy sets as a basis for a theory of possibility. Fuzzy Sets and Systems, 1(1), 3–28. https://doi.org/10.1016/S0165-0114(99)80004-9
- Zhang, C., Wang, P., Wang, E., Chen, D., & Li, C. (2023). Characteristics of coal resources in China and statistical analysis and preventive measures for coal mine accidents. The International Journal of Coal Science & Technology, 10(1), 22. https://doi.org/10.1007/s40789-023-00582-9
- Zhang, R., Tian, D., Wang, H., Kang, X., Wang, G., & Xu, L. (2023). Risk assessment of compound dynamic disaster based on AHP-EWM. Applied Sciences, 13(18), 10137. https://doi.org/10.3390/app131810137
- Zhou, R., & Chan, A. H. S. (2017). Using a fuzzy comprehensive evaluation method to determine product usability: A proposed theoretical framework. WORK-A Journal of Prevention Assessment & Rehabilitation, 56(1), 9–19. https://doi.org/10.3233/WOR-162474