 ?Mathematical formulae have been encoded as MathML and are displayed in this HTML version using MathJax in order to improve their display. Uncheck the box to turn MathJax off. This feature requires Javascript. Click on a formula to zoom.
ABSTRACT
Under the influence of multiple factors, such as extreme weather conditions and human activities, flash flood disasters occur frequently in China and are very difficult to predict and anticipate. Based on the national flash flood disaster investigation and assessment project, this article focuses on small (10–50 km2) catchments and extracts 83 alternative indicators from the perspectives of rainfall, underlying surfaces, present social and economic conditions, flood control capacity, wading engineering, and monitoring and early-warning facilities. A dimension reduction processing is conducted using a principal component analysis, and 10 core and independent indicators are obtained. A risk evaluation indicator system is proposed that establishes the risk cube model, which is verified with data from 53,235 historical flash flood events in China from 1949 to 2018. The results show that flash flood risk identification based on small watersheds may effectively reflect the disaster response relationship based on rainfall and the underlying surface. In addition, 91% of historical flash floods occurred in high-, medium-, and low-risk areas, and the occurrence density in high-risk areas was double of that in low-risk areas. These evaluation results provide data support for the accurate defence, forecasting and early warning of flash flood disasters in China.
RESUME
Sous l'influence de multiples facteurs, tels que les conditions météorologiques extrêmes et les activités humaines, les crues éclair se produisent fréquemment en Chine et sont très difficiles à prévoir et à anticiper. Dans le cadre d’une démarche nationale consacrée à l’analyse et à l’évaluation des crues éclair, cet article se concentre sur les petits bassins versants (10 – 50 km2 et identifie 83 indicateurs qui intègrent les précipitations, les formations géologiques, les conditions sociales et économiques, la dynamique des inondations, la capacité de gestion des crises, les équipements de suivi et les installations d’alerte. Une analyse en composantes principales a permis de réduire le nombre de variables et d’identifier 10 indicateurs synthétiques. Un système d'évaluation des risques est proposé à partir des indicateurs sélectionnés sous la forme d’un cube de risque. L’approche proposée a été validée sur 53 235 crues éclair observées en Chine de 1949 à 2018. Les résultats montrent que l'identification des risques d'inondation pour les petits bassins versants s’avère pertinente sur la base des indicateurs liés aux précipitations et aux formations géologiques superficielles. 91 % des crues historiques sont identifiées dans des secteurs diagnostiqués à risque fort, moyen ou faible et la densité d'occurrence dans les zones à haut risque est double par rapport aux zones définies à faible risque. Les résultats obtenus sont très encourageants et permettent de renforcer la stratégie opérationnelle d’identification, de prévision et d’alerte pour les crues éclair en Chine.
1. Introduction
China is affected by both a typical monsoon climate and special geological features, and the country is known to suffer from the most frequent flash floods in the world. In a country characterised by sudden extreme rainfall, sophisticated geological and topographical properties, and high population densities in the hazard areas, flash flood defence and management in China are facing great challenges that require accurate early risk identification and detailed quantitative risk analysis to support decision-making processes of emergency and crisis management at both local and national scales (Guo et al., Citation2017).
A sustainable development approach for a flood retention area can include three types of strategies: Risk is an integration of danger, exposure and vulnerability, which includes physical, social, economic, and environmental factors and many other aspects. In risk identification and evaluation, comprehensive consideration should include many risk indexes, such as rainfall intensity, flood depth and other spatiotemporal factors (Hong et al., Citation2018; Tehrany et al.,, Citation2017). In the field of flash flood risk assessment, many approaches have been applied to integrate risk identification and evaluation (e.g. the rainfall threshold statistical method (Wang & Wang, Citation2016), the index system method (Alilou et al., Citation2019), the spatial analysis method combined with remote sensing and GIS (Geological Information System) (Kia et al., Citation2012), and the multicriteria analysis method (Farzaneh et al., Citation2012). The rainfall threshold statistical method is one of the classical approaches that has been widely applied in the assessment of flash flood risk. For instance, in a flash flood risk analysis of the Nel Caine area, Wieczorek and Glade (Citation2005) extended the rainfall threshold value obtained from a local statistical analysis of historical records to evaluate the flash flood risk level of the entire study area.
With the progression of risk analysis methods, the establishment of an indicator system for risk assessment and evaluation has been considered the core of a flash flood risk analysis. An increasing number of scientists deem that the indicator system of a flash flood risk evaluation should consist of many indexes that can comprehensively represent the characteristics of local and regional natural and social and economic properties. Elkhrachy (Citation2015) established an integrated indicator system that consisted of many indexes, including river discharges, soil types, surface slope, river channel roughness, and the density of river networks for a flash flood risk analysis of Najran City in the Kingdom of Saudi Arabia. Moreover, with modelling development, in 2012, the US Hydrologic Research Center (HRC) proposed a dynamic rainfall threshold model for flash flood assessment and embedded it into its national flash flood guidance system (FFGS; Totschnig et al., Citation2011). In the same year, by analysing the relationship between hourly rainfall intensity and flash flood occurrence, Fan et al. (Citation2012) developed a modelling tool to forecast the flash flood risk in Jiangxi province, China. For a larger scale assessment, using spatial analysis techniques (GIS environment) and referencing nearly 300 years of data, including flood hazard records as well as natural and socio-economic information, Tan et al. (Citation2004) established a regional flood risk map series for China. A similar technological approach was applied for a US nature disaster map produced based on data from 1975 to 1994 (Dennis, Citation1999). In Europe, especially in the Alps region, many physical and social indicators extracted from the historical records from 1279 to 2002 were integrated to determine the spatiotemporal distribution of the flash flood risk in not only the Alps region, but also the mountainous areas of Italy (Guzzetti et al., Citation2008, Citation2005; Holub et al., Citation2012; Totschnig et al., Citation2011).
Under current conditions, most approaches for risk identification and analysis have been implemented at the regional scale. Some distribution analyses were able to provide results based on a series of computation grids that covered the targeted area. However, the resolution of those grid-maps was relatively low. Very few evaluation and analysis methods have been focused on small-sized catchments (up to 50 km2), and most such approaches have lacked the integration of detailed physical properties of the area that are driving factors at that scale. To address the challenges of flash flood management for small-sized catchments (10–50 km2) in the hilly regions of China, a new modelling and operational approach is developed in this study to support the establishment of prevention and control strategies. Based on 70 years of flash flood data collected at the national scale in China, an evaluation indicator system has been constructed and used for a new risk assessment model, termed the “risk cube”, to produce risk maps of the Chinese territory.
2. Materials and methods
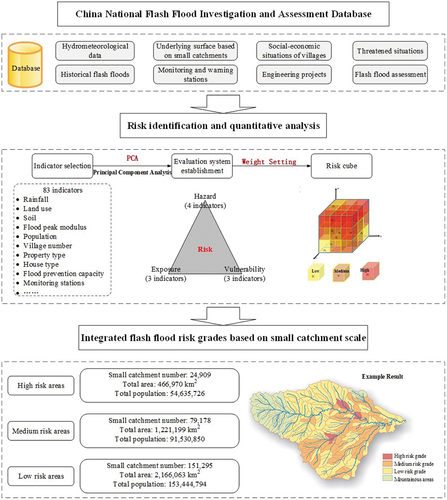
To achieve a comprehensive and consistent view of the flash flood risks in China, flash flood data were collected from 30 provinces that included information on 305 cities and 2138 counties, and covered 7.55 million km2 and more than 900 million inhabitants. The collected data covered the period from 2013 to 2016. This initiative was part of the “National flash flood disaster investigation and assessment” framework led by the central government. By classifying the data into various categories, an integrated evaluation indicator system was established and further used in an innovative model proposed in this study to quantitatively analyse the flash flood risk throughout China.
2.1. The national flash flood database
In the project called the “China national flash flood disaster investigation and assessment”, flash flood data were collected that included meteorological, hydrological, geological, and social information for 535,858 small-sized catchments (10–50 km2). A national database was established using 13 data types, 55 table formats, 30 types of spatial productions, 14 media records and seven types of files. The size of this database reached 102 TB with low-resolution historical data. In addition, the updates have reached 120 TB per year with new high-resolution data. The data used for this study are listed in and include eight categories and 23 data types.
2.2. Method
Referencing the United Nations (UN) evaluation method, the risk of flash flood (R) is a function of hazard (H) and vulnerability (V; Sven et al., Citation2012):
Moreover, the Asian Disaster Reduction Center in Japan considers that the risk of flash flood is affected by three independent elements: hazard (H), exposure (E) and vulnerability (V; Asian Disaster Reduction Center, Citation2008):
The difference between these two risk evaluation formulas is the expression of the risk elements. The UN formula considers that vulnerability is a characteristic of a community system whose flash flood vulnerability includes physical, social, and economic variables. However, the Japanese method provides more details by considering the exposure of the population and property under a certain level of hazard. Although the UN definition of vulnerability covers both the Japanese exposure and vulnerability elements, the Japanese expression is more easily understood. Hence, the evaluation of flash flood risk in China followed the Japanese expression that combined the three elements. The technical framework for this analysis is shown in .
Figure 1. Technical framework for flash flood risk identification and quantitative analysis. PCA = Principal Component Analysis.
2.3. Indicator selection
Based on the information supported by the national flash flood database, the hazard of flash flood risk was evaluated based on the meteorological values (primarily rainfall) and geological data. The exposure was quantified based on the current social and economic conditions of the targeted area. The vulnerability was determined using the integrated consideration of the current flood defence capability, including the building situation and the status of the alert equipment. In total, 83 risk elements were extracted from the database and used to identify and analyse the flash flood risk in the small-sized catchments of China ().
2.3.1. Principal component analysis
Based on the 83 indexes collected from the 255,382 small catchments with 53,235 historical flash flood records (1949–2018), a principal component analysis (PCA) was applied to extract the primary independent elements that contribute to flash flood defence and management. PCA is a classical method of multivariate statistical analysis that uses an orthogonal transformation to reduce the amount of data into a few significant data that can represent most of the information in the data set. By assuming the study focuses on P indexes, which are represented by x1, x2, x3, …, xp, the p-dimension random vector X is X = (x1, x2, x3, …, xp). Its mean value and covariance matrix are μ and ∑. Implementation then uses the linear transformation of the X matrix to a new comprehensive variable Y:
where Y1 is the first principal component that has the maximum variance of all linear combinations of the p elements. However, if the first component is not able to represent the data set, then the second component is considered. Y = (Y1, Y2, …, Ym) is constructed using the first, second, and up to the mth principal components of the original index data set.
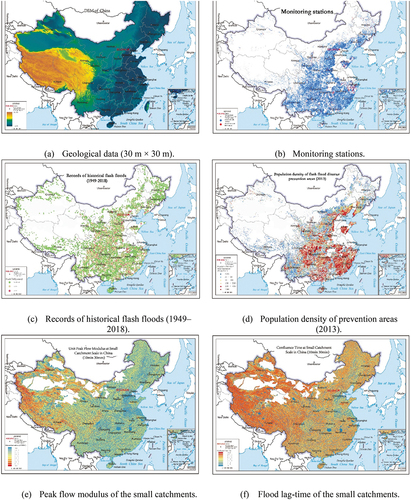
By defining a correlation coefficient of 0.6 as the threshold value, 10 principal components from three categories were extracted from the 83 indicators, as shown in . The 10 major components obtained were primarily focused on the position of the villages regarding river networks, short-term heavy rainfall properties, concentration times, flood peak modulus, hydraulic infrastructures, house types, flood prevention capacity, and monitoring and early-warning facilities. The spatial distribution of these indicators is shown in .
Figure 2. The 10 principal components extracted from the 83 selected indicators.
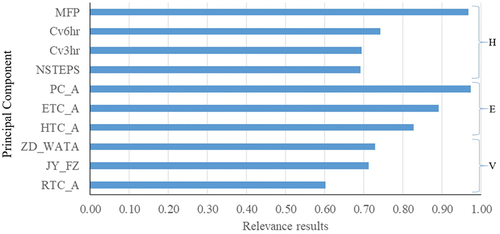
Figure 3. Distribution maps of the extracted principal components of the flash flood risk analysis.
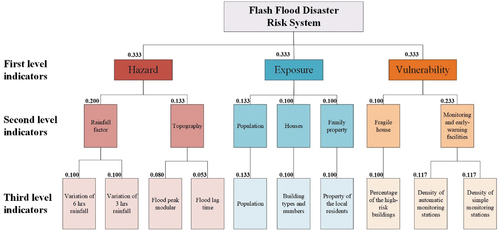
2.3.2. Establishment of the risk evaluation system
After the PCA, the 10 extracted indicators were integrated to construct the flash flood risk evaluation system (). Regarding the weight setting procedure, the weights for three first-level indicators were equally separated. For the secondary indicator weight, the “meteorological element” was considered to make a greater contribution to the “hazard” than the “geological element”. Compared to the “fragile house”, the “monitoring and early warming facilities” had a relatively higher weight in the category of “vulnerability”. For the third-level indicators, except for the “flood peak modular” element, which had a higher weight than the “flood lag-time” element in the category “topography”, all of the elements had equal weights in their respective categories.
Figure 4. Flash flood risk evaluation system.
2.3.3. The risk cube model
By normalising the principal components, the following equations were used to evaluate the flash flood risk in the small-sized catchments of China:
where Hi, Ej and Vk refer to the variable indicators; m, n and l refer to the quantities of variable items; m’, n’, and l’ refer to the variable element quantity of the indicator items; i, j, k and k’ refer to the cumulative sum of the intermediate variables; and W refers to the weight of the element and the indicator.
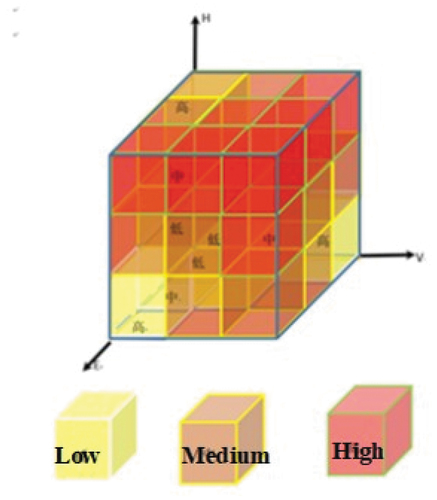
Based on the established risk assessment index system, a risk cube model was developed to further evaluate the risk of flash flood disasters in the small-sized catchments of China. The three axes of the cube represent the hazard, exposure and vulnerability, respectively. The higher the value on a given axis, the higher the evaluated risk. Hazard, exposure and vulnerability were equally ranked with three levels each (high risk, medium risk and low risk; ; ).
Table 1. Ranking of the flash flood risk in the small-sized catchments of China.
Figure 5. Flash flood risk cube.
3. Results and discussion
The flash flood risk identification and quantitative analysis results for the entire country of China are shown in . The high-risk areas are in dark, the medium-risk areas are in grey, and the low-risk areas are in light. The result of the flash flood risk was calculated at the small catchment scale, and the “white” portions shown on the map are the non-prevention areas of the flash flood hazard.
Figure 6. Integrated risks of flash flood identification in China.
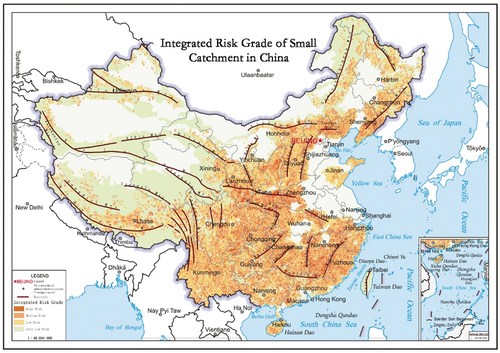
The high-risk areas were primarily located in six regions of China:
The Wuyi mountain area covers four provinces (Guangdong, Fujian, Zhejiang and Jiangxi) and is characterised by a high population density, high urbanisation level and abundant rainfall. It was identified as a highly frequent flash flood area.
The Hengduan mountain area covers three provinces (Sichuan, Chongqing and Yunnan) and is located at the intersection of the Tibetan Plateau and the Sichuan plain. Historically, this area has frequently suffered geological disasters, such as the 2008 earthquake.
The Qinlin-Daba mountain area covers five provinces (Shaanxi, Gansu, Henan, Sichuan and Chongqing). The Earth’s crust in this region displays major fractures, and the terrain is rising in the north and declining in the south with steep mountains, short rivers and multiple rapids. This contributes to the easy formation of flash flood disasters.
The Taihang-Yanshan mountain area covers three provinces (Hebei, Shanxi, and Beijing) and is adjacent to the political centre of China with a large population density and high urbanisation level.
The Loess Plateau area covers three provinces (Gansu, northern Shaanxi and Inner Mongolia). Its morphology is inclined from the north-west to the south-east and is primarily covered by thick loess. The surface has been eroded intensively by river flow for a long period of time, gradually forming thousands of gullies and valleys with terrain fragmentation. As the western centre of the country it has a large population density, and it is easily prone to the influence of flash flood disasters.
The Changbai mountain area covers three provinces (Liaoning, Jilin and Heilongjiang) and has many mountainous valleys with a dense stream network. In recent years, there have been frequent flash floods in this area. Areas identified with medium and low risk levels are widely distributed in this region according to the meteorological, hydrological and social conditions.
After rechecking the data collected from the national flash flood database, it was determined that 91% of the historical flash flood hazards were recorded in the risk areas identified in this study. The density of the flash flood hazards in the high-, medium-, and low-risk areas were 190/10,000, 119/10,000 and 98/10,000 km2, respectively.
With regard to flash flood disasters that have occurred in the different provinces of China (), Sichuan Province, located in the south-west part of China, was the largest flash flood-affected area (355,494 km2) among all of the flash flood-affected provinces of China. In addition, 12% of its flash flood-affected area was identified as a high-level area that contains 20% of its flash flood-affected population. The Yunan Province of China, which is close to the Tibetan Plateau, had the second largest flash flood-affected area (342,003 km2). However, the population that can be affected by a flash flood disaster in this province is obviously higher than that in any other flash flood-affected provinces of China. There are nearly 7,670,000 people under threat of serious flash floods (i.e. they live in high-risk areas), comprising nearly 18% of the total flash flood-affected population. The Liaoning province of China has the second highest population affected by flash flood disasters (nearly 31,420,000). Moreover, the flash flood-affected area of this province is merely 117,423 km2 and is characterised as the most serious flash flood-affected area of China’s 268 people/km2.
Figure 7. Areas and populations of China under different flash flood risk levels.
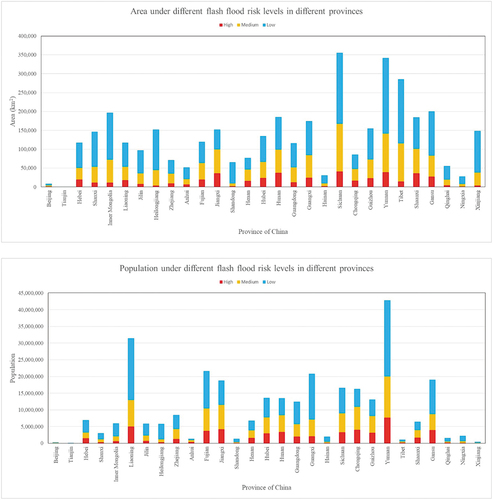
These results demonstrate the rationality and applicability of the proposed approach for flash flood risk identification and analysis. The risk assessment results in show the areas and populations under the different risk levels in the various provinces of China. The approach is promising for its ability to guide future decision-making processes and support the policymaking process for flash flood disaster reduction and early warning.
4. Conclusions
China is a country that has frequently suffered from flash flood disasters in recent years. Flash flood hazards in small catchments are characterised by their sudden occurrence, short foreseeable periods, and serious disaster losses that present huge challenges for flood defence and management processes. Accurately identifying and quantitatively evaluating the flash flood risk of small catchments in China could help decision makers and even local residents to be aware of and prepared for flash flood hazards. This would then contribute to reducing losses caused by flood disasters. Based on the national flash flood database, an operational approach was proposed to identify and quantitatively analyse the flash flood risks in 535,858 small-sized (10–50 km2) catchments in China. The approach considered the primary variables of flash flood hazards – hazard, exposure and vulnerability – and it associated 83 indicators collected from the national database to evaluate the risk of small catchments. PCA was used to extract the primary principal components for the analysis. Even though this method is quite simple, it was able to address the full situation of the Chinese territory. By using the risk cube approach, the risk levels of the small catchments in China were determined and are shown on a map at the scale of the entire country. With 53,235 historical flash flood records collected during the last 70 years (1949–2018), the conclusions can be summarised as follows:
(1) At the small catchment scale, the flash flood risk responded to hazard characteristics such as short-term heavy rainfall, the underlying surface of the watershed, and human activities. The risk evaluation proposed in this article considered the small catchment as the basic evaluation unit and then further analysed both its physical and its social properties.
(2) The results produced from the proposed approach showed that the high-risk areas in China are primarily concentrated along the coastal regions that frequently suffer from extreme rainfall events, such as typhoons and high-intensity rainfalls. Moreover, the evaluation of flash flood risk also considered human activities and socio-economic conditions. Obviously, the same level of flash flood risk in areas with different populations will cause different losses. Under the current conditions, there are 54.63 million people who live in high-risk flash flood areas in China.
(3) The proposed approach was validated using historical flash flood records. A total of 91% of historical flash floods occurred in the high-, medium- and low-risk areas identified by the approach. The results produced here will be applied to support flash flood disaster prevention strategies in China and will help define priorities going forward.
Disclosure statement
No potential conflict of interest was reported by the authors.
Additional information
Funding
References
- Alilou, H., Rahmati, O., Singh, V. P., Choubin, B., Pradhan, B., Keesstra, S., Ghiasi, S. S., & Sadeghi, S. H. (2019). Evaluation of watershed health using Fuzzy-ANP approach considering geo-environmental and topo-hydrological criteria. Journal of Environmental Management, 232, 1–13. https://doi.org/10.1016/j.jenvman.2018.11.019.
- Asian Disaster Reduction Center. (2008). Total disaster risk management: Good practice (1st ed.).
- Dennis, S. M. (1999). Disasters by design. Joseph Henry Press.
- Elkhrachy, I. (2015). Flash flood hazard mapping using satellite images and GIS tools: A case study of Najran City, Kingdom of Saudi Arabia (KSA). The Egyptian Journal of Remote Sensing and Space Science, 18(2), 261–278. https://doi.org/10.1016/j.ejrs.2015.06.007.
- Fan, J. Y., Shan, J. S., Guan, M., & Xu, X. S. (2012). Research on analysis and calculation method of critical precipitation of mountain torrents in Jiangxi province. Meteorological Monthly, 38(9), 1110–1114. https://doi.org/10.1007/s11783-011-0280-z.
- Farzaneh, H., Bahram, C., Amir, M., Narjes, S., Hamid, D., & Ali, H. (2012). Flash-flood hazard assessment using ensembles and Bayesian-based machine learning models: Application of the simulated annealing feature selection method. Science of the Total Environment, 717, 135–161. https://doi.org/10.1016/j.scitotenv.2019.135161.
- Guo, L., Zhang, X. L., Liu, R. H., Liu, Y. S., & Liu, Q. (2017). Achievements and preliminary analysis on China national flash flood disasters investigation and evaluation. Journal of Geo-Information Science, 19(12), 1548–1556. https://doi.org/10.3724/SP.J.1047.2017.01548.
- Guzzetti, F., Peruccacci, S., Rossi, M., & Colin, P. S. (2008). The rainfall intensity–duration control of shallow landslides and debris flows: An update. Landslides, 5(1), 3–17. https://doi.org/10.1007/s10346-007-0112-1.
- Guzzetti, F., Stark, C. P., & Salvati, P. (2005). Evaluation of flood and landslide risk to the population of Italy. Environmental Management, 36(1), 15–36. https://doi.org/10.1007/s00267-003-0257-1.
- Holub, M., Jürgen, S., & Fuchs, S. (2012). Mountain hazards: Reducing vulnerability by adapted building design. Environmental Earth Sciences, 66(7), 1853–1870. https://doi.org/10.1007/s12665-011-1410-4.
- Hong, H., Tsangaratos, P., Ilia, I., Liu, J., Zhu, A. X., & Chen, W. (2018). Application of fuzzy weight of evidence and datamining techniques in construction of flood susceptibility map of Poyang County, China. Science of the Total Environment, 625, 575–588. https://doi.org/10.1016/j.scitotenv.2017.12.256.
- Kia, M. B., Pirasteh, S., Pradhan, B., Mahmud, A. R., Sulaiman, W. N. A., & Moradi, A. (2012). An artificial neural network model for flood simulation using GIS: Johor River basin, Malaysia. Environmental Earth Sciences, 67(1), 251–264. https://doi.org/10.1007/s12665-011-1504-z.
- Sven, F., Jörn, B., & Thomas, G. (2012). Vulnerability assessment in natural hazard and risk analysis: Current approaches and future challenges. Natural Hazards, 64(3), 1969–1975. https://doi.org/10.1007/s11069-012-0352-9.
- Tan, X. M., Zhang, W. B., Ma, J. M., & Su, Z. C. (2004). Research on regional assessment of flood risk and regionalization mapping in China. Journal of China Institute of Water Resources and Hydropower Research, 2(1), 50–60 https://doi.org/10.1007/s11069-019-03824-9.
- Tehrany, M. S., Pradhan, B., & Jebur, M. N. (2013). Spatial prediction of flood susceptible areas using rule based decision tree (DT) and a novel ensemble bivariate and multivariate statistical models in GIS. Journal of Hydrology, 504, 69–79. https://doi.org/10.1016/j.jhydrol.2013.09.034.
- Tehrany, M. S., Shabani, F., Jebur, M. N., Hong, H., Chen, W., & Xie, X. (2013). GIS-based spatial prediction of flood prone areas using standalone frequency ratio, logistic regression, weight of evidence and their ensemble techniques. Geomatics, Natural Hazards and Risk, 8(2), 1538–1561. https://doi.org/10.1080/19475705.2017.1362038.
- Tehrany, M. S., Shabani, F., Jebur, M. N., Hong, H., Chen, W., & Xie, X. (2017). GIS-based spatial prediction of flood prone areas using standalone frequency ratio, logistic regression, weight of evidence and their ensemble techniques. Geomatics, Natural Hazards and Risk, 8(2), 1538–1561 https://doi.org/10.1080/19475705.2017.
- Totschnig, R., Sedlacek, W., & Fuchs, S. (2011). A quantitative vulnerability function for fluvial sediment transport. Natural Hazards, 58(2), 681–703. https://doi.org/10.1007/s11069-010-9623-5.
- Wang, Z. Z., & Wang, G. X. (2016). Analysis on flash flood disaster earning warning indicators based on backflow of water level. Jilin Water Resources, 8, 33–35 .
- Wieczorek, G. F., & Glade, T. (2005). Debris-flow hazards and related phenomena, in Climatic factors influencing occurrence of debris flows. Springer. https://doi.org/10.1007/3-540-27129-5_14.
Appendix 1.
A brief introduction to the national flash flood database (only the data related to this study are listed).
Appendix 2.
Selected elements for identifying and analysing the flash flood risk in China.