 ?Mathematical formulae have been encoded as MathML and are displayed in this HTML version using MathJax in order to improve their display. Uncheck the box to turn MathJax off. This feature requires Javascript. Click on a formula to zoom.
ABSTRACT
With the permeability enlargement method, we carried out Finite Element Analysis on the piping development in a double-stratum dike foundation with suspended cut-off wall. Piping initialization as well as its development, erosion domain and seepage distribution under various hydraulic head is studied for double strata. The influences of the wall’s position and penetration on the seepage control are mainly analyzed. Results show that: (1) the erosion is composed of five stages, (a) sudden local piping after the formation of a passageway exit, (b) the channel developing towards the cut-off wall, along the surface of the sand layer, (c) lateral development along the cut-off wall, (d) vertical development leaping over the cut-off wall, and (e) horizontal development after leaping over. The failure mode and mechanism remain consistent with the phenomenon observed in the flume model test; (2) piping erosion transforms from horizontal to vertical, improving the critical hydraulic head effectively and reducing the risk of the dike collapse. The wall positioned at the downstream of the dike works more efficiently; (3) the suspended cut-off wall has little influence on the erosion initialization but exerts an effective control on its development. The seepage control efficiency increases as the wall penetration increases.
RÉSUMÉ
Nous avons effectué une analyse par éléments finis avec évolution possible de la perméabilité, pour étudier le développement de circulations hydrauliques dans une fondation de digue à double couches, avec un mur parafouille suspendu. L’initialisation de circulations ainsi que leur développement, les phénomènes d’érosion et la distribution des infiltrations sous différentes charges hydrauliques sont étudiés pour un milieu à deux couches. Les influences de la position et de la profondeur du mur sur le contrôle des infiltrations sont analysées. Les résultats montrent que : (1) l’érosion est composée de cinq stades, (a) initialisation locale et brutale d’une circulation après la formation d’une sortie en aval, (b) développement d’un chenal de circulation en direction du mur parafouille, le long de la surface de la couche de sable, (c) développement latéral le long du mur, (d) développement vertical en sautant par-dessus le mur et (e) développement horizontal après le saut. Le mode et le mécanisme de défaillance restent cohérents avec le phénomène observé lors de l’essai sur modèle de canal ; (2) l’érosion régressive passe de l’horizontale à la verticale, améliorant efficacement la charge hydraulique critique et réduisant le risque d’effondrement de la digue. Le mur positionné à l’aval de la digue fonctionne plus efficacement ; (3) le mur parafouille suspendu a peu d’influence sur l’initiation de l’érosion mais exerce un contrôle efficace sur son développement. L’efficacité du contrôle des infiltrations augmente à mesure que la profondeur du mur augmente.
1. Introduction
With the development of hydraulic engineering construction in China, the mechanism of and prevention measures for piping erosion have become a hot research issue in engineering and academic circles. In recent years, using model tests and numerical simulation, a series of studies on the piping mechanism in a two-stratum dike foundation have been carried out by scholars in China and abroad, and some primary results have been achieved. However, research is still lacking on numerical simulation and the mechanism of piping erosion in a two-stratum dike foundation with a suspended cut-off wall. Knowledge regarding the control effect for the suspended cut-off wall at different positions and penetrations is especially needed.
A number of numerical simulation models for piping development have been proposed, including a groundwater well flow model (Mao et al., Citation2004; Wang & Cao, Citation1991); a coupling seepage and pipe flow model (X. J. Zhou et al., Citation2009); a finite element seepage model (Ding Citation2007a; Li et al., Citation2003; Zhang et al., Citation2004); a stochastic model (Cao Citation1985); a solute transport model (Luo Citation2010a; Luo et al., Citation2011); a particle flow model (J. Zhou et al., Citation2007); and so on. Each of these models can only reflect one or a few specific aspects of piping development and cannot fully explain its mechanism. They have particular difficulty in identifying the piping erosion process with a cut-off wall. Multiphase flows with interface-capturing methods are adopted for the direct numerical simulation of two-phase flows to model the transport processes across phase boundaries (Banerjee et al., Citation2005). The efficiency of the cut-off walls embedded in the embankments subject to seepage depends on the overall ground situation and the groundwater flow characteristics on the one hand, and on the walls’ resistance to geohydraulic load on the other hand (Odenwald & Ratz, Citation2012). The seepage control effect of the suspended cut-off wall and piping failure process have been investigated using stable seepage theory and a changing permeability coefficient of piping channel (Zhang et al., Citation2004). The permeability coefficient was altered to simulate dynamic piping development, and the seepage control effect of the underground continuous wall was also analysed (Li et al., Citation2003). However, the critical condition and piping failure mode are not presented, especially the piping failure mechanism for the stages pre and post passing through the cut-off wall. The dynamic development of piping and seepage distribution in a dike foundation with a suspended cut-off wall were simulated by the element-free method (J. Zhou et al., Citation2007). Based on solute transport, the development of the piping channel and the piping control effect of the suspended cut-off wall under different penetration ratios is analysed with finite element analysis (Luo & Su, Citation2010b). On the basis of the micromechanical mechanism of piping erosion, the piping channel is described in terms of pipe flow, and the influence of wall depth, position and the permeability anisotropy is studied (Ji, Citation2018). With coupled seepage and pipe flow, the element-free method is adopted to simulate the function mechanism of the cut-off wall (Wang et al., Citation2015, Citation2014). These methods are almost all two dimensional, and three-dimensional piping erosion development is rarely presented. In addition, these numerical simulations are not carried out in combination with the model test, thus lacking validation with experimental data.
In this paper, critical horizontal and vertical hydraulic gradients are adopted to judge the initialisation of piping. The coupling of the piping erosion area and seepage is implemented by enlarging the permeability coefficient in the piping erosion region. On this basis, the three-dimensional visualisation finite element analysis software Groundwater Simulation System (GWSS) is programmed to simulate the dynamic development of piping. Its reliability is verified by model test results of two-stratum and single-stratum dike foundation.
Multi-scheme numerical simulations of the dynamic development of piping in the model test with suspended cut-off wall are carried out. The main contents include: (1) effect of the seepage control effect and mechanism of the suspended cut-off wall on the dynamic development of piping in a two-stratum dike foundation; (2) the influence of position and penetration of the suspended cut-off wall on the piping control effect as well as discussion of a design concept and method for a suspended cut-off wall in a two-stratum dike foundation.
2. Model test and experimental results
As shown in , the slot for the model test is 2.8 m (length) × 0.8 m (width) × 0.7 m (height), while the intake chamber is 2.2 m high. The sample is 2.25 m × 0.8 m × 0.6 m. A transparent organic glass plate (1.4 m long, 1.5 cm thick) lies on the top of sample for the sake of convenient observation. Four screws act on the surface of the glass plate to impose pressure, simulating the weight of the dike. The model is composed of an intake system and an observation system. Piezometric tubes are installed at the sidewall, the bottom of the slot and centreline of the glass plate. As shown in , X is the distance between the cut-off wall and the intake. L is the distance from the piping exit to the intake. t is the depth of the cut-off wall; T is the thickness of the sand sample. H is the difference in hydraulic head between the intake chamber (upstream) and piping exit (downstream). The sand sample is compacted layer by layer (about 5 cm per layer) in water. For convenient comparison with the prototype, the glass plate is called the dike foundation and the boundary of the plate where the piping exit lies is referred to as the downstream dike toe hereafter.
Figure 1. Schematic diagram of flume model with suspended cut-off wall(m).
The detailed model test process is not the focus of this paper and will not be discussed in detail here; see Ding (Citation2007b) for more information. Five stages were identified from the experimental observation. The first stage is the quick water and sands gushing at the exit of piping after the sudden pulling out of the plug. Some seepage failure occurs around the piping exit and the water and sand gushing occurs due to the combined actions of the vertical seepage force and the horizontal one; it stabilises gradually. The second stage occurs if the upstream hydraulic head continues to increase. The sands on the top surface of the sample gradually lose their balance because of the horizontal seepage force. They are gradually transported to the piping exit, forming creek-like channels that extend in the upstream direction. The piping channel develops up to the cut-off wall and become stable as a result of sustained hydraulic head increase. The third stage appears if the hydraulic head continues to increase. Piping develops along the cut-off wall and the channel is still like a shallow trench. Vertical destruction downstream of the cut-off wall is observed in the fourth stage. Digging pit is formed and piping erosion develops to the bottom of the cut-off wall if the hydraulic head is still rising. In the fifth stage, there is a gradual collapse on the upstream side of the cut-off wall and the piping channels rapidly develop and penetrate to the upstream of the sample.
3. Computation model
The numerical simulation of the dynamic development process of piping is a very complicated issue. The finite element method for dynamic development of piping is mainly used. It includes the criterion of the initialisation of piping, hunting for the piping regions, the permeability coefficient in the piping regions, software programming and verification.
3.1. The permeability coefficient of the piping area
The permeability coefficient of the piping regions can be specified as in EquationEquation (1)
(1)
(1) : (Ding Citation2007a):
where λ is the friction factor of head loss in the piping region, is the average velocity in the piping channel,
is the hydraulic radius and g is the acceleration of gravity.
ranges from 103k to 106k according to EquationEquation (1)
(1)
(1) , where k is the permeability coefficient of the sand sample. Finding a reasonable critical hydraulic gradient and permeability coefficient for the piping channel in accordance with the model test is an important task for the computation program.
3.2. Discrimination of piping erosion
The critical vertical hydraulic gradient JVcr and the horizontal gradient JHcr for the local piping erosion at the tip of the piping channel are defined as follows:
where is the floating specific weight,
is the effective stress in the vertical direction, zd is the depth of the piping channel,
is the internal friction angle and
is the specific weight of water. The internal friction angle of the sand sample is generally from 30° to 45°. According to EquationEquations (2)
(2)
(2) and (Equation3
(3)
(3) ), the value of JVcr and JHcr ranges from 0.5 to 0.8 and 0.5 to 1.65, respectively.
The element is assumed to be damaged if the horizontal hydraulic gradient is greater than its critical value, or the vertical gradient is greater than its critical value. In this case, the permeability coefficient would be changed and seepage has to be re-calculated. The damaged elements are tracked by identifying nodes.
3.3. Calculation process and software implementation
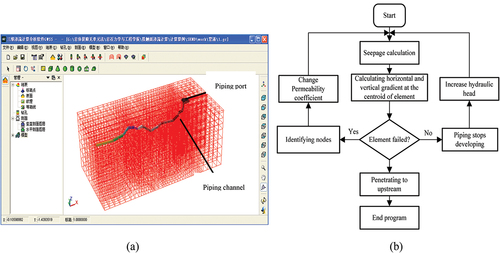
The three-dimensional GWSS visualisation software is programmed using the Interactive Data Language (IDL) for the numerical simulation of the dynamic development of piping. The GWSS software interface is shown in ). It is composed of the system control module, the parameter setting module, the finite element mesh generation module, and the simulation of the dynamic development of the piping module and post-processing module. More information about the GWSS software is given by Liu (Citation2012a). The simulation flow chart of the dynamic development of piping in a dike foundation is shown in .
Figure 2. (a) GWSS software interface; (b) flow chart of numerical simulation for the development of piping.
3.4. Verification of GWSS
The critical horizontal average hydraulic gradient is defined as the ratio of the critical hydraulic head for the overall piping destruction to the length of the seepage path L (1.4 m). The gradient at the tip of the piping channel is denoted as
. To maintain consistency with the process in the model test, stable seepage computation is carried out as the upstream hydraulic head is raised step by step while the downstream head is held constant.
Numerical simulations of the model tests for a two-stratum and single-stratum dike foundation are carried out with = 0.5 and
=1000
. The determination of the local critical hydraulic gradient for piping and the permeability coefficient in the piping channel is introduced in the numerical simulation of the dynamic development of piping in a two-stratum dike foundation (Ding Citation2007a; Liu Citation2012a).
The model test results for the dynamic development of piping in a two-stratum and a single-stratum dike foundation are utilised to verify the validation of GWSS. A comparison of the critical average horizontal hydraulic gradient from the numerical simulation and the model test under different dike foundation conditions is shown as in .
Table 1. Numerical results for dike foundations of different styles.
For the numerical results of the dynamic development of piping in a two-stratum and single-stratum dike foundation, the critical horizontal average hydraulic gradients are consistent with the model test results for both styles. Furthermore, the development of piping erosion is basically identical to the model test results (Liu Citation2012b). The comparisons validate the GWSS software. Therefore, this program can be used in the simulation of the development of piping in a dike foundation with a cut-off wall.
4. Simulation of the development of piping erosion in a dike foundation with a cut-off wall
4.1. Computation model
The geometry of the sand sample is shown in . The finite element model is only established for half of the sample, taking advantage of the symmetry of seepage, to save the time of mesh generation and computation. The computation model is thus 2.25 m long, 0.4 m wide and 0.6 m high, as shown in . The physical and mechanical parameters of the model test sample are listed in . The critical vertical hydraulic gradient is 0.59 according to EquationEquation (2)(2)
(2) , and the critical horizontal hydraulic gradient is taken as 0.5.
Figure 3. Three-dimensional mesh of the computation domain.
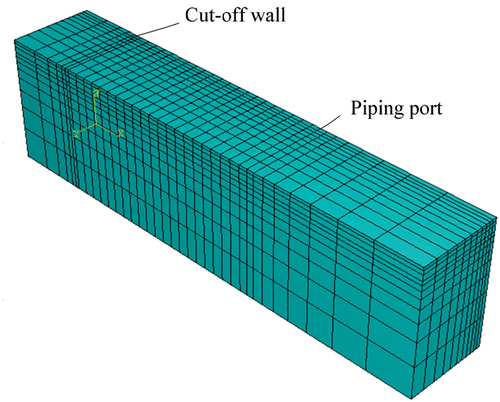
Table 2. Physical–mechanical parameters of the specimen.
4.2. Numerical results and mechanism analysis
The upstream hydraulic head is again increased step by step, at intervals of 0.02 m starting from the initial value of 0.66 m, while the downstream hydraulic head is kept constant at 0.615 m.
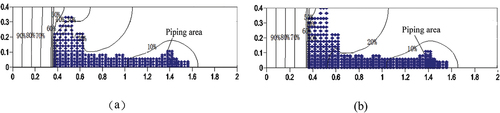
(1) At the primary head of 0.66 m, the hydraulic head contours at the top of the sand layer and on the centreline of the longitudinal profile are shown in , after the plug is pushed out to form the piping exit. It can be seen from that the hydraulic head contours around the piping exit are intensive. The horizontal hydraulic gradient is about 1.6 and the vertical gradient is 0.7, greater than the local critical hydraulic gradient in both directions, as shown in . Therefore, piping erosion is observed. ) show the seepage distribution at the primary hydraulic head and the erosion area at an upstream hydraulic head of 0.68 m, respectively. The blue dots in ) represent the nodes in the elements where piping erosion occurs. As shown in ), piping erosion develops quickly towards the upstream and forms an erosion area of nearly elliptical shape around the piping exit. The erosion area is about 0.4 m long and 0.1 m wide. The piping erosion shape observed from the model test is similar to that from the numerical simulation, which is about 0.2 m long and 0.05 m wide. From the perspective of the piping erosion area, the numerical result is much larger than the model test.
Figure 4. (a) Hydraulic head contours at the top of the sand layer and (b) centreline profile of piping erosion channel (H = 0.66 m).
Figure 5. Hydraulic head contours at the top of sand layer during the development of piping (H = 0.68 m).
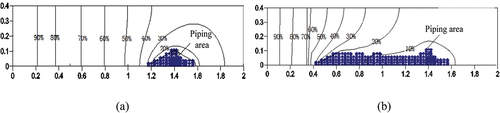
(2) When the upstream head is 0.68 m, the horizontal average hydraulic gradient is 0.046 and the dynamic development of the piping erosion area and seepage distribution () shows the hydraulic head gradient at the tip of the piping channel for the two steps. From , the piping channel continues developing towards the upstream until it reaches the cut-off wall, as shown in ).
Figure 6. Hydraulic head contours at the centreline of the piping erosion channel during its development (H = 0.68 m).
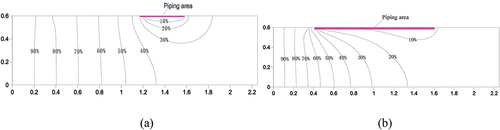
Figure 7. Seepage gradient at the piping erosion tip during its development (H = 0.66~0.68 m).
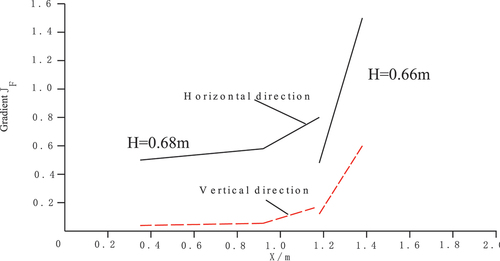
Figure 8. Hydraulic head contours at the top of the specimen during the development of piping (H = 0.7 m).
The horizontal hydraulic head gradient at the tip of the piping channel rapidly increases to 0.8. This is higher than the critical gradient of 0.5, and thus piping erosion begins to develop horizontally. In contrast, the vertical hydraulic head gradient increases only to 0.15, which is lower than the critical value. Piping erosion is thus mainly in the horizontal mode; extensive erosion is seen on the top of the sand layer.
In the process of development of piping, the erosion area near the piping port does not extend in width but develops along the centreline of the sample towards the cut-off wall upstream. The numerical dynamic development of piping is identical to the phenomenon observed in the model test. The piping erosion area is much larger than the model test result in the horizontal direction and nearly the same in the vertical direction. Ding (2007) discusses the model test procedures and test results in detail.
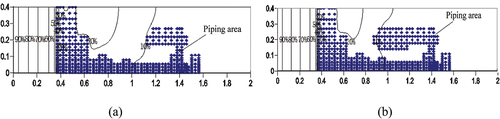
(3) When the upstream hydraulic head increases to 0.7 m, the horizontal average hydraulic head gradient is 0.061. shows the seepage distribution and piping erosion area at the top surface of the sand sample. It can be seen from that the piping channel develops along the cut-off wall, still at the top of the sand sample, until it reaches a stable status, as it is prevented from developing towards the upstream by the cut-off wall.
(4) When the upstream hydraulic head increases to 0.74 m, the horizontal average hydraulic head gradient is 0.089. shows the seepage distribution and piping erosion area at the top surface of the sand sample. It can be seen from that the piping channel still develops along the cut-off wall until it reaches the boundary of the model.
Figure 9. Hydraulic head contours at the top of the specimen during the development of piping (H = 0.74 m).
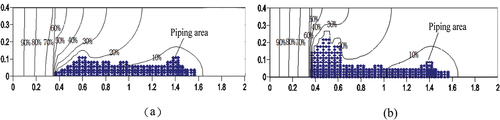
(5) When the upstream hydraulic head increases to 0.82 m, the horizontal average hydraulic head gradient is 0.146. shows the seepage distribution and piping erosion area at the top surface of the sand sample. It can be seen from that the vertical hydraulic head gradient is too small to overcome the gravity of the sand and initialise vertical piping erosion at the time piping erosion develops to the boundary of the model. Meanwhile, the increased difference in the hydraulic head between upstream and downstream makes new piping channels appear around the piping port. This phenomenon lasts until the piping reaches stability and stops developing. This is consistent with the observation in the model test.
Figure 10. Hydraulic head contours at the top of the sand layer during the development of piping (H = 0. 82 m).
(6) When the head upstream increases to 0.85 m, the horizontal average hydraulic head gradient is 0.168. shows the seepage distribution and piping erosion area along the centreline profile of the sand sample. shows the hydraulic head gradient at the tip of piping channel. It can be seen that the vertical gradient at the bottom of the cut-off wall is 0.86 (greater than 0.59), while horizontal gradient is smaller than the critical one. The piping erosion mode changes from horizontal erosion to vertical and develops in depth along the downstream surface of the cut-off wall. With the development of piping erosion at depth, both the horizontal and vertical hydraulic gradient at the tip of piping channel decrease. The vertical gradient at the tip of the piping channel is 0.65 when the piping erosion develops to the bottom of the cut-off wall but not across the wall; it is still greater than the critical vertical gradient of 0.59 and thus the piping erosion develops in depth. When the piping erosion develops to the bottom of the cut-off wall, the horizontal hydraulic head gradient at the tip of the piping channel increases to 4.0 while the vertical gradient is only 0.2. Therefore, piping erosion turns to horizontal failure, which develops horizontally across the cut-off wall. The horizontal hydraulic head gradient at the tip of the piping channel gradually increases and piping erosion develops to the upstream surface of the sand sample. Penetrating piping is formed and results in the overall failure of the dike foundation.
Table 3. Local seepage gradient at the tip of piping channels at different positions.
Figure 11. Hydraulic head contours at section y = 0.2 m during the development of piping (H = 0.85 m).
From the above simulations, the upstream hydraulic head is 0.85 m and the horizontal average gradient is 0.168 for the overall failure of the dike foundation, while the upstream hydraulic head is 0.95 m and the horizontal average gradient is 0.25 from the model test results. It is obvious that the critical hydraulic head from the numerical simulation is smaller than that of the model test. One reason for this may be that the piping channel calculated is larger than that of the model test. Another reason may be that the numerical model is isotropic and its piping channel develops in a straight line, while the sample is anisotropic and the piping channel does not develop along a straight path. A final reason may be that the interaction of water and sand transported in the piping channels is not considered. These factors combine to make the simulation results smaller than the experimental results.
4.3. Analysis of the piping control effect on the suspended cut-off wall
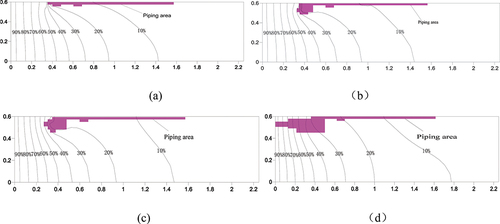
In correspondence with the flume model test, four cases are simulated: (1) suspended cut-off wall located upstream with a penetration of 0.1 m; (2) suspended cut-off wall located upstream with a penetration of 0.2 m; (3) suspended cut-off wall located downstream with a penetration of 0.1 m; (4) suspended cut-off wall located downstream with a penetration of 0.2 m. Section 3.2 gives the numerical results for case (1) only. The numerical results of the other cases are listed in . The dynamic development of piping erosion in the latter three cases is similar to that in case (1); the only difference lies in the critical hydraulic gradient and piping erosion area.
Table 4. Numerical and model test results for suspended cut-off walls at different positions and with varied penetration levels.
It can be seen from that (1) when the suspended cut-off wall is located at upstream, the critical hydraulic head gradients are 0.167 and 0.31 for penetration of 0.1 m and 0.2 m, respectively. Therefore, the suspended cut-off with a larger penetration can significantly improve the piping control capacity.
(2) With the same penetration, the critical horizontal average hydraulic head gradient is 0.25 with the suspended cut-off wall positioned downstream, being 49.7% higher than the gradient of 0.167 with wall located upstream. The corresponding gradients are 0.31 and 0.254, respectively, in the model test. With the same penetration, the closer the cut-off wall gets to the back side of the dike, the higher the critical horizontal average hydraulic gradient. Therefore, it is more reasonable for the suspended cut-off wall to be arranged at the back side of the dike foundation. The reason for this is that when the piping erosion develops to the downstream surface of the cut-off wall, the piping erosion resistance is then mainly determined by the length of the effective seepage path which is the distance from the upstream of the dike to the cut-off wall.
5. Conclusion
(1) By setting the critical hydraulic head gradient and changing the permeability coefficient in the piping erosion area, finite element analysis of the dynamic development of piping is established. Numerical simulation of the dynamic development and mechanism of piping in a dike foundation with a suspended cut-off wall is carried out and a comparison with the flume model test results is presented. Numerical simulation and experimental results reveal that the dynamic development of piping erosion in the two-stratum dike foundation with a suspended cut-off wall includes five stages. The piping erosion mode and erosion mechanism are different from each other among the five stages.
(2) The piping control effect of the suspended cut-off wall at different locations and with different penetration amounts is analysed. Numerical simulation results show that the overall piping erosion resistance capability is stronger if the penetration is much higher.
(3) The suspended cut-off wall should be close to the back side of the dike so as to improve the piping erosion resistance capability of the dike foundation. Moreover, if the suspended cut-off wall is positioned backward of the dike, piping is constrained to develop at the back of the cut-off wall once piping erosion occurs. This would greatly reduce the threat to the safety of the dike.
Disclosure statement
No potential conflict of interest was reported by the authors.
Additional information
Funding
References
- Banerjee, S., Badalassi, V., Dwivedi, V., Nave, J.-C., & Hall, D. (2005). The direct numerical simulation of two-phase flows with interface capturing methods. La Houille Blanche, 91(5), 1–9. https://doi.org/10.1051/lhb:200505005
- CAO, D. L. (1985). A stochastic model for seepage piping. Journal of Yangtze River Scientific Research Institute, (2), 39–46. (in Chinese).
- Ding, L. Q., Wu, M. X., Liu, C. J., Sun, D. Y., and Yao, Q. L. (2007a). Numerical simulation of dynamic development of piping in two-stratum dike foundations. Water Resources and Hydropower Engineering, 38(2), 36–39. (in Chinese).
- DING, L. Q., YAO, Q. L., SUN, D. Y., Liu, C. J., and Zhou, X. J. (2007b). Experimental studies on the seepage control effects of suspended cutoffs. Water Resources and Hydropower Engineering, 38(2), 23–26. (in Chinese).
- Ji, W. X. (2018). Research on piping erosion control of suspended cut-of wall in dike foundation. Water Resources Planning and Design, 35 (11), 134–136. (in Chinese).
- Li, S. D., Zhang, X. M., & Liu, Z. X. (2003). Simulation of piping erosion process in the excavation of foundation pit. Geotechnical Investigation and Surveying, 2, 14–17. (in Chinese).
- Liu, C. J., Ding, L. Q., Sun, D. Y., and Yao, Q. L. (2012a). Numerical simulation of the model size effect in piping erosion test for double-stratum dike foundations. Chinese Journal of Rock Mechanics and Engineering, 31 (sup.1), 1330–1336. (in Chinese).
- Liu, C. J., Ding, L. Q., Sun, D. Y., and Yao, Q. L. (2012b). Model test and numerical analysis of piping erosion procedure in single-stratum dike foundations. China Civil Engineering Journal, 45 (8), 130–137. (in Chinese).
- Luo, Y. L., Peng, H., & Zhang, J. (2010a). Pure convection coupled piping model based on stabilized finite element SUPG. Chinese Journal of Geotechnical Engineering, 32 (7), 1072–1078. (in Chinese).
- Luo, Y. L., & Su, B. Y. (2010b). Piping control effect of suspended cut-off wall based on solute transport. Journal of Zhejiang University(Engineering Science), 44 (10), 1870–1875. (in Chinese).
- Luo, Y. L., Su, B. Y., Sheng, J. C., and Zhan, M. L. (2011). New understanding on piping mechanism. Chinese Journal of Geotechnical Engineering, 33(12), 1895–1902. (in Chinese).
- Mao, C. X., Duan, X. B., Cai, J. B., & Ru, J. H. (2004). Experimental study on harmless seepage piping in levee foundation. Journal of Hydraulic Engineering, (11), 46–52. (in Chinese).
- Odenwald, B., & Ratz, K. (2012). Prevention of internal erosion by cut-off walls in river embankments on the upper rhine. La Houille Blanche, 98(4–5), 48–53. https://doi.org/10.1051/lhb/2012030
- Wang, L. F., & Cao, D. L. (1991). Study of piping failure in Jingjiang dike foundation. Journal of Yangtze River Scientific Research Institute, 8 (2), 44–51. (in Chinese).
- Wang, D. Y., Fu, X. D., Jie, Y. X., Dong, W. J., & Hu, D. (2014). Simulation of pipe progression in a levee foundation with coupled seepage and pipe flow domains. Soils and Foundations, 54(5), 974–984. https://doi.org/10.1016/j.sandf.2014.09.003
- Wang, D. Y., Fu, X. D., & Feng, Q. F. (2015). Effect of suspended cut-off walls on preventing piping development in levees. Journal of Tsinghua University(Sci & Technol), 55(2), 164–169.
- Zhang, J. F., Zhu, G. S., & Cao, D. L. (2004). Numerical simulation of seepage deformation propagation in dyke foundation and effects of cut-off wall of suspension type. Journal of Yangtze River Scientific Research Institute, 21 (6), 46–50. (in Chinese).
- Zhou, J., Yao, Z. X., & Zhang, G. (2007). Mesomechanical simulation of seepage flow in sandy soil. Chinese Journal of Geotechnical Engineering, 29 (7), 977–981. (in Chinese).
- Zhou, X. J., Jie, Y. X., & Li, G. X. (2009). Numerical simulation of piping based on coupling seepage and pipe flow. Rock and Soil Mechanics, 30 (10), 3154–3158. (in Chinese).