 ?Mathematical formulae have been encoded as MathML and are displayed in this HTML version using MathJax in order to improve their display. Uncheck the box to turn MathJax off. This feature requires Javascript. Click on a formula to zoom.
ABSTRACT
To understand the influence of corrosion and fracturing of prestressed steel on structural deformation, accelerated corrosion testing was carried out using a self-made test beam and applying DC power. Distributed optical fibre sensing technology based on pulse prepumped Brillouin optical time-domain analysis (PPP-BOTDA) was used to monitor the deformation of the prestressed concrete beam in the process of corrosion and fracture in real time. The finite-element model of local corrosion fracture of prestressed steel is established, and the monitoring results are verified based on various corrosion fracture simulation methods. The results show that when the sensing optical fibre pasted on the beam is less than 150 mm from the prestressed steel, the significant change of concrete strain when the steel breaks can be monitored and the fracture location can be determined at the same time. However, when the distance is greater than 150 mm, the change in monitoring data with the strain is not obvious. The distributed optical fibre sensing technology has high monitoring efficiency and abundant measurement data, and the underwater environment does not affect the transmission of monitoring data. This technology is applicable to the deformation monitoring of large prestressed concrete structures and could be widely used in practical engineering.
RÉSUMÉ
Pour comprendre l’influence de la corrosion et de la fracturation de l’acier précontraint sur la déformation structurelle, des tests de corrosion accélérés ont été effectués à l’aide d’une poutre d’essai fabriquée par nos soins et en appliquant une alimentation électrique continue. Une solution de détection sur une fibre optique à l’aide d’un réflectomètre optique dans le domaine temporel à effet brillouin (PPP-BOTDA) a été utilisée pour surveiller la déformation de la poutre en béton précontraint pour les processus de corrosion et de rupture en temps réel. Un modèle par éléments finis de la rupture par corrosion locale de l’acier précontraint a été construit et les résultats de la surveillance sont vérifiés sur la base de diverses méthodes de simulation. Les résultats montrent que lorsque la fibre optique de détection collée sur le faisceau est à moins de 150 mm de l’acier précontraint, le changement significatif de déformation du béton lorsque l’acier casse peut être détecté et l’emplacement de la fracture peut être déterminé en même temps. Cependant, lorsque la distance est supérieure à 150 mm, l’évolution des données de surveillance de la déformation n’est pas mise en évidence de manière certaine. La technologie de détection à fibre optique distribuée est une solution efficace pour la surveillance des ouvrages. Elle produit également des données de mesure abondantes et l’environnement sous-marin n’affecte pas la transmission des données de surveillance. Cette technologie est applicable à la surveillance de la déformation de grandes structures en béton précontraint et pourrait être largement utilisé dans de nombreux projets d’ingénierie.
1. Introduction
With the rapid construction of infrastructure, large-scale prestressed concrete structures have become the most widely used and most promising structural form in civil engineering, water conservancy and transportation engineering in China. Ageing and damage caused by long-term operation or poor construction quality of the structure will seriously affect its durability. For post-tensioned prestressed concrete structures, the construction process is prone to the phenomenon of channel void, which can lead to corrosion of prestressing tendons (Gu et al., Citation2017), and the concrete material itself contains sulphuric acid and chloride ions. Erosive media infiltration brought about by the apparent cracking of the structure can also cause corrosion of the prestressing tendons, which weakens the bond between the concrete and prestressing tendons, resulting in a reduction in stiffness and an increase in deflection, or even fracture, which seriously affects the safety and durability of the structure (Fumin et al., Citation2015).
Some scholars have conducted studies on the flexural performance of prestressed concrete beams with prestressing steel corrosion (Li & Yuan, Citation2010; Shiqin et al., Citation2019; Xu et al., Citation2012). Yang et al. (Citation2008) studied the effect of local corrosion fracture of prestressing steel on the flexural performance of prestressed concrete beams, and found that the ultimate load-bearing capacity of the member and the degree of stiffness reduction of prestressed concrete beams are related to the fracture position of the steel strand. Fang et al. (Citation2012) and Yu et al. (Citation2014) showed that strand corrosion can significantly reduce the fatigue life of beams, while the mid-span deflection is not greatly affected by the degree of corrosion at the same number of fatigue cycles. Zhu et al. (Citation2006) carried out static load testing and finite-element simulation for the performance of a railway T-beam bridge after whole-strand fracture. Yi et al. (Citation2010) assumed that the fatigue life of the beams is decreased with the degree of corrosion of steel reinforcement; meanwhile, a brittle failure mode occurred. In addition, the ratio of maximum elongation at rupture to yield strength of the corroded steel decreased with an increase in the fatigue stress magnitude.
The above studies mainly focus on the force performance of prestressed concrete beam after minor corrosion or fracture of prestressed reinforcement, and there is a relative lack of research on the real-time monitoring of prestressed concrete beam deformation during the corrosion and fracture of steel. Distributed monitoring technology has emerged in recent years in which optical fibre is used in the monitoring process as both a signal transmission medium and a monitoring sensor, truly achieving the integration of “transmission” and “sensing” (Honghu & Bin, Citation2015). It can quickly and accurately monitor small changes in the structure and has many advantages such as short measurement time, sensitivity at every point along its length, high spatial resolution and strong resistance to electrical measurement interference. For cracks, the distributed monitoring technology can not only monitor its width but also locate its position (Zhao et al., Citation2022). Therefore, it is widely used in health monitoring of civil engineering, water conservancy, electrical power and other structures (Hou et al., Citation2020; Kishida et al., Citation2005; Moffat et al., Citation2015; Zhou et al., Citation2010).
In this paper, pulse prepumped Brillouin optical time-domain analysis (PPP-BOTDA) distributed fibre optic sensing technology is used to monitor the real-time deformation of prestressed concrete beams under corrosive environments. We applied a DC power supply to accelerate the corrosion of the prestressed steel, and placed distributed optical fibres on the surface of the prestressed concrete beam along its length, so that the sensing fibres and the beam are deformed synchronously, and the deformation of the beam has a tendency to increase gradually during the test. The reliability and accuracy of the monitoring results were verified based on various corrosion fracture simulation methods. The precise and continuous strain measurement and accurate location of the fracture could be achieved by the distributed fibre optic sensing technology.
2. Corrosion fracture test for prestressed steel
2.1. Preparation of the test model
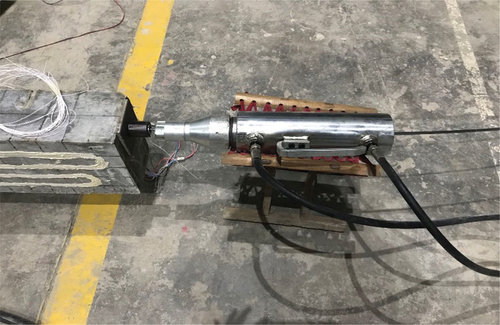
The test was carried out using a self-made prestressed concrete beam, L × W × H = 2200 mm × 150 mm × 250 mm, as shown in . A length of 600 mm was measured out in the middle of the top of the beam and a slot was cut using a slotting machine to expose the prestressing tendon apertures. A corrosion tank was placed at the top of the beam to prepare for the later exposure of the prestressing tendons to galvanic corrosion testing. Prestressed steel, common steel and hoop bars with diameters of 7 , 8 and 8 mm, respectively, were laid out using anchorages matching the diameter of the prestressed steel, as shown in . A pressure of 12 MPa was applied to the prestressed steel with hydraulic jacks as shown in , and the excess prestressed steel was cut off by releasing the anchorage after tensioning was completed. Manual grouting was used to fill the borehole using the self-weight of the slurry.
Figure 1. Test model of prestressed reinforcement corrosion (mm).
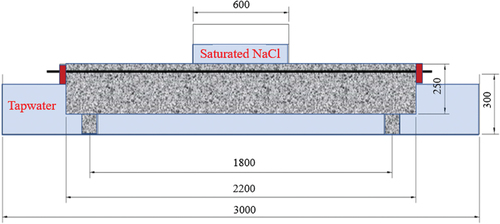
Figure 2. Structural reinforcement method (mm).
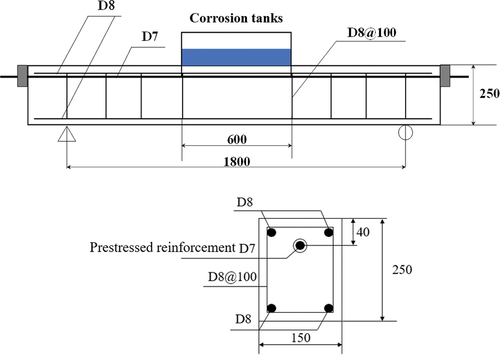
Figure 3. Prestressed reinforcement tensioning and anchoring equipment.
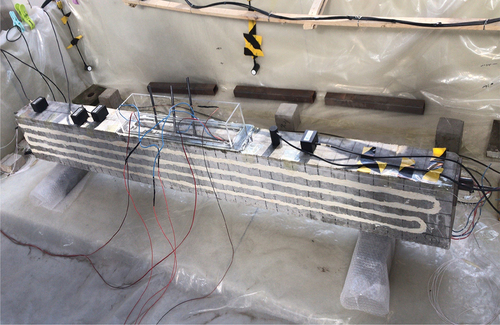
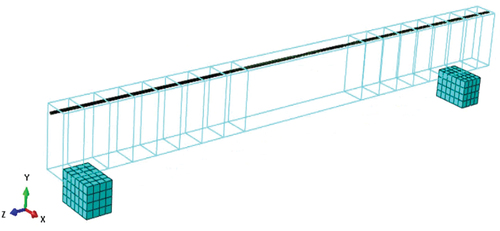
The fibres are attached to the side of the beam in an S-shape along the length of the beam, at an interval of 50 mm, leaving a free length of 20 m at the beginning and 20 m at the end, and a free length of 5 m at the bend of the fibres, as shown in . In the process of gluing the fibre, it is necessary to manually pull it tightly against the side of the beam and then apply epoxy resin glue, and to hold it in place until the fibre optic wire does not retract after letting go. Two concrete test blocks are placed in the sink, both at 600 mm between the edge of the test block and the edge of the sink, and the previously precast prestressed concrete beam is placed on the test blocks. Three carbon rods of 200 mm in length were connected at equal intervals using copper conductors placed 100 mm apart in the corrosion bath, with a resistance of 3 Ω measured for each pair of rods.
Figure 4. Corrosion test of prestressed concrete beam.
2.2. PPP-BOTDA monitoring system
The PPP-BOTDA equipment system is assembled, and the warm-up, calibration and parameter-setting steps are completed. The optical fibre drawn from the beam is connected to the equipment. When connecting the optical fibre, care should be taken to clean and protect the optical fibre interface. The optical fibre loop sequence is pump→probe (“pump” is the starting point when measuring). The measurement parameters are set, as shown in , and measuring is initiated.
Table 1. Parameter settings of the PPP-BOTDA monitoring equipment.
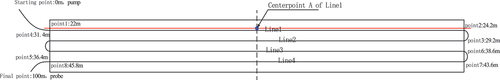
The PPP-BOTDA strain measurement system is used to monitor the strain on the prestressed concrete beam. The monitoring system is set to automatically record the change of measurement frequency every 10 minutes until an abnormal signal occurs when the prestressed steel breaks. The optical fibre is pasted on the side of the beam in an S shape, and its layout is shown in . The prestressed steel is shown in red; Line1 is at the top of the beam, Line4 is at the bottom of the beam, and the distance from the prestressed steel is more than 150 mm. Line2~Line4 are underwater.
Figure 5. Layout of optical fibre.
For the individual strain measurement calculation of PPP-BOTDA, the following equations are used:
where is Brillouin frequency shift with strain;
is Brillouin frequency shift without strain; C11 is the strain coefficient
;
is the strain; and the value of C11 taken here is 0.0497 MHz/με.
Since the temperature-sensing optical fibre and strain sensing are not laid in parallel in this test, the real strain in the strain segment can be obtained using the Brillouin frequency shift without the strain segment, calculated according to EquationEquations (1)(1)
(1) and (Equation2
(2)
(2) ). Because the Brillouin frequency shift in the strain-free section is caused by the temperature change, the temperature compensation is achieved by compensating the frequency shift change of the temperature change back to the original measuring fibre. The significance of temperature compensation is that it significantly improves the accuracy of the measurement results. The key point of automatic temperature compensation is that the temperature must be uniform (average value) in a wide measuring area. As shown in , Line1 is in an anhydrous environment; the strain value of the non-strain section in the anhydrous environment is used for temperature compensation. This part represents the temperature change of Line1. The strain measured by Line1 minus the strain generated by the temperature change indicates that the temperature has been compensated. In addition, since the laying positions of Line2, Line3 and Line4 are all underwater, the temperature changes of these three optical fibres are synchronised by default, so it is necessary to compensate the non-strain sections near the three optical fibres with the same temperature environment according to the actual laying method.
2.3. Electrochemical rapid corrosion test
A certain concentration of saturated NaCl solution was poured into the corrosion tank, and the corrosion power supply was energised. The current, voltage, indoor temperature, water temperature and measured value of the strain gauge on the prestressed steel were recorded every 30 minutes. Every 3 hours, the corrosion power supply is powered off and the corrosion products in the corrosion tank are cleaned up; after cleaning, the saturated NaCl solution is poured into the corrosion tank again, and the power supply is energised. The above test steps are repeated until the prestressed steel is completely broken and the test is completed.
During the test, the prestressed steel in the corrosion tank is gradually corroded. When there is water on the surface of the reinforcement, the anodic reaction of iron ionisation and the cathodic reaction of dissolved oxygen reduction occur at the same speed. The wire attached to the prestressed steel is connected with the anode of the constant DC power supply, while the cathode of the DC power supply is connected with the carbon rod in the solution, forming a loop through the NaCl solution, which corrodes the prestressed steel bar of the anode. Fe (OH)2 is precipitated on the surface of prestressed steel, and the compound is dissolved and oxidised to form iron hydroxide, Fe (OH)3, according to the following reaction equations (Bing, Citation2007):
3. Analysis of test results
) respectively show the micro-strain changes before and after the temperature compensation of the fibre, from 15 to 31 m. The blue (dashed) line is the micro-strain change before the fibre breaks, and the red (solid) line is the micro-strain change after the fibre breaks. The changes of micro-strain measured by Line1 and Line2 before and after the fracture of prestressing steel are shown in the frame of Line1 and Line2, respectively, and the rest of the graph is the micro strain of the free section. The coincidence of the red and blue lines in indicates that the free section of the optical fibre is not affected by the fracture of the prestressed steel bar, which is in line with the objective facts.
Figure 6. Strain change of 15m–31m optical fibre.
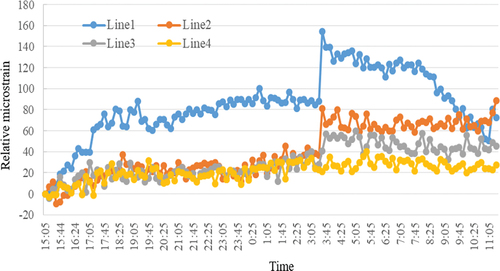
shows the micro-strain of the central positions of Line1, Line2, Line3 and Line4 on the prestressed concrete beam with time. As can be seen, the microstrain in Line1 is significantly greater than in the other three lines and the change in Line1 is most pronounced before and after fracture. This is because Line1 is closest to the prestressed reinforcement, followed by Line2 and Line3, while Line4 shows almost no significant change during the entire test. In summary, when the steel bar breaks, the distributed optical fibre could capture the signal in both anhydrous and underwater environments. Moreover, when the spatial distance between the signal acquisition position and the steel bar fracture position exceeds 150 mm, an obvious fracture signal will not be obtained.
Figure 7. Microstrain of central axis position changes with time.
As shown in , with the increase of corrosion time, the strain change of the Line1 position is the most obvious, followed by the Line2 position. The strain changes at the Line1, Line2, Line3 and Line4 positions are not significant before the corrosion of 4 hours to the fracture of the prestressed steel, but the strain changes are obvious in the first 4 hours of corrosion. This is because it is the first time in the corrosion tank. After pouring the NaCl solution, the solubility of oxygen is relatively large and the oxygen supply is sufficient. With the increase of salt concentration, the conductivity of the solution increases and the corrosion rate increases. However, as the amount of salt increases, the so-called solubility of oxygen in the solution decreases, and the corrosion rate also decreases, resulting in a maximum value of the corrosion rate of the prestressing force at a certain concentration. Combined with , it can also be seen that before 19:05, the strain change range at the centre of Line1 is larger, and after 19:05, the strain change range has a significant slowing trend. At 19:05, the on-site personnel powered off the corrosion power supply for the first time and treated the corrosion products on the surface of the prestressed steel.
Figure 8. Strain changes in Line 1 to Line 4 with corrosion time.
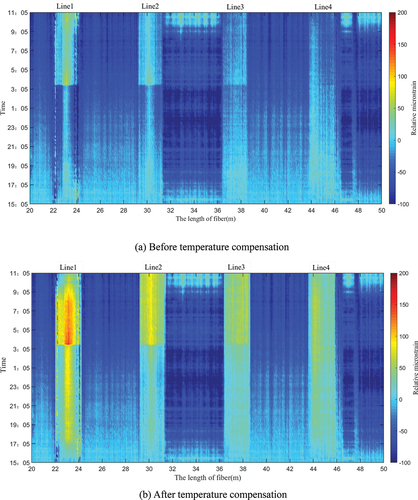
shows the spatial and temporal distribution of the measured relative microstrain in the prestressed concrete beam before and after temperature compensation, where the optical fibres at Line1–Line4 are attached to the beam as non-free segments and the rest of the positions are free segments. The relative micro-strain measured by the optical fibre in the non-free section is significantly larger than that in the free section, and the relative micro-strain in the middle position of Line1 is larger than that in other positions of Line1. This is because there is a corrosion groove in the middle of the beam top span. In the process of gradual corrosion of prestressing steel, the concrete deformation in the middle position of Line1 is larger than that in other positions.
Figure 9. Spatial and temporal distribution of relative microstrain.
4. Numerical simulation verification
4.1. Finite-element modelling
The large finite-element software Abaqus was used to calculate and verify the accuracy of the test results, in which the prestressed concrete beam was modelled using a separate modelling method. The concrete was simulated using a three-dimensional reduced integral hexahedral unit (C3D8R, as shown in ) and a concrete plastic damage (CPD) model; the common reinforcement and hoop bars were simulated using a two-node linear three-dimensional truss unit (T3D2). The prestressing wire can be simulated using both solid units (C3D8R) and truss units (T3D2), as shown in . As the wire is bonded to the concrete from the slotted position to the anchored end of the prestressing wire, the bond slip between the two is simulated using a non-linear spring unit (SPRING2), where the concrete and prestressing wire co-node is achieved by setting up units parallel and perpendicular, respectively, to the reinforcement. The concrete is not bonded to the prestressing wire at the corroded channel location, so there is no interaction between the prestressing wire and the concrete in this area of the numerical model.
Figure 10. Location of ordinary reinforcement and prestressed reinforcement.
The relevant material parameters in the finite-element modelling are as follows: the prestressed steel is 7 mm diameter cold drawn bright round steel wire with a strength grade of 1570 MPa; the ordinary reinforcement is 8 mm diameter Grade II steel (HRB335); the hoop bars are 8 mm diameter Grade I steel (HPB300), spaced at 100 mm; the concrete grade is C50. When the prestressed steel is simulated using a truss unit, the stresses can be applied by the cooling method: the temperature drops; the wire shrinks; the ends of the wire are fixed in the software, thus generating tensile stresses in the steel; and the concrete is subjected to compressive stresses, so the equivalent temperature load can be applied according to EquationEquation (7)(7)
(7) :
where ,
and
are the applied prestress, the coefficient of linear expansion of the prestressed steel and the coefficient of linear expansion of the prestressing wire in the absence of corrosion, respectively.
The mechanical property curves of the prestressed steel and the ordinary steel reinforcement are shown in , according to the tensile test of the prestressed steel and the compressive strength test of the concrete, while the relevant parameters can be found in and . The cube compressive strength of the concrete is 67.97 MPa, the axial compressive strength is 48.93 MPa, the axial tensile strength is 3.4 MPa and the modulus of elasticity E is 36,893.3 MPa.
Figure 11. Mechanical property test curve of prestressed reinforcement and ordinary reinforcement.
Table 2. Mechanical property parameters of the reinforcement material.
Table 3. Mechanical property parameters of C50 concrete.
4.2. Establishment of non-linear springs
Due to the simplicity of the prestressed concrete beam model in the tests, information about the non-linear spring was added to the input (INP) file after creating separate meshes of the same size for the prestressed steel and concrete.
Based on the experimental results of Houdle and Mirza (discussed by Bolong and Zhenxiang, Citation1985), the relationship between local bond stress and slip is given in cubic polynomial form, using the average slip value, as
where S is the slip (unit: cm) and is the local bond stress (unit: MPa). According to the slip, the local bond stress and the surface area of the contact between the prestressed steel and the concrete, the bond force required to establish the non-linear spring in the Abaqus calculation and analysis can be obtained, as shown in .
Figure 12. The relationship between bond force and slip of non-linear spring.
4.3. Corrosion fracture simulation methods
Based on the test monitoring results, when the prestressed steel fractures due to persistent corrosion, there is a significant strain change on the concrete surface. To verify the correctness of the monitoring results, the corrosion fracture of the prestressed steel was simulated by two different methods.
Method 1: The model change command in the contact module of the application software implements the passivation and activation of the cells. At the beginning of the calculation all cells of the structure are passivated (inactive). Then, according to the test steps, the cells of the corresponding stage are activated (active). During the process of corrosion of the prestressed steel, the effective cross-sectional area of the corroded section is gradually reduced, according to the corrosion rate; meanwhile, the ultimate strength, yield strength, and ultimate strain of the prestressed steel are changed. At the fracture step of the steel, the unit of steel at the fracture point is passivated again, thus achieving the fracture simulation of the prestressed steel.
Method 2: Apply the Abaqus unit deletion function and write the Abaqus subroutine USDFLD using the FORTRAN language. In the process of local corrosion of the prestressing reinforcement, due to the existence of initial defects at certain locations, the uniformity of the degree of corrosion is not guaranteed in the process of corrosion. The locations where initial defects exist appear as stress concentrations during continuous tension, and when the stress exceeds the ultimate tensile strength of the material, the prestressed reinforcement fractures. In summary, according to the Mises yield criterion, when the Mises stress in the corroded unit of the prestressing bar exceeds the ultimate tensile strength of the material, the material is considered to have failed and the unit is deleted. The deletion of the unit is controlled by the state variable, which is defined as 0 when the ultimate tensile strength of the material is not exceeded and as 1 when it is exceeded, in which case the unit is deleted. During the gradual corrosion of the reinforcement, the effective cross-sectional area of the reinforcement is gradually reduced, and the reduction in area is more pronounced at locations where initial defects exist, making Method 2 more suitable for fracture simulation of solid units of reinforcement.
4.4. Analysis of simulation results
The strain difference in the outer concrete before and after the prestressed reinforcement fracture is small when simulating the prestressing bar using different cell types; it can be seen that the strain difference between the middle positions of Line1 and Line4 is less than 5με . Therefore, it can be concluded that the simulation results of both cell types can reflect the effect of prestressing bar fracture.
Figure 13. Comparison of simulation results for the solid element and the truss element.
shows the strain changes in the middle of the concrete soil beam at the time of prestressing wire breakage using two different simulation methods. The first simulation method is the model change direct cell deletion method, while the second simulation method simulates the effect of corrosion on the reinforcement by reducing the cross-sectional area of the prestressing wire in the corrosion area, simplifying the corrosion process and determining the material failure based on the ultimate stress in the cross-section. As can be seen from , the relative difference between the results obtained by the two simulation methods and the measured results is within the limits. During the actual monitoring process, strain variations within the limits of the strain will not be obtained by applying the monitoring equipment of this test.
Figure 14. Strain change of prestressed steel before and after fracture.
and show the strain variation in concrete at the Line1 position at different corrosion times. It can be seen that the strain variation is greater in the first 4 hours after the start of corrosion and decreases significantly in the later period, whether measured in the test or simulated numerically. According to the comparison of the two results above, the strain change at the Line1 location, which is spatially closest to the prestressing wire, is approximately 50 to 60 με for 12 hours of corrosion.
Figure 15. Comparison of experimental and numerical simulation strain results (centre position of Line1).
and show the changes in strain over time at the Line1 position, obtained by test monitoring and numerical simulation. The curves obtained by the two methods have the same change trend, and the strain at the middle position is obviously larger than that at both ends. At the same time, the strain changes obviously at the beginning of corrosion, and the strain change gradually decreases as the corrosion time increases.
Figure 16. Strain change of Line1 (numerical simulation).
Figure 17. Strain change of Line1 (monitoring test).
5. Conclusion
In this study, PPP-BOTDA is used to monitor the real-time deformation of prestressed concrete beams in corrosive environment. During the test, the effect of accelerating the corrosion of prestressed steel bars is achieved by applying DC current, and the correctness of the test results is verified by finite-element numerical simulation. The following conclusions are drawn:
In the early stage of corrosion of prestressed reinforcement, as the concentration of NaCl increases, the conductivity of the solution increases. Meanwhile, the corrosion rate accelerates, the degree of corrosion of prestressed reinforcement is significant, and obvious changes in the surface strain of concrete beams are observed. As the corrosion time increases, the corrosion rate decreases, the degree of corrosion of prestressed steel bars weakens, and the surface strain change of the concrete beams is no longer significant until the prestressed steel bars undergo fracture and failure.
At the moment of corrosion fracture of the prestressed reinforcement, the sensing fibre could monitor significant changes in the strain of the concrete when the spatial distance between the fractured steel and the sensing fibre was less than 150 mm; it essentially could not sense the changes when the spatial distance was greater than 150 mm. At the same time, the underwater environment does not affect the transmission of monitoring data, and continuous strain monitoring data could still be obtained in space, while the location of the fracture of the prestressing reinforcement could be accurately located.
Different finite-element simulation methods are used to simulate the fracture of prestressed steel bars. A comparison with the monitoring test results shows that both methods can accurately obtain the strain change at the moment of fracture of the steel bars, which provides a reference for further research on the simulation of corrosion fracture of steel bars.
According to the results of the strain monitoring test, the distributed fibre optic sensing end can be applied to the deformation monitoring of prestressed structures, and can achieve the monitoring and positioning of abnormal deformation of the structure under both deflation and water circulation conditions, which has good promotion value.
Disclosure statement
No potential conflict of interest was reported by the authors.
Additional information
Funding
References
- Bing, L. (2007). Study of effect of stresses on the fracture behavior and corrosion of prestressing steel wires [D]. Shanghai Jiao Tong University.
- Bolong, Z., & Zhenxiang, D. (1985). Nonlinear analysis of reinforced concrete [M]. Tongji University Press.
- Fang, Y., Jinqing, J., & Yupu, S. (2012). Experimental research on fatigue behavior of prestressed concrete beams with corroded steel strands [J]. Building Structure, 42(1), 1–14.
- Fumin, L., Tianci, D., Jianghao, W., & L. Xiao Ya. (2015). Review of research on durability of prestressed concrete structures [J]. Journal of Architecture and Civil Engineering, 32(2), 1–20.
- Gu, P., Wang, L., Deng, C., & Tang, L. (2017). Review of typical failure characteristics of aqueduct structures in China [J]. Advances in Science and Technology of Water Resources, 37(5), 1–8.
- Honghu, Z., & Bin, S. (2015). Current progress and trends of opto-electronic sensor-based monitoring in geoengineering: A summary of 5th OSMG-2014 [J]. Journal of Engineering Geology, 23(2), 352–360.
- Hou, G.-Y., Li, Z., Hu, T., Zhou, T., Xiao, H., Wang, K., Hu, J., & Zhu, J. (2020). Study of tunnel settlement monitoring based on distributed optic fiber strain sensing technology [J]. Rock and Soil Mechanics, 41(9), 3148–3158.
- Kishida, K., Li, C. H., & Nishiguchi, K. (2005). Pulse pre-pump method for cm-order spatial resolution of BOTDA. In Proceedings SPIE 5855, 17th International Conference on Optical Fibre Sensors, 559.
- Li, F., & Yuan, Y. (2010). Experimental study on bending property of prestressed concrete beams with corroded steel strands [J]. Journal of Building Structures, 31(2), 78–84.
- Moffat, R., Sotomayor, J., & Beltrán, J. F. (2015). Estimating tunnel wall displacements using a simple sensor based on a Brillouin optical time domain reflectometer apparatus[J]. International Journal of Rock Mechanics & Mining Ences, 75, 233–243. https://doi.org/10.1016/j.ijrmms.2014.10.013
- Shiqin, H., Zeyang, C., Weijie, L., & Pengfei, L. (2019). Influence of long-term load and chlorine corrosion on reinforced concrete beam deflection [J]. Journal of Tsinghua University (Science and Technology), 59(11), 902–909.
- Xu, G., Zhang, D., Liu, D. F., & Wei, J. (2012). Research on mechanical properties of corroded steel bar in concrete under chloride environment [J]. Journal of Hydraulic Engineering, 43(4), 452–459.
- Yang, R., Zhang, J., Wang, L., & Zhang, X. (2008). Experimental research for flexural behavior on concrete beams with local corrosion fracture of strands [J]. Journal of Central South University: Science and Technology, 49(10), 2593–2601.
- Yi, W., Kunnath, S. K., Sun, X., & Shi, C. (2010). Fatigue behavior of reinforced concrete beams with corroded steel reinforcement [J]. ACI Structural Journal, 107(5), 526–533.
- Yu, F., Jia, J., Yao, D., & Wu, F. (2014). Experimental analysis of fatigue properties of corroded prestressing strands [J]. Journal of Harbin Engineering University, 35(12), 1487–1491+1502.
- Zhao, L., Tang, F., Verstrynge, E., Ren, L., & Li, H.-N. (2022). Experimental and numerical investigation into corrosion-induced mortar/concrete cracking with distributed optical fiber sensors [J]. Journal of Civil Structural Health Monitoring, 12(4), 943–960. https://doi.org/10.1007/s13349-022-00589-x
- Zhou, Z., He, J., Wu, Y., & Ou, J. (2010). Measurement technique based on the FBG-BOTDA(R) for infrastructures [J]. China Civil Engineering Journal, 3(43), 111–118.
- Zhu, E.-Y., Liu, C., He, L., Zhang, H. W., & Xie, N. (2006). Stress performance analysis on corroded pre-stressed concrete beam [J]. China Safety Science Journal, 16(2), 136–140+146.