 ?Mathematical formulae have been encoded as MathML and are displayed in this HTML version using MathJax in order to improve their display. Uncheck the box to turn MathJax off. This feature requires Javascript. Click on a formula to zoom.
ABSTRACT
Developing rural areas in the Philippines are in urgent need of advanced technologies and analytical solutions to optimise the use of the existing gravity-fed scarce water supply and its proportional distribution to the community. Low water velocity, pipe clogging, tank spills, and unequal water distribution are among the challenges being faced by the Waterworks Supply System in Bontoc, Philippines. EPANET software was used to resize the distribution pipes to maintain optimal water flow. To maximise the use of the available water supply, analytical models were developed to determine the maximum number of taps to be connected per source, the water service time variation at a certain discharge, and the specified water service hours per manifold for proportional water supply to every tap. The analysis showed that optimisation of a gravity-fed water supply can mitigate pipeline clogging, unequal water supply distribution, and spills on main tanks.
ABSTRAIT
Les zones rurales en développement des Philippines ont un besoin urgent de technologies de pointe et de Solutions analytiques pour Optimiser l’utilisation de l’approvisionnement en eau rare existant alimenté par gravité et de ses proportionnelle à la communauté. Faible vitesse de l’eau, colmatage des tuyaux, déversements de réservoirs et distribution inégale de l’eau font partie des défis auxquels est confrontée l’Alimentation en eau dans la Cordillère, aux Philippines. Le logiciel EPANET a été utilisé pour redimensionner les conduites de distribution Maintenez un débit d’eau optimal. Afin de maximiser l’utilisation de l’approvisionnement en eau disponible, les Des modèles ont été développés pour déterminer le nombre maximal d’entailles à connecter par la variation de la durée du service d’eau à un certain débit et le service d’eau spécifié heures par collecteur pour une alimentation en eau proportionnelle à chaque robinet. L’analyse a montré que L’optimisation d’une alimentation en eau par gravité peut atténuer le colmatage des canalisations, la distribution inégale de l’approvisionnement en eau et les déversements sur les réservoirs principaux.
1. Introduction
Intermittent water supply, insufficient water pressure, and unpredictable service are wide-ranging problems in developing municipal water supply systems in the Philippines, including the indigenous municipality of Bontoc in the Cordillera Region. This problem imposes substantial costs on households and commercial establishments, encompassing both direct financial expenditures and broader economic ramifications (Ballos et al., Citation2019). Residents of Bontoc have been protesting and complaining about water shortages since 1973 (Marrero & Marrero, Citation2018). The Bontoc Municipal Waterworks Unit (BWU), the largest public water supply system in the municipality, can only supply water for a few hours per day, and water pressure is irregular. Moreover, water quality in the BWU system often cannot be ensured.
Water supply in this municipality is provided through a combination of public and private entities. Most barangays rely on level 2 potable water systems managed by the local government unit. The largest public water supply system in the area, as depicted in , is operated by the Bontoc Municipal Waterworks Unit (BWU) and serves the four central barangays. BWU utilises two primary water sources (see ): the Balabag source with an average discharge of 1900 m3/day, and the Sullong source with an average discharge of 368 m3/day.
Figure 1. Schematic of the water supply system of Bontoc, Mountain Province.
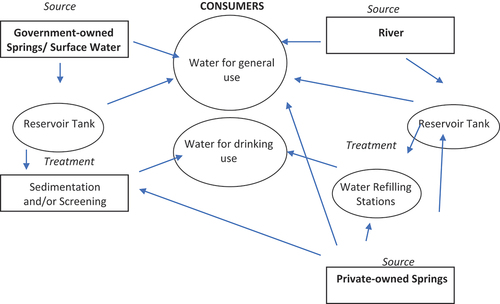
Table 1. Discharge from water sources (L/s).
In this study area, numerous households have resorted to tapping small springs to supplement the water provided by BWU or, in some cases, to serve as their primary domestic water source. There are 14 additional springs that supply barangay Bontoc Ili, six for Poblacion, 12 for Caluttit, and 10 catering to Samoki, as reported by BWU in 2014. Many of these springs are privately owned, imposing monthly water fees ranging from 400 to 1000 pesos, depending on the volume of water collected. For households inadequately served by BWU and private springs, private water delivery trucks have become a costly but necessary alternative. These truck owners charge rates approximately 10 times higher than BWU, but they alleviate the physical labour and time involved in water collection from springs or river sources. Furthermore, the water services system exhibits an imbalanced scheduling of water supply to consumers. As a water distribution system ages, its capacity to transport water diminishes while the demand for water typically increases, leading to both operational inefficiencies and economic repercussions.
In light of these challenges, the overarching objective of this study is to optimise the distribution of the limited water supply provided by the local government unit to consumers residing in the Central Barangays of Bontoc, Mountain Province. Specifically, the study seeks to characterise the waterworks distribution system, employ EPANET hydraulic simulation to resize distribution pipes, determine the optimal limits for the number of taps per water source, analyse variations in water service duration, and propose a reconfigured water service schedule aimed at achieving equitable water distribution.
1.1. Water supply distribution system characteristics
1.1.1. Water source discharge
Although Bontoc has both private and public waterworks services, this study focuses on the sources utilised by the Municipal Waterworks Office (MWWO), as shown in . The Sullong water source is located in Sitio Lanao, Bontoc Ili, 902 m from the main road and accessible in an average of 35 min by hiking. The Balabag water source is located in barangay Talubin, 19.5 km from Central Bontoc and 72 m from the main road. The Gakhan water source is still under development and is not yet utilised as an additional source for the MWWO. Of the two operating sources, Balabag is the more accessible to most households in Central Bontoc.
1.1.2. Daily consumption patterns
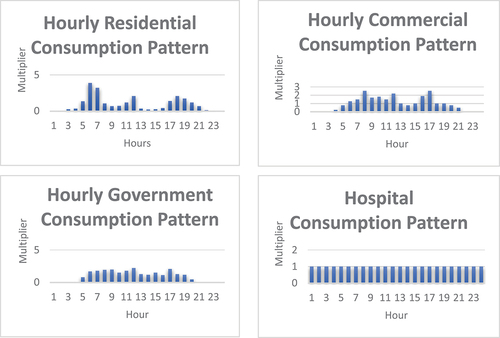
Based on the average hourly demand at each outlet node, EPANET allows users to predict different water use patterns. For this system, each residence was given a daily average demand in L/min (Dubasik, Citation2017). To approximate community water use over a 24 h period, a daily water consumption pattern was established based on water meter information. Each hour of the day was given its own multiplier, and they were all averaged out to equal 1, allowing each manifold to meet the prescribed daily requirement (see ).
Figure 2. Consumption patterns per category.
1.1.3. Determining water demand
Water demand was determined for EPANET modelling. Water demand in four categories was determined by installing water meters for randomly selected participants per category. Observations were conducted for a 6-month period that included 3 months of the dry season and 3 months of the wet season. The findings are shown in . Residential demand averaged 115 L/day during the study period. However, Marrero and Marrero’s (Citation2018) findings in 2016 state that average domestic water use for Bontoc averages 90 L/day using the bucket method, compared to the result in of 115 L/day using the water metering method.
Table 2. Water demand per category.
Using the community classifications of the Local Water Utilities Administration (2020), rural communities consume 100 litres per capita per day (Lpcd), developing communities 110 Lpcd, urbanised communities 120 Lpcd, mixed urban commercial communities 130 Lpcd, and highly urbanised communities 140 Lpcd. The findings of the study lay between developing communities (110 L/day) and urbanised communities (120 L/day).
Commercial establishments in Bontoc that were included in determining demand are hotels, restaurants, cafés, bakeries, and public markets. A café commercial establishment has the lowest demand while the Bontoc Public Market has the highest daily commercial water demand.
Government institution buildings reach a mean demand of 4644 L/day. Water-metered government institution buildings for the study are: elementary to tertiary schools, one museum, one local government unit office, provincial offices, a church, and a dormitory. The Bontoc Municipal Capitol, with 237 employees, has the highest average water consumption, and Bontoc Central School had the lowest consumption for the government category.
The water demand of Bontoc General Hospital (100 bed capacity) is separated from that of other institutions for it requires a 24 h water supply from the system to operate efficiently. Typical water use in hospitals ranges from 26,344 to 230,000 L/day (Massachusetts Water Resources Authority [MWRA], Citation2020).
1.1.4. Map of existing waterworks distribution system
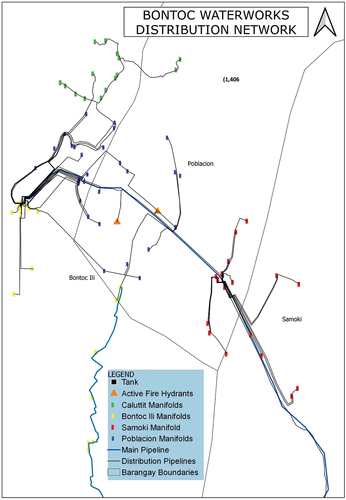
A base map was created using Quantum Geographic Information System (QGIS) software. Spatial data were extracted from a global positioning system (GPS) and converted to plot coordinates, elevation, and tracks. By creating numerous thematic maps and combining diverse field and administrative data in a GIS environment, the use of GIS for water system projects will aid in the optimisation of an adequate water distribution network (Mansi et al., Citation2016).
The created waterworks distribution network caters to 1406 taps including unregistered connections or illegal taps. Two main control panels are located near the header tank in barangay Bontoc Ili at an elevation of 923 m above mean sea level (amsl), and one is near a bridge at 850 m amsl in barangay Samoki. The layout in can be classified as a tree or dead-end distribution system since all manifolds are supplied by water at one end. The mode of distribution is gravity and tanks are all situated at a higher elevation to supply consumers at an effective head. As the study area population is growing faster than infrastructure development such as roads and pathways, a lot of tap lines are exposed or visible along sidewalks or even cabled above roadways.
Figure 3. Distribution network base map as of 2021.
In this distribution network, some elements are connected depending on the availability of materials and the budget to be used. For example, instead of using reducers, elbows, and angle stops for manifold tapping, the most practical and available tool is a welding machine. Pipes are reduced by welding larger pipes to smaller pipes instead of purchasing reducers. Manifold ends are covered with a welded piece of metal instead of installing an angle stop. These manifolds are also practically inclined by a welded perpendicular pipe from the supply pipe. These situations inn all manifolds have resulted in the accumulation of water impurities over time during low water velocity, and flushing is hard to accomplish.
Due to the lack of base map records of the system including opening valve schedules, employees often take a long time to become familiar with the distribution network and schedules. Water is a daily need and any error in opening valves causes direct complaints from consumers. To help improve the waterworks company’s service to consumers, a base map is created to address such problems.
Control panels () are a major part of the existing distribution system. Unlike developed water districts in the country, control panels for a developing waterworks system gradually increase in connected manifolds, just as in the MWWO services system. Future development planning must consider possible additional connections in the next 5 years.
Figure 4. Control panels A and B.
1.1.5. Water service hours
The water supply distribution system is intermittent; therefore, servicing water to consumers is scheduled per day. The schedule for opening valves is set by the Bontoc MWWO as shown in . The minimum water service to consumers is only 2 h, whereas the maximum is 10 h. Some manifolds for residential use and one for hospital use are open 24 h. Most valves are closed from 10.00pm to 4.00am due to the end of personnel shifts.
Table 3. Current water service hours.
1.1.6. Manifolds and taps
Data gathered on manifolds and numbers of taps (in ) were acquired through field survey with the use of a GPS device that records the elevation and coordinates of manifolds, and tracks of pipelines. We observed many illegal taps connected along exposed main and sub-main lines. Illegal taps happen when distribution pipelines are not buried; inspection is rare. Installation or connection of individual household water pipes without the consent of the Bontoc Water Services is one of the problems mentioned by Manochon (Citation2010).
Table 4. Manifolds and population per barangay.
1.1.7. Tanks and pipes dimensions
The existing water system has two sedimentation and/or storage tanks and one head tank located within the community. A sedimentation tank offers some degree of purification by allowing suspended particles to settle as it passes through the tank, while a head tank’s function is to maintain the energy level in pipes so it can provide a constant and reliable water supply to the consumers. These tanks are rectangular in form, but their dimensions have been adjusted to cylindrical form as shown below () for EPANET software modelling.
Table 5. Tank dimensions.
Pipe diameters were recorded through onsite measurements of pipes (). The MWWO former staff states that some five- and six-inch pipes were installed in the 1960s and still function efficiently. The total length of pipes was estimated using measurement tools in Google Earth Pro.
Table 6. Pipe diameter and lengths.
2. Research methods
2.1. Study framework
The study was conceptualised to optimise the use of the existing water supply in the distribution system of Bontoc Municipal Waterworks Services and to mitigate the emerging water-related conflicts and problems being faced by the office. The study used of software models using the data acquired during the characterisation and development of mathematical models. In this study, the EPANET software integrated with GIS was used to input the spatial and non-spatial data, water velocity, and elevation per manifold or node for hydraulic simulation. The study framework used as a guide in achieving the objectives of the study is presented in .
Figure 5. Framework of the study.
2.2. Data gathering tools
To characterise the system, water discharge from sources was measured using an FP211 Flow Probe 5.5 Flow Meter as velocity in m/s. For water discharge before the head tank, an ultrasonic flow meter powered by a 24 V battery was used. It was set up according to the Z method based on the pipe material being used. Water demand data gathering was implemented by installing half-inch and one-inch mechanical flow meters. Since this equipment may be used in a variety of scenarios, ultrasonic flow meters are a cost-effective alternative for larger pipe size.
A GPS was used in locating the distribution of objects on maps (Panamaldeniya, Citation2021); thus it was used to record elevations and coordinates of map elements. To accurately estimate the length of pipes as far as possible without the use of total stations, Google Earth Pro version 2022 was used. The Google Earth platform has made remote sensing picture processing easier and more efficient due to its real-time updates of imagery (Gao et al., Citation2022). An unmanned aerial vehicle was used for tracking pipelines in dense areas.
2.3. Modelling of distribution system
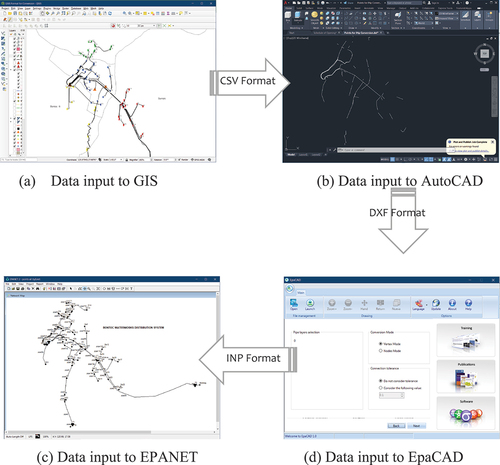
GIS is a computer system tool that allows visual representation of various types of spatial data in connection with geographic information in a way that is easy to comprehend (Nilsson & Tjernberg, Citation2023). GIS is compatible with other software tools. In this study, data was exported from ArcGIS in CSV format () to be accepted by AutoCAD software in order to be converted into DXF format (). The purpose of this data conversion is to have the data in INP format using EpaCAD software () after using AutoCAD. Finally, the data is imported to EPANET software () as the distribution network can be visualised and may be processed for hydraulic simulation. EPANET is an important model for assessing the performance of water distribution networks (Sela et al., Citation2019) by simulating pressure, head, velocity and flow. Pressure and values are affected by elevation, while velocity and flow values are simulated based on elevation, base demand per node and consumption pattern.
Figure 6. Process of GIS data conversion to EPANET.
2.4. Modelling limitations and considerations
Given that one of the objectives of this study is to optimise pipe sizes based on the mean discharge rate of an intermittent water supply within the context of EPANET, it is imperative to address specific limitations and considerations, which we do below.
2.4.1. Comprehensive leakage management
Minimising the potential sources of errors during data gathering is paramount to enhancing the reliability and efficiency of the software. The need to account for all possible leakages in the water supply system is addressed by reducing the uncertainties and inaccuracies in the data used for resizing pipes in EPANET. Effective leakage management contributes to the robustness of the analysis and its ability to generate practical solutions for optimising hydraulic systems.
2.4.2. Leakage detection methodology
Accurate leakage detection is crucial for reliable modelling and optimal pipe sizing. The initial stage of leakage detection involves a multi-pronged approach. The first step is pressure and water level monitoring at nodes, which provides real-time insights into potential leakage points. Subsequently, a visual inspection complements the data gathered through monitoring, allowing for visual identification and assessment of leakage concerns. This combined methodology ensures a comprehensive understanding of leakage dynamics within the system.
2.4.3. Water discharge calibration
Calibrating water discharge measurements is essential for accurate modelling. To ensure precise data, the calibration of water discharge measurements is conducted by maintaining a controlled discharge rate at the main control panel, simulating the most probable steady-state discharge conditions. Concurrently, water discharge at nodes is meticulously recorded while the main panel is operating at the mean water discharge. This approach enables the alignment of measurements with real-world operational conditions, enhancing the accuracy of the subsequent modelling and resizing process.
2.5. Mathematical modelling
2.5.1. Optimal number of taps
To solve for the value of the optimal number of taps (No), the total water supply (mean discharge Dm multiplied by total service time T) is approximately distributed to the total number of consumers per household at the mean value considering water demand per person per day. The optimal number of taps to be connected to the mainline from a single water source is defined by EquationEquation (1)(1)
(1) :
where:
| No | = | – optimal number of taps based on mean discharge; |
| Dm | = | – mean discharge of the main pipeline; |
| T | = | – total service time; |
| WDh | = | – determined household water demand; |
| HNm | = | – determined mean household members. |
The amount of main pipeline discharge is derived from the mean value of 12 months of water discharge gathering, while the value for household members at mean is based on the recorded number of family members per household within the water service area.
2.5.2. Water service schedule variation
The constraint of changing the water supply service schedule due to water discharge variation is defined by Equation (2):
supplying water to taps while maintaining a half-full tank level. Maintaining half of tank capacity () allows the collection and distribution of water supply during water tank intake discharge variation. The intake discharge (Di) affects the water service schedule and is dependent on the variation of outtake discharge (Do) values, while 24 h is determined to be the total service time (Tt) to maximise the use of water supply from the source.
If , add more water service time to consumers to optimise water supply. This is to prevent water spills and distribute instead to consumers going to their taps to maximise the incoming water supply. Such alternative solutions can minimise the cost of resorting to private water supplies that charge a higher cost of water supply service.
If , lessen water service time to consumers to prevent emptying the main tank. One-fifth of the tank capacity was considered in the computation due to the possible presence of coarse water impurities at a lower level of tanks used in a gravity-fed water supply system.
2.5.3. Water service schedule reconfiguration
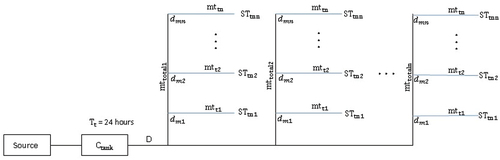
Water service time on every manifold where taps are connected is dependent on the most probable equal amount of water supply to be delivered per tap. Thus, the constraint for equal water supply to be received per tap is defined by EquationEquation (3)(3)
(3) :
where:
| STt | = | – total service time per tap; |
| Do | = | – outtake water discharge from tank; |
| Tt | = | – water supply total service time; |
| mt | = | – taps in one manifold; |
| mttotal | = | – total taps in all manifold; |
| dm | = | – manifold discharge. |
Unequal discharge is expected on each manifold, with varying pressure values. The use of EquationEquation (3)(3)
(3) is dependent on the variation of discharge values to be provided by EquationEquation (2)
(2)
(2) . The use of these equations will not require any additional measurements of pressure, elevation, and non-revenue water volumes due to the situational consideration of actual discharge values so far as possible. The formulation of these mathematical models can be used to calculate the optimum probable values underlying specific observable events considering the occurrence of minimal errors (Depillis & Radunskaya, Citation2013).
3. Optimisation results and discussion
3.1. Resized pipes in the system
As a CSV file is extracted from GIS converted to INP format to be compatible with the data simulation of EPANET, making the imported pipeline data creates numerous nodes; therefore, recreating the lines is necessary. In , manifolds in GIS are classified as junctions, intersections as nodes, pipelines as links, and source as reservoirs in EPANET.
Figure 7. Waterworks distribution system elements imported into EPANET.
Elevation affects the value of pressure calculation at each manifold (Wannapop et al., Citation2018); therefore, elevation must be considered for its relationship to flow and velocity as stated by the Bernoulli principle (Stanmech, Citation2019). Based on elevation () above mean sea level, the lowest elevation manifold drops to 847 m while the highest goes up to 917 m ().
Figure 8. Contour plot.
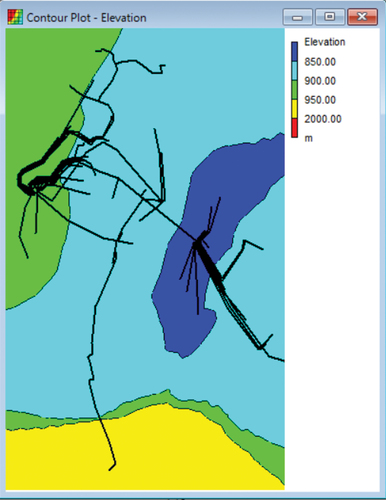
Figure 9. Elevation and pipe diameters.
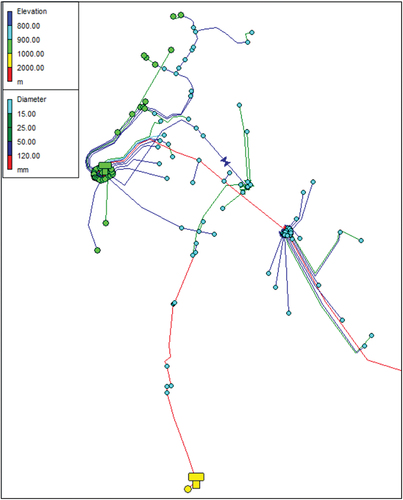
In the scenario where of all valves are open for water service distribution, the Balabag Head tank can only deliver water within 37 min. The lowest velocity during the peak demand at 7am for residential use is 0.16 m/s. With a velocity lower than 0.6 m/s, pipes are vulnerable to sediment accumulation which can result in the blocking of pipes for a period of time (Wurbs & James, Citation2002). To mitigate such a scenario, modification of pipes using commercial size pipes was implemented as trial and error inputs to EPANET until the velocity became higher than 0.6 m/s.
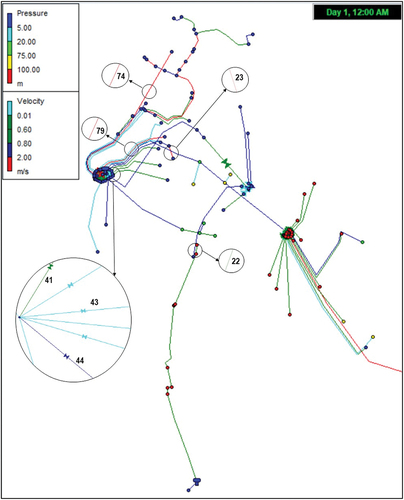
After the distribution pipe modifications for Junctions 74, 79, 22, 23, 43, 44 and 41 (), such pipes can provide water at a minimum velocity of 0.86 m/s if their diameter is reduced from the current 2 inches to 1 inch. Nominal pipe size diameter reduction shows in this software that velocity and pressure increase as diameter decreases. Due to limited supply, the main tank is only capable of distributing water at a maximum of 11 h at mean water source discharge.
Figure 10. Pressure and velocity during peak demand.
3.2. Optimum number of taps to be supplied
Each water source in the study area consists of its own reservoir tank; one is near the catchment while the other is near the taps locations. A gravity-fed water supply has different discharge values at every tail end or node due to varying pressure with respect to changing elevation (Swamee & Sharma, Citation2000). Therefore, the study acquired discharge values per manifold using an ultrasonic flow meter using the Z method, considering that the main discharge value from tanks is at the same value during the data gathering time. This gathering data technique was used to neglect non-revenue water values in the system other than tank spills.
Using the main discharge value as shown in , acquired household water demand and mean number of household members, the total number of taps to be connected directly from tanks was determined at optimal counts. A 24 h service time was considered to optimise the total time that can be rendered to consumers as the water supply is scarce, especially during the summer season.
Table 7. Optimised number of taps to be supplied using Equation (1).
Additional taps, numbering 510 to be supplied for Balabag Tank and 588 for Sullong Tank, can be added in observance of fairness of the total amount of water to be supplied per manifold. However, additional taps grouped in manifolds would vary in discharge value; therefore, the installation of additional taps should consider the manifold discharge value.
3.3. Water service time variation
Upgrading the performance of any type of service is a necessary tool for adding value to the community (Quazene et al., Citation2021). One way to optimise the water supply service is to calculate when to change the water service schedule with respect to occurring water discharge variation. To obtain the results in , EquationEquation (2)(2)
(2) was used to optimise the distribution of water supply, while taps connected were optimised as well through the use of EquationEquation (1)
(1)
(1) .
Table 8. Calculated warning discharges for water supply variation.
The expected water spill at Balabag Tank 1 (Pattig) can be resolved if and only if the water supply service increases in duration. Also, emptying of the tank can be avoided if and only if the water supply service is decreased if the main discharge value reaches the warning discharge as shown in the table above. The same scenario can be applied to the Sullong Tank.
3.4. Reconfigured water service hours
Fairness is a key consideration while examining scheduling solutions to provide outstanding service to customers at different periods (Ala et al., Citation2021). In this part, the mathematical model was used to consider fairness. To alleviate the unbalanced distribution of water to consumers (Manochon, Citation2010) and gain the optimal use of water while making an allowance for fairness, water service hours were modified using EquationEquation (3)(3)
(3) . Computation of optimal numbers of taps (EquationEquation 1
(1)
(1) ) and calculation of water supply schedule variations (EquationEquation 2
(2)
(2) ) were considered before the water supply schedule reconfiguration ().
Figure 11. Schematic diagram of water service time distribution.
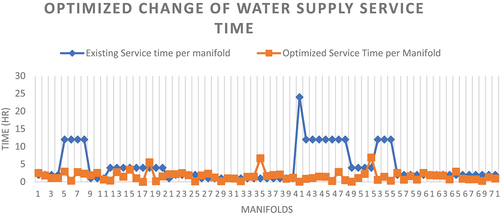
The difference in water supply service time between the existing schedule and the optimised values (hours: minutes: seconds) are presented in . The blue line in the figure shows an unbalanced water supply schedule with discharge value not being considered, and the orange line shows the optimised time while considering the observance of fair water supply distribution. Such calculations were also considered due to the existing equal cost per household connection.
Figure 12. Time difference in the water service schedule between the existing and optimised values.
Limitations of the use of reconfigured values below, however, can still be modified if the municipal water system services lack the manpower to execute the 24 h water service time, and may be rounded off if uniformity of service time will be prioritised due to the numerous manifolds to be considered. In general, simulated values are to show the improvement and optimisation of existing water supply distribution amidst its scarcity. The addition of water supply may be considered as a modification of the study if applicable.
4. Conclusion and recommendations
In consideration of the current municipal classification of Bontoc as second class, suggestions of improvement that are significant but as low-cost as possible must be prioritised. The use of public domain software such as EPANET and GIS is recommended for hydraulic simulations. Simulating flow values without making manual measurements at numerous manifolds at the same time can help to improve equal water distribution by strategically alternating the deliveries to different paths of the system. MWWO employees should also take part in training regarding the system’s administration, organisation, leadership and financial components.
Reconfiguration of the water service schedule for a gravity-fed water supply system may be achieved using the new mathematical model developed in EquationEquations (1(1)
(1) –Equation3
(3)
(3) ). It is important to consider factors and limitations to accurately optimise water supply. Moreover, it is important to note that the only non-revenue water considered in the calculation is the possible tank spills. It is then recommended to measure actual water discharge per manifold under the condition that the main discharge is constant.
Acknowledgments
The researchers thank the Bontoc Municipal Water Works Office for providing information, datasets and assistance on several fieldwork trips conducted by the authors. Thanks are extended also to Mountain Province State Polytechnic College – Research Development, and Extension Staff, for their support in the accomplishment of the study.
Disclosure statement
No potential conflict of interest was reported by the authors.
Data availability statement
The data that support the findings of this study are available from the corresponding author, E.B. Magwilang, upon reasonable request.
Additional information
Funding
References
- Ala, A., Alsaadi, F. E., Ahmadi, M., & Mirjalili, S. (2021). Optimization of an appointment scheduling problem for healthcare systems based on the quality of fairness service using whale optimization algorithm and NSGA-II. Scientific Reports, 11(1), 1. https://doi.org/10.1038/s41598-021-98851-7
- Ballos, A., Japzon, B. J., Tanseco, A., Tangzo, L., & Zamora, E. (2019). Optimization design of water distribution system of Catbalogan City, Samar using EPANET. Journal of Academic Research, 4(2), 46–13. https://jar.ssu.edu.ph/index.php/JAR/article/view/148
- Depillis, L., & Radunskaya, A. (2013). Chapter 4 best practices in mathematical modeling. https://doi.org/10.1007/978-1-62703-050-2_4
- Dubasik, F. (2017). Panning for intermittent water supplyin small gravity-fed distribution systems: Case study in rural Panama. Open Access master’s Report, Michigan Technological University. https://doi.org/10.37099/mtu.dc.etdr/1217
- Gao, C., Wu, Q., Dyck, M., Fang, L., & He, H. (2022). Greenhouses detection in Guanzhong Plain, Shaanxi, China: Evaluation of four classification methods in Google Earth engine. Canadian Journal of Remote Sensing, 48(6), 747–763. https://doi.org/10.1080/07038992.2022.2117687
- Manochon, A. M. (2010). Indigenous management of water resources in Bontoc. University of the Philippines College of Social Sciences and Philosophy.
- Mansi, P. M., Marvadi, B. M., Patel, A., & Prakash, I. (2016, April). Planning of water distribution network using GIS techniques. International Journal of Advanced Research in Engineering, Science & Technology, 4(2).
- Marrero, E., & Marrero, A. (2018). Estimating and forecasting domestic water demand in Mountain province, Philippines. International Journal of Advanced Research, 6(7), 1004–1012. https://doi.org/10.21474/IJAR01/7451
- Massachusetts Water Resources Authority. (2020). Water use case study Norwood Hospital – Norwood Massachusetts. Retrieved September 12, 2022, from https://www.mwra.com/04water
- Maza, C. (2013). World water day: Why access to clean water is a crucial social justice issue. MIC. https://www.mic.com/articles/30766/world-water-day-why-access-to-clean-water-is-a-crucial-social-justice-issue
- Nilsson, P.-O., & Tjernberg, I. (2023). Lyme Neuroborreliosis—Significant local variations in incidence within a highly endemic region in Sweden. Microorganisms, 11(4), 917. https://doi.org/10.3390/microorganisms11040917
- Panamaldeniya, L.(2021). Timely importance of GIS, GPS, and RS. In Conference paper researchgate September. Timely importance of GIS, GPS, and RS. Retrieved from https://www.researchgate.net/publication/366846973_TIMELY_IMPORTANCE_Of_GIS_GPS_A
- Quazene, Y., Arbaoui, T., & Yalaoui, F. (2021). Planning and scheduling optimization. Applied Sciences, 11(19), 8980. https://doi.org/10.3390/app11198980
- Sela, L., Salomons, E., & Housh, M. (2019). Plugin prototyping for the EPANET software. Environmental Modelling & Software, 119, 49–56. https://doi.org/10.1016/j.envsoft.2019.05.010
- Stanmech. (2019). Bernoulli's principle. Retrieved from https://www.stanmech.com/articles/flow-velocity-and-pressure
- Swamee, P., & Sharma, A. (2000). Gravity flow water distribution system design. Aqua, 49, 169–179. https://doi.org/10.2166/aqua.2000.0015
- Wannapop, R., Jearsiripongkul, T., & Jiamjiroch, K. (2018). Elevation effect in urban water distribution model. In MATEC Web of Conferences, 153, 09001). https://doi.org/10.1051/matecconf/201815309001ICMME2017
- Wurbs, R. A., & James, W. P. (2002). Water resources engineering. Prentice Hall.