
 ?Mathematical formulae have been encoded as MathML and are displayed in this HTML version using MathJax in order to improve their display. Uncheck the box to turn MathJax off. This feature requires Javascript. Click on a formula to zoom.
ABSTRACT
This study proposes a multi-objective linear programming (MOLP) model for sustainable supply chain design to reduce procurement cost by particle swarm optimization (PSO) technique and durable correlation among buyers and vendors in today’s aggressive state. In this proposed model, a buyer selects one or more suppliers and orders the products in an appropriate quantity. This tentative study measures the fundamental standards of issues such as cost, delivery, and delay. The assessment of multicriteria decision making issues and computations of procurement cost, quantity of defective items, and delay days of delivery are accomplished, although the data used in this model have been taken from the validated model of fuzzy inference system. A pioneer automobile industrial data set has been used to validate the results, where MOLP costoptimization model by PSO has resulted in 3.11% cost reduction in total procurement cost.
1. Introduction
A standard supply chain (SC), consisting of one buyer and multiple vendors, is discussed in this paper. The buyer ought to pick one or more vendors and assign the order quantities to these vendors to meet the demand of one product by means of a predestined annual rate. In this type of SC, there is a sole manager who has records of each buyers and vendors.
A multi-objective linear programming (MOLP) model is developed to organize the structure of a single buyer and multiple vendors under an all-unit quantity discount strategy for the vendor, and the configuration of the SC is decided for a product with distinct sourcing alternatives and expenditure at every stage of the SC with no break-up in customer needs, using a programming formula to minimize the total SC cost (Graves & Willems, Citation2005; Kamali & Jolai, Citation2011; S. K. Kim et al., Citation2008). Jones et al. (Citation2001) focused on the impact of sourcing decisions, like “how much to order” and/or “how often to order”, on the performance (i.e., Gross Margin Return on Investment) of the supply chain and identified supplier quality; cost and on-time delivery as the three most important criteria in supplier selection and developed a practical methodology for rating them (Goyal, Citation1977; Muralidharan et al., Citation2006). The coordination of a single buyer and multiple vendors of the SC in an integrated inventory problem is discussed (Glock, Citation2011; T. Kim & Goyal, Citation2009).
Key contributions of the article are as follows:
The five suppliers A1, A2, A3, A4, and A5 of the automobile parts are prioritized using the proposed expert system, which is depicted in this study. Fuzzy inference system (FIS) analysis is used for the criteria of cost, quality, delivery, technical aptitude, financial condition, and general repute.
A case study of the main Indian vehicle enterprise has been considered to derive the MOLP model for whole procurement cost.
This paper proposes a multi-criteria decision-making (MCDM) vendor selection model that tries to optimize the ordinary overall performance of one-consumer and multi-supplier SC by way of minimizing the complete procurement fee of the machine, which includes a complete variety of faulty items and a complete variety of late delivered items.
2. Literature review
Azadeh et al. (Citation2012) proposed a particle swarm optimization (PSO) algorithm to determine the optimal inspection policy in serial multi-stage processes. Che (Citation2010), Che and Cui (Citation2011), and Sinha et al. (Citation2011) effectively applied PSO to solve SC planning problems. In the study by Maghrabiea et al. (Citation2019), a hybrid MCDM is projected, in which the unidentified criteria weights are estimated using a maximizing deviation method with the principles of grey systems theory. Bachlaus et al. (Citation2008) explained multi-echelon SC network using Taguchi and PSO. Chandra and Grabis’s (Citation2007) model seeks to optimize the global cost of the SC with mixed-integer program. Che et al. (Citation2012) used PSO for multi-echelon, reverse SC community design. Ghosh et al. (Citation2012) described Analytic Hierarchy Process (AHP), Simulated Annealing (SA) algorithm for leading automobile company in India has been considered to derive the multi objective optimization model. Yousefi et al. (Citation2019) acquired an equipped process, where a two-stage hybrid model is introduced to select environment-friendly suppliers, allocate order, and determine fee in an SC with regard to coordination among members. First, a built-in multi-objective mixed-integer nonlinear programming model is supplied to reduce fees and consider vendors simultaneously. Khalifehzadeh et al. (Citation2019) described a stochastic multi-goal model for maximizing total procurement of the items and minimizing complete shipping lead time.
In large-scale NLP inventory systems, Gharaei, Amjadian, Shavandi, and Amjadian (Citation2023) introduced an augmented Lagrangian method to concurrently minimize total inventory cost and maximize total dependability, while the requirements are satisfied. Cashback increases the retailer’s profit, and customer credit increases customer loyalty, but if cashback websites are used carelessly, they could potentially cause customers to lose trust (Taleizadeh et al., Citation2023). Generalized benders decomposition under separability approach is employed for optimizing the decision variables, including the number of shipments and shipment quantities (Gharaei, Karimi, et al., Citation2023), defined generalized benders decomposition (GBD) under separability approach is employed for optimizing the decision variables, including the number of shipments and shipment quantities. Gharaei, Amjadian, and Shavandi (Citation2023). express the design and optimization of an integrated four-level Supply Chain (SC), which contains a supplier, a producer, a wholesaler, and multiple retailers. Amjadian and Gharaei (Citation2022) suggested an integrated Closed-loop Supply Chain (CLSC) model as a hyper-scale MINLP model, and an outer approximation approach is offered for the integrated Economic Production Quantity (EPQ) model’s optimal lot-sizing (Gharaei, Shekarabi, et al., Citation2023).
3. Research gaps and problem definition
In order to operate an SC effectively, the supplier selection problem is a crucial topic. This is because developing strategic alliances with the supplier is urgently necessary. The right choice of suppliers has an impact on a number of factors, including the location of the supplier in relation to transportation and distribution, the cost of procurement, the project’s overall cost, and so on. This study makes an effort to offer a framework for the automobile industry’s supplier selection. Due to a number of crucial factors, the manufacturer must provide a strong structure. Consequently, the following questions were the focus of this research:
How to develop critical measures for supplier selection of an automotive industry?
How to weight the supplier selection measures considering their importance level?
How can qualitative factors be involved in the process of supplier selection?
How can the overall procurement cost be decreased so as to decrease the cost of project?
3.1. Model assumptions
The client can purchase the necessary volume from multiple suppliers.
The consumer will only purchase one item from each of the vendors.
The annual demand is acknowledged and consistent over time.
Inventory shortages for the vendor and the buyer are no longer permitted.
3.2. FIS analysis
The proposed expert system for prioritizing five suppliers A1, A2, A3, A4, and A5 of automobile parts is being illustrated. Criteria cost, quality, delivery, technical capability, financial position, and general reputation are using FIS analysis. The hierarchy of the model is as shown in Figure .
Figure 1. Typical hierarchy model of supplier selection (Rajak et al., Citation2016a)
The linguistic variables for criteria and their corresponding membership functions are followed, as shown in . We selected the centroid method, which returns the center of the area under the curve and satisfies the selection criteria. This is followed by rank ordering of the sustained suppliers. We selected a simple additive weighting (SAW) due to its simplicity, popularity among practitioners, and the best performance results it achieves compared to other methods (Rajak et al., Citation2016b).
Figure 2. (a) The input and output members. (b) Cost membership function. (c) Quality membership function. (d) Delivery time membership function.
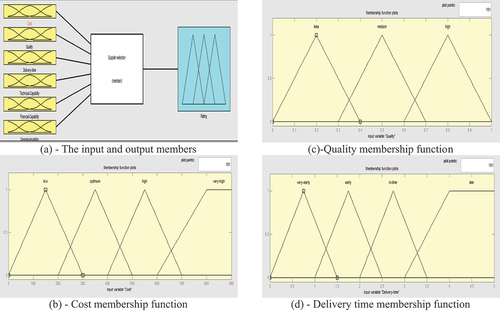
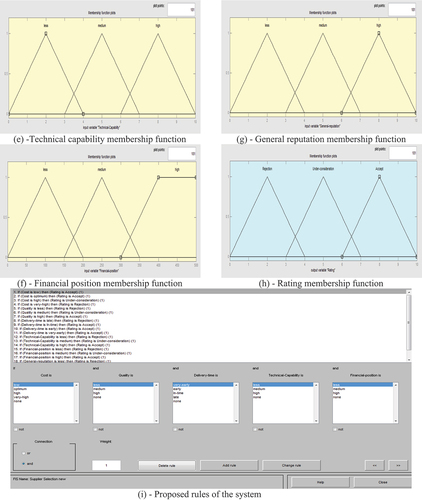
Figure 2. (e) Technical capability membership function. (f) Financial position membership function. (g) General reputation membership function. (h) Rating membership function. (i) Proposed rules of the system.
The SAW calculates the score for each supplier. The score
is then normalized by calculating the index
, which leads to a normalized ranking of alternatives. Finally, we select the best sustainable supplier with a maximum index value of
.
The cost has a triangular membership function and trapezoidal membership function, with a minimum cost of ₹5,000,000 and a maximum of ₹10,000,000 being considered by the experts. Linguistic triangular fuzzy number (less, medium, high) and financial position linguistic triangular and trapezoidal fuzzy number are considered for the quality, financial position, and general reputation. Linguistic triangular and trapezoidal fuzzy number with minimum 1 day and maximum 3 days is also considered for delivery.
The output of the system, which is the evaluation result, is a linguistic triangular fuzzy membership function for rejection, under consideration, and accept, as shown in . Regarding the experts and taking the criteria into considerations, the following rules are proposed, as shown in Fig. , and the ranking of the alternatives has been evaluated. To facilitate the computations, MATLAB package has been applied.
FIS is used to evaluate decision process since the criteria are both qualitative and quantitative for this case. According to these results, the criteria of cost and quality are determined as the most important criteria, and the criteria of delivery, technical capability, general reputation, and others in the industry are determined as the least important criteria. The rating points indicate the importance of the degree of alternatives, as shown in Figure .
Figure 3. (a) Rule viewer for Alternative A1. (b) Rule viewer for Alternative A3. (c) Rule viewer for Alternative A4. (d) Rule viewer for Alternative A2. (e) Rule viewer for Alternative A5.
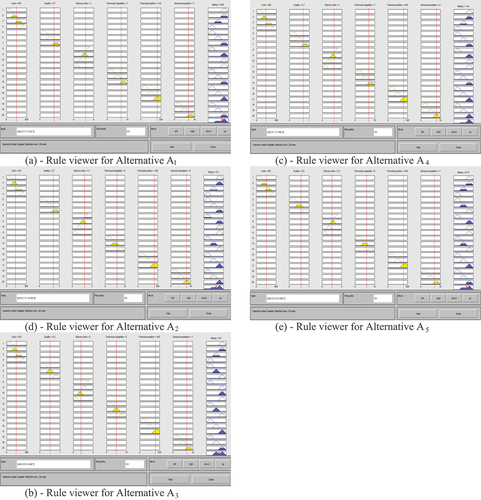
The linguistic fuzzy variables, i.e. criteria and rating, are defuzzified into a numeric value. The rank ordering of the suppliers is followed using the SAW method. As a result of each alternative, the scores are 6.95, 6.3, 6.5, 7.44, and 6.52, respectively. The scores are then normalized using EquationEquation 1
(1)
(1) and EquationEquation 2
(2)
(2) . Consequently, we obtained the rating points of suppliers in terms of a normalized index
such as 0.205, 0.186, 0.192, 0.219, and 0.198, respectively, as an output of FIS (Table ).
Table 1. Results of all four models in terms of ranking of alternatives
3.3. Mathematical model
Here, the leading vehicle enterprise in India has been considered to derive a multi-objective mathematical model (Ghosh et al., Citation2012). The firm has a certain requirement of a material in a certain period. If the raw material “i” is being provided by the vendor “k”, then the preliminary procurement cost is described as
The total substandard delivery is defined as
The total delay in delivery is defined as
Hence, the proposed multi-objective model aims to minimize the total cost function
is the unit cost of
material supplied by
supplier.
is the amount of material type
procured by
supplier.
is the percentage of faulty items of
material supplied by
supplier.
is the amount of material type
procured by
supplier.
is the delay percentage in delivery of
material supplied by
supplier.
is the amount of material type
procured by
supplier.
is the capacity of supplier
while supplying material
.
is the demand of material
to the firm in a certain period.
In the supplier selection of an automobile industry, the three basic objectives are simultaneously considered.
Minimize the total procurement cost.
Minimize the total number of faulty items supplied.
Minimize the total number of delay days in delivery in procuring various raw materials from various suppliers.
The quality function reveals the defective products that the vendors supplied (EquationEquation 4(4)
(4) ). The receiving company typically finds the defective items when moving the raw materials to the inventory. The company’s policy is to send any defective goods back to the vendors and request that they replace them within a set period of time, often 1 week. Due to the project’s predetermined timetable, the provision of subpar materials could result in a total cost of 1 week’s worth of delay time. As a result, the quality function in EquationEquation 4
(4)
(4) and the overall delivery delay in EquationEquation 5
(5)
(5) could be changed into a cost component for non-compliance.
3.4. Multi-objective PSO algorithm
The mathematical formulations of the PSO algorithm are as follows.
Let the position vector of the particle in a
-dimensional space be represented as
. Similarly, the velocity vector in a
-dimensional space is represented as
. The best previous position of the
particle is recorded and represented as
. The index of the best particle among all the particles in the group is represented by
. As demonstrated in the following equations, the updated position and the velocity of each particle from
to
may be calculated using the current velocity and the distance from the index of the best particle among all of the particles in the group is represented by gbestd. The updated position and velocity of the each particle can be evaluated using the current velocity and the distance from Pbest jd to gbest d to as shown in the following equations:
where,
: non-negative acceleration constants
: random number between 0 and 1
: inertia weight factor
According to prior experience, the non-negative acceleration constant is assumed to be 2 in this case. The addition of the inertia weight elements creates a balance between the particles’ capacity for local and global exploration. During a run inertia weight factor w, typically drops linearly from roughly 0.9 to 0.4 as originally established. Typically, the following equation is used to obtain the inertia weight:
where,
: maximum iteration count
wmax: 0.9
wmin: 0.4
The termination criterion for iterations has been determined according to whetherthe maximum generations or a predetermined value of fitness is reached has defined the iteration termination criterion. To find the best values for the design variables, the maximizing issue is changed in the current study into a minimization problem. The fitness function is often minimized using the PSO algorithm. Consequently, the function Z is modified as J as follows:
where,
: a positive integer valued 100
4. Test problem
4.1. Flow chart for the proposed methodology
The proposed method aims to minimize of total procurement cost using Particle Swarm Optimization. The optimized values of design variables have been obtained through the proposed flow chart shown in Figure .
Figure 4. Flow chart for the optimal value of design variable.
4.2. Designing of test problem
To avoid biases, the procurement department uses a mechanism that challenges the ranking of the top three vendors. Each supplier has a unique capacity for material supply. Each supplier supplies defective material in accordance with the determined percentage of defective products at their own rate, and the percentages of delivery delays are also shown for each provider in Table .
Table 2. Collected supplier’s details data from the firm
Due to the firm’s assignment timetable being somewhat rigid, delivery delays increase the project’s overall cost. The cost of the delay is estimated by the company’s specialists to be close to ₹3.5 lakhs each day. The costs incurred due to substandard supply are generally converted into delay cost as stated by the firm’s manager and calculated using the first component of EquationEquation 3(3)
(3) –EquationEquation 7
(7)
(7) .
The ranking order of five suppliers based on their SC coordination has been determined as A4 > A5 > A1> A3> A2. The supplier “A4” is the best sustainable supplier for this case study problem. Apart from this, three other basic objectives are also illustrated simultaneously (Rajak et al., Citation2016a). In the cost analysis of the top three suppliers, total procurement cost as ₹55,300,000, total number of faulty items as 22, and total number of delay days of delivery as 22 out of 1,250 orders have been computed.
5. Results and discussion
5.1. Computational results
The supply faulty material and late delivery of three preferences A4, A5, and A1 are measured as the design variables in the optimization problem. The results of the aforementioned study will help determine the best metrics for the design factors that are described further. In the cost analysis of the top three suppliers, total procurement cost as Rs. 5,53,00,000, total number of faulty items as 22 and total number of delay days of delivery as 22 out of 1250 orders has been computed as shown in Table .
Table 3. Cost analysis of the firm
As a result, the lower and upper bounds of these design variables can be created in order to organize the search space of the proposed task. The design variables’ lower and upper bounds are specified in Table . After the seventh iteration, the value of the objective function is being converted into a constant value, as shown in Table . reveals that 20 trials have been conducted to check the robustness of the proposed approach.
Table 4. Lower and upper limits of the proposed design variables
Table 5. Result of PSO algorithm
It is also revealed that the proposed approach of optimization is well suited for total procurement cost. The results have advantages over the previous work in terms of computation time and evaluation efficiency, as shown in Figures and Table .
Figure 5. Comparative optimal value in multiple trials.
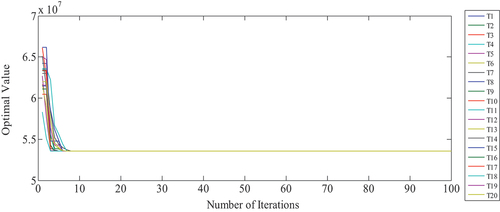
Figure 6. Conversion curve for objective function.
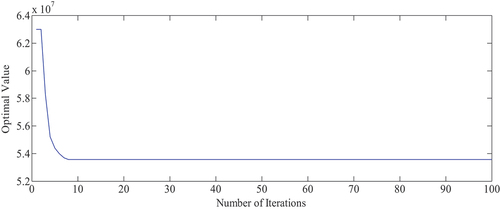
Table 6. Comparison of results
5.2. Managerial insights
Every company’s SC must include procurement optimization. One of the best tactics SC managers may employ to ensure a more successful and cost-effective SC is procurement optimization. The best procurement optimization techniques aid businesses in reducing expenses while reducing lead times and enhancing customer service. Here, a leading automobile company (TATA Motors) in India has been considered to derive the multi-objective mathematical model. This organization produces large-scale commercial, private, and military vehicles. This business needs a variety of raw materials, partially produced products, and finished vehicle parts such as axles, chassis, electrical cables, gearbox systems, speedometers, sensors, seats, and steering systems due to the high demand. Each raw material that the vendor provides will have particular restrictions and features, such as the percentage of delivered defective material, the percentage of delivery delays, and the cost per unit of the materials. Several benefits come with this optimizing procurement strategy, including:
Increases savings: Managers can better manage expenses by finding the most cost-effective vendors and products. Procurement optimization streamlines and automates processes to minimize overhead costs.
Streamline operations: This procurement optimization allows supply chain personnel to focus on more important tasks. It improves operational efficiency while decreasing delivery times.
Improves data integrity and visibility: With greater visibility into the SC process, managers can quickly identify issues that may arise and take corrective actions before they become significant problems. Additionally, this procurement optimization helps ensure data accuracy across systems by preventing data loss or duplication.
6. Conclusions and future scope
The evaluation of MCDM problems and computations of delay days of delivery, total number of defective items, and total procurement cost are accomplished, although the information used in this model has been taken from the validated model of FIS.
The obtained computational outcomes show that the PSO algorithm outperforms higher outcomes for the vendor selection problem. The enhanced answer produced by the suggested PSO approach is almost 3.11%. The primary factors of the issue, such as cost, delivery, and delay, are taken into account in this preliminary analysis. To make this more useful, however, numerous other problematic sub-criteria must also be taken into account.
6.1. Limitations and further research directions
Applying a FIS strategy to supplier selection models, different vendors are ranked according to standards for SC coordination. The vendor selection heuristic model can only be tested and validated by experience, and this depends on the decision-makers’ expertise. Scores for several categories were achieved through an expert interview. More experts can be interviewed to enhance the results. As a future project, we hope to integrate the suggested method into additional MCDM techniques such as fuzzy analytic network process, fuzzy artificial neural network, and evidential reasoning approach. Other issues such as machine selection, software selection, and staff selection can also be solved using the suggested methods.
The problem is formulated using a multi-objective mathematical model that reflects the essential sustainable criteria of this research. Furthermore, research should consider the following points:
To design an expert system to solve the prioritization problems using other fuzzy-based MCDM approaches.
Scores among the criteria were obtained in an interview with experts. In order to improve the results, more experts can be interviewed.
Validation of optimal solution using other optimization techniques.
PUBLIC INTEREST STATEMENT
In order to enhance the overall performance of supply chain, all members should closely collaborate with each other. Over the last few years, various buyer–vendor coordination models have been established. A multi-vendor coordinated model creates a significant reduction in the vendor’s cost, but the cost to the buyer significantly increases. Hence, some incentives are required to motivate the buyer to adopt the coordinated policy. A multi-objective procurement cost model is introduced in which joint optimization of cost, late delivery, and faulty quantity are used to develop coordination between late delivery and faulty items supplied by suppliers of supply chain and to enhance the overall performance of the system.
Abbreviation
| Abbreviation | = | Meanings |
| = | Initial procurement cost | |
| = | Total substandard delivery | |
| = | Total delay in delivery | |
| = | Non-compliance cost component | |
| = | Amount of material type | |
| = | Unit cost of | |
| = | Percentage of faulty items of | |
| = | Delay percentage in delivery of | |
| = | Capacity of supplier | |
| = | Demand of material | |
| = | Position vector of the | |
| = | Velocity vector of the | |
| = | Best previous position of the | |
| = | Best particle among all of the particles in the group | |
| = | Non-negative acceleration constants | |
| = | Random number between 0 and 1 | |
| = | Inertia weight factor | |
| = | Maximum inertia weight | |
| = | Minimum inertia weight | |
| = | Maximum iteration count | |
| = | Objective function | |
| = | Changed objective function | |
| = | A positive integer valued 100 | |
| = | Defuzzified value | |
| = | Normalized index | |
| = | Weighted criteria | |
| = | Score of the | |
| MOLP | = | Multi-objective linear programming |
| PSO | = | Particle swarm optimization |
| MCDM | = | Multi-criteria decision-making |
| MMM | = | Multi-objective mathematical model |
| SC | = | Supply chain |
| SAW | = | Simple additive weighting |
| FIS | = | Fuzzy inference system |
Disclosure statement
No potential conflict of interest was reported by the author(s).
Additional information
Notes on contributors

Anup Kumar Rajak
Anup Kumar Rajak is currently working as Adjunct Assistant Professor at IIIT Nagpur. Prior to his recent appointment, he was working as an Assistant Professor at REC Rewa from 2018 to 2021 and NIT Kurukshetra from 2016 to 2018. He received his MTech (CIDM) from NIT Jamshedpur in 2010 and PhD (supply chain management) in 2018 from the same institute. He has completed two CRS projects, sponsored by AICTE, India. He has published a number of papers in referred journals and book chapters. He has also presented various research papers in international and national conferences. His areas of interest include supply chain management, CAD/CAM, biogas analysis, and waste management.
References
- Amjadian, A., & Gharaei, A. (2022). An integrated reliable five-level closed-loop supply chain with multi-stage products under quality control and green policies: Generalised outer approximation with exact penalty. International Journal of Systems Science: Operations & Logistics, 9(3), 429–449. https://doi.org/10.1080/23302674.2021.1919336
- Azadeh, A., Sangari, M. S., & Amiri, A. S. (2012). A particle swarm algorithm for inspection optimization in serial multi-stage processes. Applied Mathematical Modelling, 36(4), 1455–1464. https://doi.org/10.1016/j.apm.2011.09.037
- Bachlaus, M., Pandey, M. K., Mahajan, C., Kumar, R., & Tiwari, M. K. (2008). Designing an integrated multi-echelon agile supply chain network: A hybrid Taguchi-particle swarm optimization approach. Journal of Intelligent Manufacturing, 19(6), 747–761. https://doi.org/10.1007/s10845-008-0125-1
- Chandra, C., & Grabis, J. (2007). “Supply chain configuration: Concepts, solutions and applications”. Springer.
- Che, Z. H. (2010). Using fuzzy analytic hierarchy process and particle swarm optimization for balanced and defective supply chain problems considering WEEE/RoHS directives. International Journal of Production Research, 48(11), 3355–3381. https://doi.org/10.1080/00207540802702080
- Che, Z. H., Chiang, T. A., & Kuo, Y. C. (2012). Multi-echelon reverse supply chain network design with specified returns using particle swarm optimization. International Journal of Innovative Computing, Information and Control, 8(10A), 6719–6731.
- Che, Z. H., & Cui, Z. (2011). Unbalanced supply chain design using the analytic network process and a hybrid heuristic-based algorithm with balance modulating mechanism. International Journal of Bio-Inspired Computation, 3(1), 56–66. https://doi.org/10.1504/IJBIC.2011.038703
- Gharaei, A., Amjadian, A., & Shavandi, A. (2023). An integrated reliable four-level supply chain with multi-stage products under shortage and stochastic constraints. International Journal of Systems Science: Operations & Logistics, 10(1), 1. https://doi.org/10.1080/23302674.2021.1958023
- Gharaei, A., Amjadian, A., Shavandi, A., & Amjadian, A. (2023). An augmented Lagrangian approach with general constraints to solve nonlinear models of the large-scale reliable inventory systems. Journal of Combinatorial Optimization, 45(2). https://doi.org/10.1007/s10878-023-01002-z
- Gharaei, A., Karimi, M., & Shekarabi, S. A. H. (2023). Vendor-managed inventory for joint replenishment planning in the integrated qualitative supply chains: Generalised benders decomposition under separability approach. International Journal of Systems Science: Operations & Logistics, 10(1), 1. https://doi.org/10.1080/23302674.2021.1962428
- Gharaei, A., Shekarabi, S. A. H., & Karimi, M. (2023). Optimal lot-sizing of an integrated EPQ model with partial backorders and re-workable products: An outer approximation. International Journal of Systems Science: Operations & Logistics, 10(1), 1. https://doi.org/10.1080/23302674.2021.2015007
- Ghosh, T., Chakraborty, T., & Dan, P. K. (2012). An effective AHP based metaheuristic approach to solve supplier selection problem. International Journal of Procurement Management, 5(2), 140–159. https://doi.org/10.1504/IJPM.2012.045647
- Glock, C. H. (2011). A multiple-vendor single-buyer integrated inventory model with a variable number of vendors. Computers & Industrial Engineering, 60(1), 173–182. https://doi.org/10.1016/j.cie.2010.11.001
- Goyal, S. K. (1977). An integrated inventory model for a single supplier–single customer problem. International Journal of Production Research, 15(1), 107–111. https://doi.org/10.1080/00207547708943107
- Graves, S. C., & Willems, S. P. (2005). Optimizing the supply chain configuration for new products. Management Science, 51(8), 1165–1180. https://doi.org/10.1287/mnsc.1050.0367
- Jones, G. K., Lanctot, A., Jr., & Teegen, H. J. (2001). Determinants and performance impacts of external technology acquisition. Journal of Business Venturing, 16(3), 255–283. https://doi.org/10.1016/S0883-9026(99)00048-8
- Kamali, A. F. G. S. M. T, & Jolai, F. (2011). A multi-objective quantity discount and joint optimization model for coordination of a single-buyer multi-vendor supply chain. Computers & Mathematics with Applications, 62(8), 3251–3269. https://doi.org/10.1016/j.camwa.2011.08.040
- Khalifehzadeh, S., Fakhrzad, M. B., Mehrjerdi, Y. Z., & Nasab, H. H. (2019). Two effective metaheuristic algorithms for solving a stochastic optimization model of a multi-echelon supply chain. Applied Soft Computing, 76, 545–563. https://doi.org/10.1016/j.asoc.2018.12.018
- Kim, T., & Goyal, S. K. (2009). A consolidated delivery policy of multiple suppliers for a single buyer. International Journal of Procurement Management, 2(3), 267–287. https://doi.org/10.1504/IJPM.2009.024811
- Kim, S. K., Yamada, T., & Kim, H. (2008). Search for alternatives and collaboration with incumbents: Two-sided sourcing behavior in business markets. Decision Sciences, 39(1), 85–114. https://doi.org/10.1111/j.1540-5915.2008.00183.x
- Maghrabiea, H. F., Beauregard, Y., & Schiffauerovaa, A. (2019). Multi-criteria decision making problems with unknown weight information under uncertain evaluations. Computers & Industrial Engineering, 133, 131–138. https://doi.org/10.1016/j.cie.2019.05.003
- Muralidharan, C., Anantharaman, N., & Deshmukh, S. G. (2006). A multi-criteria group decision making model for supplier rating. The Journal of Supply Chain Management, 38(4), 22–33. https://doi.org/10.1111/j.1745-493X.2002.tb00140.x
- Rajak, A. K., Niraj, M., & Kumar, S. (2016a). Designing of MCDM heuristic model based on MATLAB fuzzy approach for evaluating prioritization problems of the alternatives. Journal of Scientific & Industrial Research, 75(10), 604–608. http://nopr.niscair.res.in/handle/123456789/35562
- Rajak, A. K., Niraj, M., & Kumar, S. (2016b). Supplier selection heuristic model by integrating MATLAB with fuzzy AHP and fuzzy TOPSIS methods. Kasmera Journal, 44(1), 294–327.
- Sinha, A. K., Aditya, H. K., Tiwari, M. K., & Chan, F. T. S. (2011). Agent oriented petroleum supply chain coordination: Co-evolutionary particle swarm optimization based approach. Expert Systems with Applications, 38(5), 6132–6145. https://doi.org/10.1016/j.eswa.2010.11.004
- Taleizadeh, A. A., Varzi, A. M., Amjadian, A., Noori-Daryan, M., & Konstantaras, I. (2023). How cash-back strategy affect sale rate under refund and customers’ credit. Operational Research, 23(1). https://doi.org/10.1007/s12351-023-00752-2
- Yousefi, S., Jahangoshai Rezaee, M., & Solimanpur, M. (2019). Supplier selection and order allocation using two-stage hybrid supply chain model and game-based order price. Operational Research, 21(1), 553–588. https://doi.org/10.1007/s12351-019-00456-6