
 ?Mathematical formulae have been encoded as MathML and are displayed in this HTML version using MathJax in order to improve their display. Uncheck the box to turn MathJax off. This feature requires Javascript. Click on a formula to zoom.
ABSTRACT
There is a growing interest in using mathematical models to understand crime dynamics, crime prevention, and detection. The past decade has experienced a relative reduction in conventional crimes, but this has been replaced by significant increases in cybercrime. In this paper, we use deterministic modelling to describe the spread of cybercrime across a cyber-network by describing the heterogeneity of interactions between individuals using a nonlinear interaction between individuals in the network, and we allow criminals to operate either internally or externally to the cyber-network. We are able to determine the impact of the location of the criminal relative to the cyber-network which is being attacked. The model structure incorporates key elements of a social network structure thereby allowing for limited rates of victimisation. Both model structure and our observations are novel and provide a new contribution to the theoretical discussion of cybercrime dynamics, offering potential avenues to consider control strategies. Using steady-state analysis and extensive numerical simulations, we find that the location of criminals relative to the network does not impact the system qualitatively, although there are quantitative differences. Cyber-networks that are more clustered are likely to experience greater levels of cybercrime, but there is also a saturation effect that limits the level of victimisation as the number of criminals attempting to undertake crimes on given network increases. We discuss model limitations and describe how the model might be used with datasets to translate the theoretical findings into a useful tool in the fight to detect and eradicate cybercrime activity.
1. Introduction
Cybercrime, as categorised in Bossler and Berenblum (Citation2019), Furnell (Citation2002), and Sabillon et al. (Citation2016), is a global problem (Internet Society, Citation2015; Walker, Citation2019) which has the potential to disrupt the positive benefits of internet use such as access to information and social networking for the individual and economic and development opportunities for governments. Recognising this problem, the United Nations created a Global Programme on Cybercrime (United Nations Office on Drugs and Crime, Citation2013) to support countries to develop and deliver effective responses to cybercrime threats and activity; it has been in operation for almost a decade now. A study published in 2016 (Tcherni et al., Citation2016) analyzed cybercrime data from several sources, and its findings certainly support the case for a global response to cybercrime. It demonstrated that, in contrast to falling rates of traditional crime, cybercrime activity continues to increase. In Chuanying (Citation2018), the driving force behind cybercrime is identified as an economic benefit.
Although cybercrime is a global problem, regional differences in terms of cyber-attacks and cyber-threats are emerging. In particular, the African continent has been identified as vulnerable to high levels of criminal activity, partly driven by limited cyber-security capacity (Kshetri, Citation2013, Citation2019; Lebogang et al., Citation2022; Mwangi et al., Citation2022; Richard Mphatheni & Maluleke, Citation2022; Saeed & Osakwe, Citation2021). The impact of such cybercrime activity is felt far beyond the point of crime, with the potential to disrupt efforts to meet a wide range of UN Sustainability Goals 2030 (United Nations Department of Economic and Social Affairs, Citation2015). Whilst the definition of cybercrime (Furnell, Citation2002) as a crime committed with the assistance of a computer or computer technology is concise, the scope of activities that fall within this remit is not (Sabillon et al., Citation2016). In particular, a single cybercrime may operate at the individual, organisational, national, or global level.
We are interested in understanding the impact of different mechanisms on the scale of cybercrime that might be observed in a network of individuals. Consequently, we are interested in creating a deterministic mathematical model that simplifies the processes involved in cybercrime activity to basic levels to elucidate the mechanisms that drive cybercrime. The use of mechanistic (deterministic) models to explore crime dynamics in general is a growing field. It makes use of classic ecological structures (McMillon et al., Citation2014; Sayaji, Citation2013; Sooknanan et al., Citation2013) such as competition and predation (see, for example, Sooknanan et al., Citation2012, Citation2016) and epidemiological structures (Comissiong et al., Citation2012; Kumar Saini, Citation2011; Nguyen, Citation2017; Shankar Rao et al., Citation2017; Sooknanan et al., Citation2013a, Citation2013b). There have been attempts to integrate the dynamics of criminal activity with crime control such as policing effort (Bertozzi et al., Citation2016; Chikore et al., Citation2023; Coclite et al., Citation2017; Pitcher, Citation2010) and the impact of a range of heterogeneities (Banerjee et al., Citation2015; Brantingham et al., Citation2005; Jane White et al., Citation2021; Lacey & Tsardakas, Citation2016; Manasevich et al., Citation2013; Nathan & Jackob, Citation2019; Short et al., Citation2010, Citation2010, Citation2010; Wikstrom, Citation2019). Network theory (Jia et al., Citation2018; Omar et al., Citation2014), and graph theory (Pourhabibi et al., Citation2020) have also been used to explore problems in the field of crime dynamics.
Despite the growing interest in deterministic models to describe crime dynamics, mathematical models for cybercrime have been focussed more on other areas such as social network analysis, machine learning, and, most recently, AI.
Social network analysis has been employed to better understand criminal activity (Drury et al., Citation2022) and cybercrime (William Johnsen & Franke, Citation2020) in, for example, crime detection or prevention (Berlusconi, Citation2017; Burcher & Whelan, Citation2018; Johnson & David Reitzel, Citation2011); particular contexts such knife crime (Bailey et al., Citation2020; Mithoo & Kumar, Citation2023) and hacking patterns (Perkins et al., Citation2023); and in broader contexts such as spatial heterogeneity (Tita & Boessen, Citation2012) or exploration of general crime properties (Bright et al., Citation2022).
The availability of large volumes of data from social media sites gives room for data-driven cybercrime solutions to be formulated using machine learning techniques. So it is not surprising that machine learning models have been developed to explore detection of cyber criminals (Abdullah Al-Khater et al., Citation2020; Aschi et al., Citation2022; Bilen & Bedri Özer, Citation2021; Mahor et al., Citation2021; Mangilal Chayal & Patel, Citation2021) and to understand the impact of different prevention techniques (Arshey & Angel Viji, Citation2021; Uchenna Chinedu et al., Citation2021) including on the African continent (Goni & Mohammad, Citation2020).
The explosion of growth in AI availability means that AI provides both a mechanism to undertake cybercrime (see, for example, Folds, Citation2022; Parti et al., Citation2023) and to detect and/or prevent cybercrime (Dash et al., Citation2022; Mijwil et al., Citation2023; Mohammed Shamiulla, Citation2019).
Returning to the approach we take here, we will use a deterministic modelling structure to describe the spread of cybercrime across a cyber-network of individuals. This requires a significant simplification of the system to allow us to extract predictions from the model results. In particular, we describe the cyber-network in terms of a nonlinear interaction between individuals in the network, and we allow interaction with a criminal to result in victimisation. This is a novel application of a well-known heterogeneous infection process, and our results are linked directly to the nature and scale of that heterogeneity. Moreover, the structure that we employ additionally allows us to determine the impact of the location of the criminal relative to the cyber-network which is being attacked. The deterministic model structure incorporates key elements of a social network structure, allowing also for limited rates of victimisation. We are not aware of any similar such study and therefore this work represents a unique and novel contribution to the theoretical discussion of cybercrime dynamics and offers potential avenues to consider control strategies.
In Section 2, the model formulation is presented. In Section 3, we present the model analysis and results which focus on steady-state analysis, and lastly, in Section 4, a discussion on the work presented is given.
2. Model formulation
We consider a closed population of size N connected through an online network. At time t, this population comprises the following classes:
Number of individuals susceptible to vicitmisation at time
together with a fixed number of criminals C which may or may not be part of the closed population N.
We use the indicator variable
which allows us to write
Since N is constant, the model system, once derived, can be reduced to a 2-dimensional system. In this case, we choose to describe the dynamics of U(t) and
Figure shows the key features of the model. We simplify the hugely complex process of victimisation and describe it through two distinct mechanisms: an initial victimisation which infiltrates the cyber-network and an onward victimisation which uses the online network structure to facilitate criminal activity.
Figure 1. Flow diagram for the dynamics of cybercrime depicting how people transition between compartments as individuals experience cybercrime.
2.1. External victimisation process
The approach which we take here follows that of Holling (Holling, Citation1959; Liu et al., Citation2006; Tewa et al., Citation2012) to describe the predation rate as a function of prey density. For a single criminal, suppose that the number of individuals that are victimised from the sub-population U in time T is Qu, and the number of individuals from the sub-population V that are re-victimised is Qv. With this assumption, we see that the number of new victimisations per criminal per unit time is
Next assume that the amount of time it takes to secure a crime from each class is τu and τv, respectively (this is equivalent to a handling time in predator-prey dynamics). Therefore, the amount of time available to search for new victims either from class U or class V is reduced from T to
Assuming that both Qu and Qv are proportional to the time available to search for new victims and the number of individuals available to be victimised, we obtain the expressions
where κu and κv are positive constants of proportionality.
Solving this pair of equations simultaneously and using the relation given in (Equation1(1)
(1) ) we obtain the expression
2.2. Internal victimisation process
The scale-free nature of online social networks is well documented (Cui et al., Citation2012; Fronczak, Citation2018; Serafino et al., Citation2021) and suggests that the degree distribution of nodes within the network can be described using power law distributions (Artico et al., Citation2020; Clark et al., Citation1999; Zhou et al., Citation2020). We use this, together with previous modelling work describing heterogeneous contact rates for infectious diseases (Liu Citation1986 etc.) and epidemic spread on a social network (Lee & Zhu, Citation2021; Wang et al., Citation2021; Zhang et al., Citation2015) to describe the per capita victimisation rate
where νX, , α are positive constants and X corresponds to C, the number of criminals in the network or V the number of victims in the network. This assumes that victimisation can arise either due to interaction on the network between a susceptible individual and a criminal or due to onward transmission from a victim of crime to a susceptible individual. The parameter α is a measure of the heterogeneity in the network. A small α value corresponds to a more heterogeneous network with a small number of nodes with many connections and many nodes with very few connections. In particular,
has been shown to describe well the incidence of infection on a social network (Clarke et al., Citation2013) and so we choose this range for our study. The parameter ν corresponds to the likelihood of contact between criminal/victim and a susceptible individual resulting in new victimisation per unit time. It combines the probability that a connection between a criminal/victim node and a susceptible node results in victimisation with the likelihood that a criminal/victim node is linked to a susceptible node at any given time. This representation is well described in (Clarke et al., Citation2013).
Combining these terms with the flow from victim to immune and/or return to susceptible, we obtain the model system:
where all additional model parameters are also positive constants. The parameter δ−1 measures the average time that an individual remains a victim of cybercrime, p is the fraction of victims that become immune to cybercrime following victimisation and ω−1 is the average amount of time that an individual remains immune before returning to the susceptible class.
Using the relation we reduce (Equation4
(4)
(4) ) to give:
To non-dimensionalize the model system (Equation4(4)
(4) ), we set,
and choose dimensionless parameter groupings
We note that This parameter is clearly identifiable in the solution profiles presented in the next section.
Note also that the parameter σ1 incorporates the number of criminals seeking to find victims within a cyber-network of which they are not a member whilst the parameter c measures the proportion of the population within the cyber-network who are criminal. Since our analysis excludes the case in which both activities may be taking place at the same time, we are able to explore the effects of criminal population size and location (relative to the cyber-network) on levels of victimisation robustly without concern of double counting the effects.
Next, we set
which represents the per capita victimisation rate. Without loss of generality, we set and then the dimensionless model can be written:
To fully specify the model system we assign arbitrary initial conditions ,
where
3. Model analysis
We begin this section by demonstrating the existence of an invariant region for the model system (Equation7(7)
(7) ) and we discuss the properties of Γ, the per capita victimisation rate of susceptible individuals. The analysis which follows focuses on steady state behaviour. We demonstrate that the model will admit a single non-trivial steady state, and we explore the impact of parameter values on the size of this state. Following on from this, we demonstrate that, under a wide range of parameter conditions, the steady state is globally stable.
3.1. Preliminary considerations
3.1.1. Invariant region
The region is invariant for our model system. This is verified as follows:
On the boundary x = 0, by setting x = 0 in the relevant equation of (Equation7
On the boundary y = 0, by setting y = 0 in the relevant equation of (Equation7
For the boundary
Combining these three results gives us the invariant region as defined above.
3.1.2. Properties of
The per capita victimisation rate, is the cumulative rate of primary victimisation (from criminals either external or internal to the network) and onward victimisation through the network structure.
The partial derivatives and
provide insights which are highlighted later in the paper. They are given as:
When victimisation occurs external to the network (ψ = 0), Γ is a decreasing function of the susceptible population () whilst there is no dependence,
, when ψ = 1. The corresponding properties in relation to victimised individuals are more complex. With ψ = 1, Γ is an increasing function of the victimised population (
). However, with ψ = 0,
may be positive or negative depending on the relative strength of external versus within network victimisation. If the wasted effort of attempting to victimise individuals that are already victims has greater impact on the per capita victimisation rate than onward victimisation within the network, then
and the per capita rate decreases with increased numbers of victims; if this scenario is reversed, we find that
3.2. Steady-state solutions
At steady state, the rate equations given in (Equation7(7)
(7) ) are set to zero, resulting in the coupled, nonlinear algebraic equations:
and
solutions of which give the steady states for the system.
Rearranging these equations, we find that the steady state solutions of (Equation7(7)
(7) ) must simultaneously satisfy the two equations
where
and
Note that we require to ensure that
.
Considering we note that
Moreover, F1 is a quadratic function, and therefore it will at most have a single maximum turning point in the domain of interest.
The equivalent properties for are
The function F2 is composite, combining a quadratic with a monotonically increasing function and therefore, considering the values that F2 takes when y = 0 and
, the composite function will at most have a single maximum turning point in the domain of interest.
Given that and
(for
), and noting the behaviours described above, we conclude that
and
intersect once in the domain of interest
and therefore that the system attains a unique, admissible steady state
within the domain D. This is the case whether or not criminals operate internally or externally to the cyber-network.
3.3. Impact of parameters on steady-state levels
In exploring the impact of parameters on the amount of victimisation occurring within a cyber-network, we consider three key measures:
The degree of heterogeneity in the network (as measured by α);
The size of the criminal population;
The difference in connectedness of criminals and non-criminals within the network (for the case where ψ = 1).
Our findings are summarised in three figures.
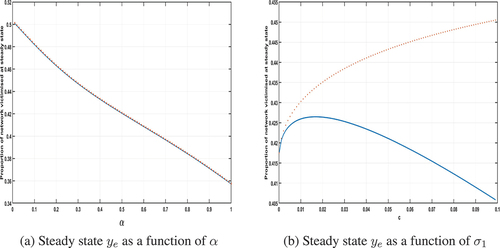
Firstly, Figure shows how the proportion of victims in the network at steady state (ye) changes with α and with σ1 (the dimensionless parameter which increases in direct proportion to the number of criminals external to the network).
Figure 2. Plots of the steady-state proportion of the network that is victimised when the criminals are external to the network, i.e. with ψ = 0. Model parameters used: ,
,
,
, p = 0.75. In (a)
, in (b) α = 0.5.
Recalling that increasing α corresponds to considering a less clustered (heterogeneous) network, we see that the more clustered the network, the greater the level of victimisation in the system. In this case, criminal activity is undertaken from outside the network environment and targets activity randomly across the entire network. Thus, when the network is highly clustered, a single successful contact within a cluster will have a greater impact than when the network is more evenly spread. We believe that this is a reasonable explanation for what we observe in Figure .
When we increase the number of criminals attempting to infiltrate a network (σ1 increasing) we see that the level of victimisation in the network increases but at a decreasing rate such that we observe a saturation effect, most likely linked to the connectivity of the network. What this means in practice is that, for a given network, there is a maximum victimisation level which is independent of the number of criminals, determined by the structure of the network.
Next, we consider the case where criminals form part of the cyber-network (ψ = 1) and again look at the impact of varying the network structure (varying α) and number of criminals (varying c). Because c forms part of the network population, we need to consider two measures of victimisation on the network. If we explore ye as a function of the parameters, we are showing the fraction of the total population which is victimised. This does not take into account that a fraction c of this population cannot be victimised because they are themselves criminal. Therefore, in Figure we also plot
Figure 3. Plots of the steady-state proportion of the network that is victimised when the criminals are internal to the network, i.e. with ψ = 1. The solid blue line is the value ye whilst the red crosses are given by which is the proportion of available population in the network that are victimised at steady state. Model parameters used:
,
,
,
, p = 0.75. In (a)
, in (b) α = 0.5.
which restricts the count to include only those individuals who are not themselves criminal within the network.
The behaviour of the system is qualitatively the same as for the case where criminal activity occurs external to the network as we change the degree of heterogeneity in the network through the parameter α. This is only true as we vary the number of criminals in the network if we calculate the fraction of available victims in the network to measure levels of victimisation. If we simply consider the value ye, we see that there is a peak in this value for some intermediate value This occurs because the heterogeneity of the network structure prevents onward victimisation because susceptible individuals are able to “hide” from the criminals. This contrasts with the case where the criminal acts externally to the network because there is no such mechanism to avoid contact with a criminal.
Finally, in Figure , we confirm the intuitively sensible observation that as the rate of interaction between criminals and susceptibles increases, so does the level of victimisation.
Figure 4. Plot of the proportion of available network members that are victimised at steady state as the rate of successful contact between susceptible and criminal individuals increases. Model parameters used: ,
,
,
, p = 0.75, α = 0.5 and c = 0.02.
3.4. Stability of steady states
The Jacobian matrix J for our model system (Equation7(7)
(7) ) is given as
where and
are the partial derivatives of
given in (Equation8
(8)
(8) ).
As was mentioned when discussing the properties of Γ, we see that (with equality arising for ψ = 1) whilst the sign for
may be positive or negative.
Using standard results, we note that the steady state is stable if and
.
After some algebraic rearrangements, we have
From (Equation13(13)
(13) ) we notice that sufficient conditions for the steady state to be locally stable are
The first of these conditions can be rewritten as:
Since , we confirm that the first inequality,
, is satisfied.
Rearranging the second inequality in a similar manner gives
From (Equation14(14)
(14) ), we observe that, provided
is sufficiently small, the inequality
will be satisfied. This is not the only criterion which could be invoked to ensure that the inequality is satisfied, but it provides a scenario which would ensure that the nontrivial steady state is stable.
The stability result described here was verified through extensive numerical exploration. Moreover, since the model system is bounded in the positive quadrant and there is a single locally stable steady state, then using the Poincare-Bendixson theorem we deduce that this steady state is globally stable and all solution trajectories will approach that state over time.
4. Discussion
In this paper, we have explored how the positioning of a criminal internal or external to a cyber-network influences the scale of cybercrime within that network. We did this using a simple deterministic representation of the network which assumed that each individual in the network is either susceptible to victimisation, is a victim, or is immune following a period of victimisation. Our analysis indicated that the greater the heterogeneity in the network structure, the more victimisation was likely to occur, independent of where the criminal was located relative to the network. We also observed a saturation effect relative to the size of the criminal population—the rate of increase in victimisation is a concave function of the criminal population size.
Of course, our model is a caricature of a highly complex system. However, it does demonstrate a “super-spreader” effect—networks with highly heterogeneous structure () produce more victims because once the “super-spreader” node has been successfully targeted, it will create a large number of onward victimisation opportunities. From a protection perspective, the advice here would be to create more egalitarian cyber-networks with a fixed number of nodes. The model also demonstrates that there is no significant difference between criminal activity being initiated externally to the network and that which is embedded within the network. Finally, the saturating nature of victimisation (Figures ) suggests that with some manipulation cyber-networks could be made more safe as measured by the level of saturating victimisation observed when large numbers of criminals are attacking a cyber-network. We were able to demonstrate the potential for damped oscillations in this system, although an extensive scour of parameter space did not yield a large effect. In any dynamical system, there is less certainty when oscillations are observed, which suggests that cyber-networks subject to victimisation may be “stabilised” by modifying some of the key demographic parameters. This will become particularly insightful once time-series data are available to help estimate some of these parameters.
Clearly, our model structure is a significantly simplified description of a real cyber-network and the mechanisms by which cyber-crimes are committed. As discussed in the introduction, this simplification is intentional because it allows us to identify how basic mechanisms affect levels of cybercrime. This is simply a starting point, but it does provide some avenues for future consideration. The importance of clustering in the network has been identified which contrasts with the location of the criminal within our external to the network which they are targeting. This second point, in particular, may be of interest to those trying to identify and disable cyber-criminals. Now that the model has been developed and its key properties identified, it would be useful to explore its predictions using data on cybercrimes to estimate model parameters. An ideal exploration would use data from different types of cybercrime to see if they produce significantly different parameter estimates; if they did, this would provide a mechanism to classify cybercrime activities and may provide useful groupings for future approaches to detection and prevention. In this way, we anticipate that our model could act as a catalyst for further exploration into the dynamics occurring in a cyber-network under attack by criminals. Given the scale of the global problem and the rate of growth in cyber-networks for work, pleasure, and commerce, it will be really important to understand the dynamics in order to implement robust and effective solutions to control the spiralling growth of cybercrime activity.
Acknowledgements
This work was undertaken within the UK-Africa Postgraduate Advanced Study Institute in Mathematical Sciences funded by UKRI Global Challenges Research Fund, grant number EP/T00410X/1.
Disclosure statement
No potential conflict of interest was reported by the author(s).
Supplementary material
Supplemental data for this article can be accessed online at https://doi.org/10.1080/27684830.2023.2295059.
Additional information
Funding
References
- Abdullah Al-Khater, W., Al-Maadeed, S., Ali Ahmed, A., Safaa Sadiq, A., & Khurram Khan, M. (2020). Comprehensive review of cybercrime detection techniques. Institute of Electrical and Electronics Engineers Access, 8, 137293–137311. https://doi.org/10.1109/ACCESS.2020.3011259
- Arshey, M., & Angel Viji, K. S. (2021). Thwarting cyber crime and phishing attacks with machine learning: A study. Proceedings of the 2021 7th International Conference on Advanced Computing and Communication Systems (ICACCS), Coimbatore, India, 1, 353–357. IEEE.
- Artico, I., Smolyarenko, I., Vinciotti, V., & Wit, E. C. (2020). How rare are power-law networks really? Proceedings of the Royal Society A: Mathematical, Physical and Engineering Sciences, 476(2241). https://doi.org/10.1098/rspa.2019.0742
- Aschi, M., Bonura, S., Masi, N., Messina, D., & Profeta, D. (2022). Cybersecurity and fraud detection in financial transactions. In D. Kyriazis & J. Soldatos (Eds.), Big data and artificial intelligence in digital finance: Increasing personalization and trust in digital finance using big data and AI (pp. 269–278). Springer.
- Bailey, L., Harinam, V., & Ariel, B. (2020). Victims, offenders and victim-offender overlaps of knife crime: A social network analysis approach using police records. PLoS One, 15(12), e0242621. https://doi.org/10.1371/journal.pone.0242621
- Banerjee, S., Van Hentenryck, P., & Cebrian, M. (2015). Competitive dynamics between criminals and law enforcement explains the super-linear scaling of crime in cities. Palgrave Communications, 1(15022), https://doi.org/10.1057/palcomms.2015.22
- Berlusconi, G. (2017). Social Network Analysis and Crime Prevention. In B. LeClerc & E. Savona (Eds.), Crime Prevention in the 21st Century (pp. 129–141). Springer. https://doi.org/10.1007/978-3-319-27793-6_10
- Bertozzi, A. L., Johnson, S. D., & Ward, M. J. (2016). Mathematical modelling of crime and security: Special issue of EJAM. European Journal of Applied Mathematics, 27(3), 311–316. https://doi.org/10.1017/S0956792516000176
- Bilen, A., & Bedri Özer, A. (2021). Cyber-attack method and perpetrator prediction using machine learning algorithms. PeerJ Computer Science, 7(e475), e475. https://doi.org/10.7717/peerj-cs.475
- Bossler, A. M., & Berenblum, T. (2019). Introduction: New directions in cybercrime research. Journal of Crime & Justice, 42(5), 495–499. https://doi.org/10.1080/0735648X.2019.1692426
- Brantingham, P. L., Glasser, U., Kinney, B., Singh, K., & Vajihollahi, M. (2005). A computational model for simulating spatial aspects of crime in urban environments. Proceedings of the 2005 IEEE International Conference on Systems, Man and Cybernetics, Waikoloa, Hawaii, USA (Vol. 4, pp. 3667–3674). IEEE.
- Bright, D., Brewer, R., & Morselli, C. (2022). Reprint of: Using social network analysis to study crime: Navigating the challenges of criminal justice records. Social Networks, 69, 235–250. https://doi.org/10.1016/j.socnet.2022.01.008
- Burcher, M., & Whelan, C. (2018). Social network analysis as a tool for criminal intelligence: Understanding its potential from the perspectives of intelligence analysts. Trends in Organized Crime, 21(3), 278–294. https://doi.org/10.1007/s12117-017-9313-8
- Chikore, T., Nyabadza, F., & Jane White, K. A. (2023). Exploring the impact of nonlinearities in police recruitment and criminal capture rates: A population dynamics approach. Mathematics, 11(7), 1669. https://doi.org/10.3390/math11071669
- Chuanying, L. (2018). Understanding cybercrime from the perspective of cybersecurity. Retrieved December 27, 2021.
- Clark, R. M., Cox, S. J. D., & Laslett, G. M. (1999). Generalizations of power-law distributions applicable to sampled fault-trace lengths: Model choice, parameter estimation and caveats. Geophysical Journal International, 136(2), 357–372. https://doi.org/10.1046/j.1365-246X.1999.00728.x
- Clarke, J., White, K. A. J., & Turner, K. (2013). Approximating optimal controls for networks when there are combinations of population-level and targeted measures available: Chlamydia infection as a case-study. Bulletin of Mathematical Biology, 2013(75), 1747–1777. https://doi.org/10.1007/s11538-013-9867-9
- Coclite, M., Garavello, G. M. A., & Spinolo, L. V. (2017). A mathematical model for piracy control through police response. Nonlinear Differential Equations and Applications NoDea, 24(4), https://doi.org/10.1007/s00030-017-0471-9
- Comissiong, D. M. G., Sooknanan, J., & Bhatt, B. (2012). Life and death in a gang-a mathematical model of gang membership. Journal of Mathematics Research, 4(4), 10–28. https://doi.org/10.5539/jmr.v4n4p10
- Cui, A.-X., Zhang, Z.-K., Tang, M., Ming Hui, P., Fu, Y., & Hayasaka, S. (2012, 12). Emergence of scale-free close-knit friendship structure in online social networks. PLOS ONE, 7(12), 1–13. https://doi.org/10.1371/journal.pone.0050702
- Dash, B., Farheen Ansari, M., Sharma, P., & Ali, A. (2022). Threats and opportunities with ai-based cyber security intrusion detection: A review. International Journal of Software Engineering & Applications (IJSEA), 13(5), 13–21. https://doi.org/10.5121/ijsea.2022.13502
- Drury, B., Drury, S. M., Arafatur Rahman, M., & Ullah, I. (2022). A social network of crime: A review of the use of social networks for crime and the detection of crime. Online Social Networks and Media, 30(100211), 100211. https://doi.org/10.1016/j.osnem.2022.100211
- Folds, C. L. (2022). How Hackers and Malicious Actors are Using Artificial Intelligence to Commit Cybercrimes in the Banking Industry [ PhD thesis]. Colorado Technical University.
- Fronczak, P. (2018). Scale-free nature of social networks. Springer New York.
- Furnell, S. (2002). Cyber crime: Vandalizing the information society. Addison Wesley.
- Goni, I., & Mohammad, M. (2020). Machine learning approach to mobile forensics framework for cyber crime detection in Nigeria. Journal of Computer Science Research, 2(4), 1–6. https://doi.org/10.30564/jcsr.v2i4.2147
- Holling, C. S. (1959). Some characteristics of simple types of predation and parasitism. Canadian Entomologist, 9(7), 385–398. https://doi.org/10.4039/Ent91385-7
- Internet Society. (2015). Global internet report 2015: Mobile evolution and development of the internet. Retrieved March 7, 2022.
- Jane White, K. A., Campillo-Funollet, E., Nyabadza, F., Cusseddu, D., Kasumo, C., Imbusi, N. M., Juma, V. O., Meir, A. J., & Marijani, T. (2021). Towards understanding crime dynamics in a heterogeneous environment: A mathematical approach. Journal of Interdisciplinary Mathematics, 24(8), 2139–2159. https://doi.org/10.1080/09720502.2020.1860292
- Jia, P., Liu, J., Fang, Y., Liu, L., & Liu, L. (2018). Modeling and analyzing malware propagation in social networks with heterogeneous infection rates. Physica A: Statistical Mechanics and Its Applications, 507, 240–254. https://doi.org/10.1016/j.physa.2018.05.047
- Johnson, J. A., & David Reitzel, J. (2011). Social network analysis in an operational environment: Defining the utility of a network approach for crime analysis using the Richmond City Police Department as a case study. In International Police Executive Symposium.
- Kshetri, N. (2013). Cybercrime and cybersecurity in the global south. Springer.
- Kshetri, N. (2019). Cybercrime and cybersecurity in Africa. Journal of Global Information Technology Management, 22(2), 77–81. https://doi.org/10.1080/1097198X.2019.1603527
- Kumar Saini, D. (2011). A mathematical model for the effect of malicious object on computer network immune system. Elsevier: Applied Mathematical Modelling, 35(8), 3777–3787. https://doi.org/10.1016/j.apm.2011.02.025
- Lacey, A. A., & Tsardakas, M. N. (2016). A mathematical model of serious and minor criminal activity. European Journal of Applied Mathematics, 27(3), 403–421. https://doi.org/10.1017/S0956792516000139
- Lebogang, V., Tabona, O., & Maupong, T. (2022). Evaluating cybersecurity strategies in Africa. In M. Dawson, O. Tabona, & T. Maupong (Eds.), Cybersecurity capabilities in developing nations and its impact on global security (pp. 1–19). IGI Global.
- Lee, D.-S., & Zhu, M. (2021). Epidemic spreading in a social network with facial masks wearing individuals. IEEE Transactions on Computational Social Systems, 8(6), 1393–1406. https://doi.org/10.1109/TCSS.2021.3081148
- Liu, B., Teng, Z., & Chen, L. (2006). Analysis of a predator–prey model with Holling II functional response concerning impulsive control strategy. Journal of Computational and Applied Mathematics, 193(1), 347–362. https://doi.org/10.1016/j.cam.2005.06.023
- Mahor, V., Rawat, R., Telang, S., Garg, B., Mukhopadhyay, D., & Palimkar, P. (2021). Machine learning based detection of cyber crime hub analysis using twitter data. Proceedings of the 2021 IEEE 4th International Conference on Computing, Power and Communication Technologies (GUCON), Kuala Lumpur, Malaysia (pp. 1–5). IEEE.
- Manasevich, R., Hung Phan, Q., & Souplet, P. (2013). Global existence of solutions for a chemotaxis-type system arising in crime modelling. European Journal of Applied Mathematics, 24(2), 273–296. https://doi.org/10.1017/S095679251200040X
- Mangilal Chayal, N., & Patel, N. P. (2021). Review of machine learning and data mining methods to predict different cyberattacks. Data Science and Intelligent Applications: Proceedings of ICDSIA 2020, GIT, Gujarat, India (pp. 43–51).
- McMillon, D., Simon, C. P., Morenoff, J., & Perc, M. (2014). Modeling the underlying dynamics of the spread of crime. PLoS ONE, 9(4), 1–22. https://doi.org/10.1371/journal.pone.0088923
- Mijwil, M., & Aljanabi, M. (2023). Towards artificial intelligence-based cybersecurity: The practices and ChatGPT generated ways to combat cybercrime. Iraqi Journal for Computer Science and Mathematics, 4(1), 65–70.
- Mithoo, P., & Kumar, M. (2023). Social network analysis for crime rate detection using spizella swarm optimization based bilstm classifier. Knowledge-Based Systems, 269(110450), 110450. https://doi.org/10.1016/j.knosys.2023.110450
- Mohammed Shamiulla, A. (2019). Role of artificial intelligence in cyber security. International Journal of Innovative Technology and Exploring Engineering, 9(1), 4628–4630. https://doi.org/10.35940/ijitee.A6115.119119
- Mwangi, T., Asava, T., & Akerele, I. (2022). Cybersecurity threats in Africa. In D. Kuwali (Ed.), The Palgrave handbook of sustainable peace and security in Africa (pp. 159–180). Springer.
- Nathan, O. M., & Jackob, K. O. (2019). Stability analysis in a mathematical model of corruption in Kenya. Asian Research Journal of Mathematics, 15(4), 1–15. https://doi.org/10.9734/arjom/2019/v15i430164
- Nguyen, B. (2017). Modelling cyber vulnerability using epidemic models. Proceedings of the 7th International Conference on Simulation and Modeling Methodologies, Technologies and Applications (SIMULTECH 2017), Madrid, Spain (pp. 232–239).
- Omar, N., Bin Mohamed, I., Mohd Sanusi, Z., & Yogi Prabowo, H. (2014). Understanding social network analysis (SNA) in fraud detection. Proceedings of the International Congress on Interdisciplinary Behaviour and Social Sciences, Bali, Indonesia (pp. 543–548).
- Parti, K., Dearden, T. E., & Choi, S. (2023). Understanding the use of artificial intelligence in cybercrime. International Journal of Cybersecurity Intelligence & Cybercrime, 6(2). https://doi.org/10.52306/2578-3289.1170
- Perkins, R. C., Ouellet, M., Howell, C. J., & Maimon, D. (2023). The illicit ecosystem of hacking: A longitudinal network analysis of website defacement groups. Social Science Computer Review, 41(2), 390–409. https://doi.org/10.1177/08944393221097881
- Pitcher, A. B. (2010). Adding police to a mathematical model of burglary. European Journal of Applied Mathematics, 21(4–5), 401–419. https://doi.org/10.1017/S0956792510000112
- Pourhabibi, T., Ong, K.-L., Kam, B. H., & Ling Boo, Y. (2020). Fraud detection: A systematic literature review of graph-based anomaly detection approaches. Decision Support Systems, 133(113303), 113303. https://doi.org/10.1016/j.dss.2020.113303
- Richard Mphatheni, M., & Maluleke, W. (2022). Cybersecurity as a response to combating cybercrime: Demystifying the prevailing threats and offering recommendations to the African regions. International Journal of Research in Business and Social Science, 11(4), 384–396. https://doi.org/10.20525/ijrbs.v11i4.1714
- Sabillon, R., Cano, J., Cavaller, V., & Serra, J. (2016). Cybercrime and cybercriminals: A comprehensive study. International Journal of Computer Networks and Communications Security, 4(6), 165–176.
- Saeed, M., & Osakwe, S. (2021). Are African countries doing enough to ensure cybersecurity and internet safety?
- Sayaji, R. W. (2013). Mathematical modelling: A study of corruption in the society. International Journal of Scientific & Engineering Research, 4(7), 2303–2318.
- Serafino, M., Cimini, G., Maritan, A., Rinaldo, A., Suweis, S., Banavar, J. R., & Caldarelli, G. (2021). True scale-free networks hidden by finite size effects. Proceedings of the National Academy of Sciences, 118(2), 2021. https://doi.org/10.1073/pnas.2013825118
- Shankar Rao, Y., Kumar Rauta, A., Saini, H., & Charana Panda, T. (2017). Mathematical model for cyber attack in computer network. International Journal of Business Data Communications and Networking (IJBDCN), 13(1), 58–65. https://doi.org/10.4018/IJBDCN.2017010105
- Short, M. B., Bertozzi, A. L., & Jeffrey Brantingham, P. (2010). Nonlinear patterns in urban crime: Hotspots, bifurcations, and suppression. SIAM Journal on Applied Dynamical Systems, 9(2), 462–483. https://doi.org/10.1137/090759069
- Short, M. B., Brantingham, P. J., Bertozzi, A. L., & Tita, G. E. (2010). Dissipation and displacement of hotspots in reaction-diffusion models of crime. Proceedings of the National Academy of Sciences of the United States of America, 107(9), 3961–3965. https://doi.org/10.1073/pnas.0910921107
- Short, M. B., Jeffrey Brantingham, P., Bertozzi, A. L., & Tita, G. E. (2010). Dissipation and displacement of hotspots in reaction-diffusion models of crime. Proceedings of the National Academy of Sciences, 107(9), 3961–3965. https://doi.org/10.1073/pnas.0910921107
- Sooknanan, J., Bhatt, B., & Comissiong, D. M. (2013). Another way of thinking: A review of mathematical models of crime. Math Today, 131, 131–133.
- Sooknanan, J., Bhatt, B., & Comissiong, D. M. G. (2012). Criminals treated as predators to be harvested: A two prey one predator model with group defense, prey migration and switching. Journal of Mathematics Research, 4(4), https://doi.org/10.5539/jmr.v4n4p92
- Sooknanan, J., Bhatt, B., & Comissiong, D. M. G. (2013a). Catching a gang - a mathematical model of the spread of gangs in a population treated as an infectious disease. International Journal of Pure and Applied Mathematics, 83(1), 25–43. https://doi.org/10.12732/ijpam.v83i1.4
- Sooknanan, J., Bhatt, B., & Comissiong, D. M. G. (2013b). CATCHING A GANG -- A MATHEMATICAL MODEL OF THE SPREAD OF GANGS IN A POPULATION TREATED AS AN INFECTIOUS DISEASE. International Journal of Pure and Applied Mathematics, 83(1), 25–43. https://doi.org/10.12732/ijpam.v83i1.4
- Sooknanan, J., Bhatt, B., & Comissiong, D. M. G. (2016). A modified predator–prey model for the interaction of police and gangs. Royal Society Open Science, 3(9), 160083. https://doi.org/10.1098/rsos.160083
- Tcherni, M., Davies, A., Lopes, G., & Lizotte, A. (2016). The dark figure of online property crime: Is cyberspace hiding a crime wave? Justice Quarterly, 33(5), 890–911. https://doi.org/10.1080/07418825.2014.994658
- Tewa, J. J., Djeumen, V. Y., & Bowong, S. (2012). Predator–prey model with Holling response function of type II and SIS infectious disease. Applied Mathematical Modelling, 37(7), 4825–4841. https://doi.org/10.1016/j.apm.2012.10.003
- Tita, G. E., & Boessen, A. (2012). Social networks and the ecology of crime: Using social network data to understand the spatial distribution of crime. In D. Gadd, S. Karstedt, & S. F. Messner (Eds.), The SAGE handbook of criminological research methods (pp. 128–142). Sage.
- Uchenna Chinedu, P., Nwankwo, W., Masajuwa, F. U., & Imoisi, S. (2021). Cybercrime detection and prevention efforts in the last decade: An overview of the possibilities of machine learning models. Review of International Geographical Education Online, 11(7).
- United Nations Department of Economic and Social Affairs. (2015). United nations sustainable development goals. Retrieved August 17, 2022.
- United Nations Office on Drugs and Crime. (2013) . Global study on homicide 2013: Trends, contexts, data. UNODC.
- Walker, S. (2019). Cyber-insecurities? A guide to the UN cybercrime debate.
- Wang, X., An, Q., He, Z., & Fang, W. (2021). A literature review of social network analysis in epidemic prevention and control. Complexity, 2021, 1–20. https://doi.org/10.1155/2021/3816221
- Wikstrom, P. H. (2019). Situational action theory: A general, dynamic and mechanism-based theory of crime and its causes. Springer International Publishing.
- William Johnsen, J., & Franke, K. (2020). Identifying proficient cybercriminals through text and network analysis. Proceedings of the 2020 IEEE International Conference on Intelligence and Security Informatics (ISI), Arlington, VA, USA (pp. 1–7). IEEE.
- Zhang, Z., Wang, H., Wang, C., & Fang, H. (2015). Modeling epidemics spreading on social contact networks. IEEE Transactions on Emerging Topics in Computing, 3(3), 410–419. https://doi.org/10.1109/TETC.2015.2398353
- Zhou, B., Meng, X., & Eugene Stanley, H. (2020). Power-law distribution of degree–degree distance: A better representation of the scale-free property of complex networks. Proceedings of the National Academy of Sciences, 117(26), 14812–14818. https://doi.org/10.1073/pnas.1918901117