
ABSTRACT
Surveys are common research methods in agricultural research for development. Despite the multitude of well-documented warnings for pitfalls in survey research, it appears challenging to avoid these in practice. We use a case study in agricultural research for development to illustrate what complicates survey research within an interdisciplinary, multiorganizational and multinational team. The survey research process, rather than the survey outcome, is our object of study. Using the Methodology of Interdisciplinary Research (MIR) framework we identify different steps within survey research. We overlay a technographic lens to understand “the making of a survey”. We thereby focus on the transformations made from beginning to end in survey research, the different task-groups involved, and on the norms and rules that guide this process. This illustrates the practice of survey research in diverse and multiform research teams, and shows which vital methodological steps are often ignored, skipped, or overruled. Our findings reveal that the intrinsic complexity of effective survey research is disproportionally exacerbated by the complexity of a diverse and multiform research team. We recommend allocating more resources and attention to capacity strengthening, harmonization, operationalization, capitalizing on different strengths, integration and communication.
1. Introduction
A camel is a horse designed by a committee
The survey is a commonly used tool in agricultural research for development to generate insights about rural farming communities, to study farmers’ adoption of innovations, and to measure the effectiveness of interventions (Fraval et al., Citation2019; Gorman et al., Citation2021; Mowles, Citation2013; Ruzzante et al., Citation2021). Survey results are typically expressed in metrics that are appealing to donors, policy makers, financial managers and other decision makers. These metrics often are taken as the results of investments in development (Kandiyoti, Citation1999; Nyanga, Citation2012). Agricultural research for development increasingly involves interdisciplinary, multiorganizational, and multinational teams. Such teams have several advantages to fully grasp complex human-environment interactions, like the adoption of agricultural innovations (Clarke & Fuller, Citation2010; Thompson & Scoones, Citation2009; Tobi & Kampen, Citation2018).
Against the undeniable advantages of interdisciplinary, multiorganizational and multinational research teams is the great disadvantage that survey research involves many more decisions than most researchers realize (Dasborough and (Citation2010) Book Review of ‘Saris’ (2010) (Hair-Jr et al., Citation2006; Saris & Gallhofer, Citation2007). Each of these decisions provides an opportunity for error. Warnings against the numerous problems and pitfalls concerning survey research are repeated across a broad area of applications ranging from construction industry to neuropsychology and from lactation to recreation (Ball, Citation2019; Guterbock & Marcopulos, Citation2020; Hipp et al., Citation2020; Kelley et al., Citation2003; Magnuson et al., Citation2020; McInroy, Citation2016; Moy & Murphy, Citation2016; Oll et al., Citation2018; Schreyer, Citation1980; Torchiano et al., Citation2017). All these warnings point to the simple fact that the difficulty of survey research is systematically underestimated. Though pitfalls and possible solutions are well documented, researchers keep stumbling into them.
The authors of this paper have all served as members of interdisciplinary, multiorganizational and multinational research teams. Each with a different disciplinary background including agronomy, ecology, psychology, gender studies, and sociology. During these collaborations, the authors experienced first-hand that despite the opportunities and promises of such research teams, challenges often arise that adversely affect results.
The idea for this paper emerged following a collaboration on a household survey in the field of agricultural research for development that collected a lot of data, but yielded very little useable data. We decided to engage in a collective reflection to understand why survey research is so challenging, using our collaboration on this particular household survey as a case-study. To guide and support our analysis, we combine the Methodology of Interdisciplinary Research (MIR) framework with Technography (Richards, Citation2001; Tobi & Kampen, Citation2018). Thus, the survey is our object of study and we describe “the making of a survey”. We emphasize the importance of each individual step in survey research and the complexity entailed when these steps are completed and passed between members in a research team. We focus on these steps, because passing tasks within survey research often includes transformation and translation between the epistemological positions, academic jargon, and spoken language of team members.
In the discussion, we focus on three specific pitfalls identified in our interdisciplinary, multiorganizational, multinational case-study: 1) the absence of a clear common objective and purpose, 2) the challenge of transforming research concepts into variables, and 3) the rules and norms that guided the survey research. We conclude with recommendations based upon our findings.
2. Conceptual framework
2.1. Assumptions of survey research
A survey instrument, or questionnaire, is any series of pre-defined questions intended to collect standardised information from people. As a data collection tool, the survey instrument works within a larger survey methodology that includes other aspects such as a sampling design and analysis. Selected samples should be representative for a larger target population. During data analysis, collected survey data, as variables, are correlated with one another. For example, linking a proxy for adoption of an agricultural innovation (forming the dependent variable) to demographic data (forming independent variables or predictors). When applied to an appropriate research question and developed with rigour, surveys are expected to provide generalizable insights into human phenomena such as emotions and opinions (A. Phillips, Citation2017).
The basic assumptions of survey research are that the phenomenon or concepts under investigation are 1) clearly defined; 2) measurable via survey questions, 3) familiar and 4) relevant to respondents, who 5) understand them in a uniform way, that is 6) similar to the understanding of the researchers. Furthermore, respondents are 7) willing to answer the survey questions and 8) to answer them honestly, and therefore 9) their answers correspond to actual behaviour and situations. Finally, when 10) statistical tests have sufficient power to detect significant differences with the selected analysis, and 11) the sample is representative for a larger population, then the results are 12) generalizable beyond the selected participants (Malhotra, Citation2002; Williams, Citation1959).
The error dimensions or pitfalls inherent to the survey process are well documented (Biemer & Lyberg, Citation2003). These dimensions include specification error that can result when the wrong survey question is used to measure the concept of interest. Frame error occurs when a biased or incomplete set of respondents is sampled. Nonresponse error occurs when selected respondents do not respond to the survey or to certain items in the survey. Processing errors can occur when there are problems with the editing, entry, or coding of data. A measurement error is introduced when the survey interviewer or respondent does not interpret, administer, or react to the questions in the survey as intended in the design. There might be considerable variance in the degree to which respondents comprehend, retrieve, judge, and respond accurately resulting in further cognitive bias or a “response effect”.
Surveys can be implemented in various ways such as face-to-face, via telephone or online, creating a social relation between the interviewer and the respondent (Moy & Murphy, Citation2016). Regardless of the mode of implementation, surveys are always administered in the name of someone or some organisation with whom respondents might have different relations, attitudes, and experiences (Schwarz, Citation2007). Therefore, survey responses reflect the relationship between the respondent and the interviewer, and/or the organization that the interviewer represents. This relation can introduce experimenter bias and social desirability bias (Moy & Murphy, Citation2016; Schwarz, Citation2007).
2.2. Relating survey assumptions to opportunities and challenges
There are several opportunities for interdisciplinary, multiorganizational and multinational research teams to meet the assumptions that underly survey research. For example, interdisciplinary teams can offer mutual support in mixed-method research. The use of qualitative studies prior to survey design can identify meaningful concepts in the specific research context. After survey data is collected, they can help to validate whether the responses align with actual behaviour and provide nuance to understanding observed correlations (Shaffer, Citation2013). Despite these potential opportunities, interdisciplinary research teams face several challenges. For example, there is often a difference between paradigms or epistemologies that might result in team members holding contrasting perspectives (Fischer et al., Citation2011; Shaffer, Citation2013). Such contrasts can make it difficult to delineate a clear study purpose, and to integrate different types of data collected with different methods (Kanbur & Shaffer, Citation2007). Epistemological differences can complicate the selection, interpretation, and measurement of relevant concepts and their operationalization (Bonis, Citation2013; Campbell, Citation2005; Ludwig et al., Citation2022; National Research Council, Citation1984).
Multiorganizational collaborations have advantages as they bring together complementary services and use resources more efficiently (Lowndes & Skelcher, Citation1998). For example, partners from local institutions might provide access to local communities, making respondents comfortable enough to provide more accurate, honest answers (although the reverse is possible as well) (Liamputtong, Citation2010). Collaboration with academics can provide state-of-the-art knowledge to improve survey design and link results in ongoing scientific debates. However, the multiorganizational nature of a research team presents challenges, for example, due to different styles of coordinating this collaboration (Lowndes & Skelcher, Citation1998). Often differences in terminology, language, data models, values, and politics, complicate the ability of team members to build a shared understanding of research objectives and to align different interests and expectations (Gillett et al., Citation2016). Such factors might affect intra-team communication and contribute to poor decision making and poor results (Thiebes et al., Citation2023).
International research teams can join forces to tackle common problems, regardless of where they are geographically based (Wagner, Citation2008). National partners are likely to have a more nuanced understanding of the local context. This can assist in vernacular language choices for question design, and to ensure respondents are familiar with concepts and understand them as researchers intend. Furthermore, national partners might possess valuable insights for meaningful sampling, stratification, and language choice for tool design. International partners can provide access to specific (scientific) knowledge and technologies (Freshwater et al., Citation2006; Kim, Citation2006). Within multinational teams, ethnicity, gender, colonial history, control over project funding, scientific track record and religion, as well as the ability to speak the common project language, are examples of markers of identities that often influence how team members perceive and make assumptions about one another. Linguistic differences between the participants and researchers might require translation during which some meaning is lost (Liamputtong, Citation2010; Peña, Citation2007). There might be incomplete overlap of definitions of the measured constructs across cultures and a lack of comparability of those constructs (Van de Vijver & Leung, Citation2021). Finally, there might be cultural differences in what is considered socially desirable behaviour and appropriate phrasing of questions (Harkness et al., Citation2010).
These points above are a few illustrative examples that emphasize the complexity of inter-personal interaction within an interdisciplinary, multiorganizational and multinational research team. Paradoxically, it appears that where there is most opportunity for diverse and multiform teams in theory, is exactly where in practice they encounter the most challenges. Donors funding such research teams cannot assume that researchers naturally know how to collaborate with one another, and work through disciplinary disagreements and the institutional and global hierarchies that could lead to discomfort (Freeth & Caniglia, Citation2020; Lyall et al., Citation2011). What is clear from the literature and from our own experience is that scientific disciplines, organisations, and individual team members all have their own culture (Latour & Woolgar, Citation1979), their own set of beliefs, practices, habits, routines, work-ethics, which they bring with them to the team setting. Team members must learn how to navigate and negotiate this cultural multiplicity (McGuire et al., Citation2024; National Research Council, Citation1984).
3. Method
To create this case study, we combine aspects of technography (Richards, Citation2001), and the Methodology of Interdisciplinary Research framework (Tobi & Kampen, Citation2018), with our own experience as team members, case-related project documents, and the raw survey data to reflect upon and analyse the construction of a survey instrument, its implementation, and the analysis of the data it collected ().
Table 1. Data sources used to describe different points of focus in the analysis.
3.1. Technography of a survey
Technography refers to the observation of interactions between user and artefact (Richards, Citation2010), and is a suitable approach for the detailed study of socio-technical configurations (Jansen & Vellema, Citation2011). The principal aim of technography is to facilitate understanding of the shaping, use, and impact of technologies in social situations through the description of interactions between humans and technologies (Jansen & Vellema, Citation2011). Although technography is primarily concerned with the manipulation of objects or the application of physical force, we regard the survey as a technology and hence created a case study of “the making of a survey”. Within the technography approach “technology” concerns the study of tools, machines, processes and methods employed in diverse branches of industry (Arora & Glover, Citation2017). Analysing a survey as a socio-technical system can support opening “the black box” to understand how researchers’ skills and interactions influence survey research (Pratley, Citation2010).
As shown in our overview of survey assumptions, opportunities and risks, emerging challenges often are the result of cultural differences. This makes technography a relevant tool, as it elaborates on the performance of tasks and how they are connected to modes of social organisation and frameworks of social and cultural institutions (Arora & Glover, Citation2017). A technography includes three components: a) the study of the making of a tool or transformations; b) the study of distributed cognition; and c) the study of task- and performance-related rules and norms (Jansen & Vellema, Citation2011). To gather these insights, we recorded who on the research team performed which research-related tasks, the transformations made to the tool, and the processes used to make the transformation. We discuss these three components next.
3.1.1. Transformations
In our case study, we describe the transformations and translations of a survey administered to Ugandan banana farmers. To structure our analysis, we describe this process using the individual steps identified in the MIR framework as part of the conceptual design, operationalisation, technical design, implementation (execution) and integration (). We also focus on materials (such as the survey instrument and tablets), actors (such as researchers, enumerators, farmers) and how their actions combine to produce a written document (the process of inscription).
Figure 1. The methodology of interdisciplinary research framework (Tobi & Kampen, Citation2018).
3.1.2. Distributed cognition (task group knowledge)
In the case of making a survey, it is likely that no single person on the research team possesses the full set of required skills and knowledge from the beginning (survey design) to the end (data analysis and reporting). For example, the researcher who leads the conceptual design might not be an expert in statistics. A technographic approach recognizes the distribution of specific knowledge and skills among different actors on a team, which is referred to as distributed cognition. Technographers further use the idea of “task groups” to delineate the performance of tasks across time and space, thereby recognizing the collaborations among team members that are required within survey research. To identify such task-groups, we plot the tasks described in the MIR framework against the different actors involved in them. We describe the actors based on the primary scientific discipline they are affiliated with (if any), the type of organisation they are associated with, and their nationality (national or international).
3.1.3. Rules and norms
The final part of a technography regards the study of how rules and norms emerge from, and are constructed through, the performance of tasks with the aim of delivering the final product. Rules and norms pertain to the protocols, standards and values that guide the selection of methods, define how research is implemented, or the way in which results are reported. For our analysis, we draw upon our own experience as members of the team, comments made by enumerators, email correspondence among team members and attachments, project documents, and actual survey data.
4. Results
4.1. The making of a survey
4.1.1. Conceptual design
Within the conceptual design phase, research teams agree upon the why and what of their study. With respect to the “why” of a research project, a research team typically starts with a general aim as requested by the commissioner or donor, and a set of theories to formulate a research objective. In our case, the household survey was part of an initiative called Breeding Better Bananas (BBB) funded by the Bill and Melinda Gates Foundation (BMGF). The general objective of this initiative was to: “improve the production and productivity of banana in Tanzania and Uganda, through the development and delivery of hybrid banana varieties that are expected to have 30% higher yield compared to the current varieties grown by farmers under the same conditions” (Breeding Better Bananas, Citation2023). The household survey was one of five toolsFootnote1 developed to characterise the banana and agricultural production systems, and the socioeconomic context of these systems, in pre-determined regions targeted for the testing and introduction of new improved banana hybrids.
Specific research objectives were: i) to assist with breeding banana cultivars that better meet the requirements of the users, ii) inform the ongoing adaptive management of the project activities and iii) to create a baseline against which to evaluate in conjunction with an endline, the impact of adoption of the new cultivars on households in the target regions. It appears those objectives were developed in the absence of clearly specified theories central to the research project. With respect to the “what” of a project, the research team transforms objectives into research questions. Research questions embed relevant concepts, [i.e. general notions or ideas based on theory or common sense that are multifaceted and not directly visible or measurable], and possible relations among them. Due to a lack of theory, neither general nor specific research questions were described within the conceptual design of the study.
4.1.2. Operationalization
The objective or research questions/hypotheses defined in the conceptual design of the survey determine what concepts are relevant to capture and how they might cohere. Within the technical design, these concepts are operationalized by crafting survey questions that capture their essence. The operationalization of concepts, i.e. the transformation of concepts into observable attributes and subsequently into variables that can be subjected to measurement requires multiple steps, each informed by theory (Kumar, Citation2018; Tobi & Kampen, Citation2018). In this case, the survey instrument contained the above-three objectives. Subsequently, core members of the research team crafted a list of questions. It was not clarified which questions were supposed to address which objective, nor which concepts those questions were supposed to represent and measure. Furthermore, a justification for the selection of a household survey as instrument to address these objectives was lacking. How the survey should relate to the other four developed tools such as the seasonal calendar or community wealth ranking was not specified either. In general, we can conclude that most operational tasks were not performed, documented or communicated.
4.1.3. Technical design
Within technical design “how, where and when” issues are addressed. A core design team crafted the survey instrument over email in April and May 2015. The team included natural scientists with expertise in plant breeding, agronomy, and biotechnology, and social scientists with expertise in gender, value chains, agricultural economics and decision making. Researchers belonged to both international research institutes and universities, and national (Uganda) research institutes. Some of the team-members working for international research institutes were based in Uganda whereas other team members were based in Europe and the United States.
Between 23 April and 30 May 2015, there were at least six drafts of the tool. The first draft was 14-A4 pages in length, with five topical sections. Each team member received this draft as an email attachment for comment and improvement via track changes in Microsoft Word. Team members from the United States and Europe met with local partners in Kampala, Uganda to finalize and pre-test the survey in June 2015. Over the course of the design process the survey instrument expanded. The final version was 22-A4 pages in length with 15 topical sections (Crichton et al., Citation2017). The final version included both closed and open-ended questions to generate quantitative and qualitative data. Multiple questions appeared in table format, resulting in several hundreds of answers per respondent.
A specific data analysis plan was absent. Although the initial objective of the survey was to establish a baseline in banana-producing communities, the team members involved in data analysis were provided with the task to identify, which variables might influence farmers willingness-to-test new improved banana hybrids on their farm. Via email they were informed that the survey question that should form the basis of this analysis was: “If there were an opportunity to test new banana hybrids in one of your plots, would you be interested in participating?” (Crichton et al., Citation2017, p. 21). This yes/no question was followed by a qualitative prompt: “Please provide a reason for the above answer”. Independent variables were not specified at this stage.
Farming households were selected from 13 villages in Luwero district (Central Uganda) and 14 villages in Mbarara district (Western Uganda). These districts were purposively selected because of the important, yet contrasting nature of banana production for food and income in both districts, and their selection as target areas for the introduction of new banana cultivars. Within each district, a four-stage sampling scheme was used. Administrative lists were created for each (banana growing) sub-unit and a random number generator was used to select the next sub-units. In the subsequent stages in each district (1) sub counties, (2) parishes, (3) villages, and (4) households were selected. To collect sex-disaggregated household-level data, enumerators interviewed one adult man and one adult woman per household (when present). Men and women were interviewed separately to limit influence on responses. The rationale behind this sampling design, that describes how the sampling frame and sampling size were determined and why, was not documented or shared with the researchers tasked with data analysis.
4.1.4. Implementation
An external consultant based in Europe digitalized the survey instrument for administration by enumerators using a tablet. The enumerator team included both men and women, the majority of whom were university-educated Ugandans with previous fieldwork experience and competence in local languages. During the second half of 2015, a small field team administered the survey and obtained 496 valid response forms from sampled banana farmers in the two districts.
When respondents’ answers on demographics, opinions and attitudes were recorded these attributes were transformed into variables and stored in an electronic database. Thereafter, those digitalized variables underwent further transformations by coding, ranking, or re-distribution to make them fit for econometric analysis. Data cleaning, coding and analysis was done by four international researchers: an agronomist, an economist, and two sociologists. Only one of the sociologists was to a limited extend involved in the survey design and none were present during data collection. After coding responses, parsing table-format survey questions, and creating dummy variables the dataset contained a total of 490 variables, of which 391 contained non-redundant information.
The team was tasked to identify the characteristics of farmers who are interested in testing new improved banana hybrids on their farm. The dependent variable of interest scored 89% “YES”. Given the low adoption rates of novel hybrids that are generally reported in Uganda (Sanya et al., Citation2020; Smale & Tushemereirwe, Citation2007; Thiele et al., Citation2021), a probability of 89% did not seem to be a credible proxy for actual adoption. Therefore, the team decided to use the actual presence of hybrids on the farm as a second behavioural proxy, as it reflects the practice of past adoption. This dependent variable scored 24% “YES”.
To enable the analysis, a reduced number of independent variables had to be selected from the main dataset. This selection was challenging given the absence of a clearly-formulated hypothesis and the collection of over 400 variables. Lacking direction and deep knowledge of the survey research process, researchers involved in data analysis determined a first set of independent variables based on their expertise and existing literature. A literature review found several social scientific studies on farmer participation in on-farm trials and banana production in Uganda, which resulted in the identification of 22 potential predictors of farmers’ interest in new improved banana hybrids. As variables that influence adoption of agricultural innovations are hardly uniform across contexts, the team decided to alternatively use machine learning with a Boruta random forest model to determine a second set of independent variables (Kursa, Citation2014). The Boruta algorithm checks variables for a possible connection with the independent variable and selects all variables that outperform the best random predictor. By using this algorithm, the team aimed to capitalize on the large amount of data collected. The Boruta algorithm was run on both dependent variables separately, resulting in 11 and 5 potential predictors, respectively. The selection of dependent and independent variables led to 4 different models that were analysed with Probit regression in R-studio software.
4.1.5. Integration
The results of econometric analysis were synthesized in a table filled with coefficients, standard errors, and P-values. The only independent variable that features significantly among all four models is “region”. The qualitative responses to the follow-up prompt “please provide a reason for the above answer” indicated that farmers’ interpretations of what testing hybrids on their farm would look like were highly variable (Annex 1). Some farmers stated that they expected to receive planting material that they could test at their own convenience. Others said they did not have sufficient space and time available to manage a complicated trial and therefore were not interested. Some farmers indicated that their willingness-to-test depended on the actual conditions of this testing and would participate “only if” some condition was fulfilled.
To our knowledge, no further synthesis or reporting on this household survey was done. Therefore, a further description on how outcomes were interpreted, and conclusions drawn, cannot be provided. Usually, scientists and/or policy makers draw conclusions about the relationship between concepts based on the values that appear in tables showing results of econometric analyses. Such tables, and the conclusions based upon them, are subsequently published and/or used to make policy recommendations, design interventions, or propose additional research. The product of activity of a survey is thus a highly-valued table containing P-values. In other words, the outcome of a survey is a written or “inscripted” form of concepts such as a demographic characteristics, attitudes and opinions and their correlations.
4.2. Identifying task groups
Several types of actors were involved in the survey research namely donors, researchers, students, enumerators, mobilizers and farmers. Both national and international actors associated with philanthropical organizations, universities, non-governmental organizations (NGO) and governmental organizations were involved in the survey. Researchers belonged roughly to three different disciplines: agronomy, economy, and sociology. Other actors such as the Ugandan enumerators belonged to multiple disciplines. The activities described in the MIR framework are listed in . When plotting which actor was involved in which activity, we can see “task-groups” emerge.
Table 2. Schematic representation of an adapted version of “the methodology of interdisciplinary research framework” (Tobi & Kampen, Citation2018), the actors involved in each stage, and their discipline, nationality and organization. Based upon their involvement in different task, we identify an “design task-group” represented in the dotted square, an “implementation task-group” represented in the dot-striped square, and an “analysis task-group” represented in the striped square.
We identified a “design task-group” that was mainly involved in conceptual and technical design and was composed of national and international researchers associated with both universities and NGO’s. We also identified an “implementation task-group”, a group of primarily national/Ugandan students and government officials who implemented the survey and were involved in its pre-testing. One international researcher and international graduate student were present during survey implementation. Finally, we identified an “analysis task-group” that was mainly composed of international researchers: one associated with an NGO and the rest with Western Universities. None of the researchers involved in survey analysis was present during survey implementation and only one was involved in survey design. This means that most transformations of the survey were made within one task-groups and then handed over to the next group. Given the complexity and sequential nature of transformations, the handing over of a completed transformation to a new task group also entails “translations”. Such translation does not only regard a research team’s first or native language, but also disciplinary and organizational language. For example, a coefficient or a P-value is statistical language that might have less meaning for someone outside the analysis task-group. P-values must thus be translated into a conclusion that members of another task-group can understand.
4.3. Rules and norms
The potential value of interdisciplinary, multiorganizational and multinational research is increasingly recognized (Bark et al., Citation2016; Brister, Citation2016). Within agricultural research for development, such teams are becoming the norm as the development challenges being addressed often involve the interaction between humans and their environment (Doss, Citation2006; Tobi & Kampen, Citation2018). Yet, researchers might not have the knowledge and skills to collaborate fruitfully in such teams. Furthermore, the choice of the survey method is normative, as it is assumed that the survey is rigorous, has high external validity, is cost and time effective, and yields quantitative demonstration of returns on investments.
Baseline surveys and surveys to collect information on preferred attributes of an innovation, are most useful at the beginning of a project cycle. In our case study, this resulted in the research team being under severe time pressure to design the survey instrument and collect data. This might be a reason why critical steps in the conceptual and technical design were skipped or poorly documented and communicated. The beginning of a project is also one of the most delicate stages of a project as members of the research team might not know each other at all, are in the process of getting acquainted, need to explore and navigate through cultural differences, and to find their position within the overall project and team hierarchy. Some team members inevitably have more power than others enabling them to in- or exclude survey elements and specific emphasis against the better judgement of others. Within our case study, the above challenges resulted in an overly-ambitious survey instrument that aimed to capture all possible relevant concepts and their correlations while lacking proper operationalization.
During data collection, enumerators had high daily quotas for survey completion and either failed to ask all the questions or did not check that the input answers logged properly. Furthermore, the field supervisor was also collecting data to ensure targets were reached in time, at the cost of quality control. As a result, systematic errors and inconsistencies in answers were not identified and often continued. As reported before in agricultural research for development projects (Pratley, Citation2010), none of the members in the analysis task-group had been part of the implementation task-group. Therefore, important contextual information was missing during data analysis. The effects of the excessive length of the survey instrument and lack of contextual understanding trickled down and complicated implementation and analysis.
5. Discussion and recommendations
Development organizations aim to better understand smallholder farmers and appear to have the ambition to “survey them all” (Girvetz et al., Citation2023). Despite the popularity of the method which can be rigorous, quantitative and cost-effective, many issues in surveys research have been identified and documented (e.g. Biemer et al., Citation2017; Doss, Citation2006; Groves, Citation2005; A. W. Phillips & Artino, Citation2017). We performed a technographic analysis of the making of a household survey in agricultural research for development. We focus on the challenges in survey research that emerged in this interdisciplinary, multiorganizational and multinational setting. With respect to the steps described in the MIR framework, a main insight is that many of them were not performed, documented or communicated among task-groups. Skipping such steps had significant consequences for the quality of survey research and the usefulness of the data collected. Based upon these findings we discuss three pitfalls.
5.1. Pitfall #1: The absence of a clear objective and purpose leading to an extraordinary long survey
The survey research was meant to address three rather general objectives. In total, 391 non-redundant variables were collected. During the design phase of the survey, the research team did not specify which of these variables were supposed to address which objective and why. Furthermore, neither specific research questions nor hypotheses were formulated in the design phase. It appears the design task-group had no consistent idea what to look for. This is not surprising considering that there are hardly any uniform predictors for the adoption of agricultural innovations nor its impact (Knowler & Bradshaw, Citation2007; Pannell et al., Citation2006; Ruzzante et al., Citation2021). Not knowing what to look for is a valid reason for exploratory research, but a survey is not an appropriate tool for exploratory data collection. Although surveys can be analysed with exploratory methods (for example, redundancy analysis or hierarchical clustering), they are less useful for exploratory data collection. The design task-group was large and diverse, which has many potential benefits in such situations. The team could have benefitted from their interdisciplinarity through mixed methods research. Instead of starting with an elaborated survey that tries to capture all possibly relevant variables, qualitative methods can be used for the identification of relevant variables to include in the survey. Thereafter, qualitative methods can be used to support the interpretation of survey outcomes.
Yet in practice, too many cooks spoilt the soup, especially in the absence of clear research purposes or direction. Crafting a survey instrument is often one of the first tasks a research team works on. Relationships between some team members are new, and therefore, fragile. In our case-study, the team of researchers failed to build a real team with an agreed upon vision and approach to the survey. Biases and power inequalities resulting from different positionalities created by disciplinary background, employer, and nationality, amongst others, complicated collaboration. Because these issues were not addressed, they fuelled the expansion of the survey. Instead of critically evaluating the relevance of each proposed question and discussing its possible contribution in answering research questions, discussion and conflict was avoided by simply adding questions to the survey.
The absence of a clearly-specified research model based on carefully drafted hypothesis handicapped subsequent data analysis. The sheer amount of collected variables made it difficult for the analysis task-group to identify any key drivers behind farmers’ decision making. To enable analysis, the analysis task-group had to formulate hypotheses after data collection. Consequently, they ended up with four different models and could only identify “region” as a consistently significant predictor. To enable analysis via a Probit model, a reduced number of variables had to be selected from the extensive list of variables collected. Based on the literature review and professional expertise, researchers considered 22 variables relevant for testing as potential predictors of adoption. Independent selection by a computer algorithm selected even fewer potential predictors. In any case, most of the collected data showed no significant direct relationship with either dependent variable. As a result, it appears much of the data was collected needlessly. Data collection is intrusive and time consuming for the respondent. Data cleaning and processing are time consuming and expensive for researchers. Research teams should build upon each other’s diverse strengths and expertise to reduce the quantity and increase the quality of survey questions, not the other way round. To safeguard quality in the survey design, we recommend not only to formulate survey questions, but also to describe how the responses to these questions are going to be used in a data analysis plan (Ioannidis et al., Citation2014). Such a step will force researchers to more critically evaluate each question.
5.2. Pitfall #2: The challenge of transforming research concepts into variables, leading to ambiguity and the inability to understand what a response in fact measures
Research teams must debate and clearly articulate what a concept means to them to arrive at consensus on how to operationalize that concept before crafting a survey question to measure it. Such dialogue can be complex in an interdisciplinary, multi organizational, and multinational team, as it is plausible that concepts have different disciplinary definitions and meaning (Ludwig et al., Citation2022). This makes it challenging to achieve and maintain a uniform understanding of concepts, and the variables that represent them, among members of the various task-groups (design, implementation and analysis), survey respondents, and the audience of survey outcomes. In our case, data collection suffered from a general lack of rigorous operationalisations to transform concepts into measurable variables. A further complicating factor was that the task-group responsible for data analysis was hardly involved in survey design. Theoretically, this should not be problematic as each team member has their own strengths, but the lack of precise communication, documentation, and hand-over of background documents and contextual background led to a lack of clarity and confusion.
When translations and transformations are not properly operationalized, documented and communicated assumptions will be violated, introducing bias. For example, the survey question that formed the basis of the dependent variable was: “If there were an opportunity to test new banana hybrids in one of your plots, would you be interested in participating?”. This question had a high affirmative response rate; 89% of the farmers showing interest in testing hybrid varieties versus 24% who currently grow hybrids, which suggests some response bias. Furthermore, this question does not reveal anything about the conditions of this testing. When surveys are used to measure qualitative phenomenon such as people’s attitudes, experiences or knowledge, questions must be phrased in a manner that prevents ambiguity. Respondents must be able to understand the question free from arbitrary interpretations (Hallberg, Citation2008).
The qualitative responses to the follow up prompt, “please provide a reason for the above answer” that illuminate why a respondent said s/he was willing to test or not, show how farmers made their own subjective interpretation of what testing meant. The way farmers interpreted this question might have been influenced by the relation that the respondent has with the organisation implementing the survey. Some farmers were beneficiaries of the organisation conducting the research, previously receiving free planting material, whereas others served as demonstration farmers managing on-farm trials. What farmers had in mind – such as getting free planting material or signing up for a complex trial – when answering the question with either “yes” or “no” remains unclear. Such ambiguity makes it impossible to predict if a respondent actually is interested in participating in a trial in the way researchers envisioned (Rzewnicki, Citation1991). More attention needs to be given to cognitive and communicative aspects of survey research instead of only analytical aspects.
5.3. Pitfall #3: The rules and norms that guided the survey research
Describing rural farming communities, the diffusion of agricultural innovations within these communities, and possible impacts of that intervention, is a complex task that requires contextual nuance. While doing so, research teams are subject to the rules and norms that guide agricultural research for development. Funding agencies lean towards and promote certain methodologies and methods (Brister, Citation2016) including the survey as a quantitative “default method” (Bark et al., Citation2016). Research teams often are under time pressure (projects often run for 2 to 4 years), work with limited budgets (often released late), all while trying to capture context (meaningful agroecological and socioeconomic data) and bridge the heterogeneity of their disciplines and backgrounds. These intersecting complicating factors might explain why researchers turn to (quantitative) survey research and treat responses as accurate data. Although these conditions are the reality in which many research teams perform, they should not be permitted to dictate the basic character of social research (Williams, Citation1959).
Furthermore, the fixation on methods that are rigorous in studying fixed, stable and exact phenomena ignores relevant unstable, fluid and changing phenomena that cannot be captured via such methods (Law, Citation2004; Syll, Citation2018). Researchers must recognize that no one survey can “survey all”. Novel ways of doing research, such as working in large, diverse and multiform teams or applying mixed-method research, are attempts to address this problem. Our findings contribute to a vast body of literature that points out that this is far from simple. It requires very different ways of doing research that are related to issues of worldviews, typologies, nomenclature, concepts, methods, techniques, quality standards and evaluation (Steinmetz-Wood et al., Citation2019; Tashakkori & Creswell, Citation2007). Donors should grant researchers the time and budget to develop the required capacities for these novel and continuously-developing ways of doing research. When agricultural research for development teams tasked with such projects are denied sufficient opportunity to learn how to work together, these conditions could seriously hamper the quality of (survey) research.
5.4. Recommendations
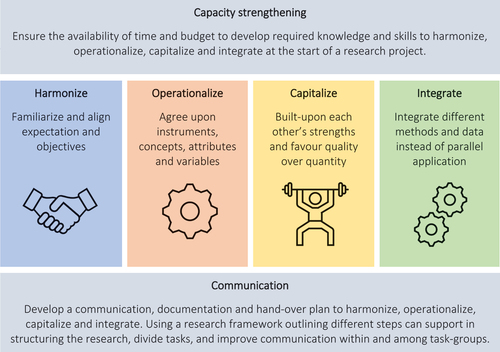
Based on 1) existing literature on challenges in survey research, 2) the nature of interdisciplinary, multiorganizational, and multinational research teams, and 3) the findings from our case study, we conclude that survey research in such conditions is both far from simple, and yet often underestimated. Research partnerships often entail collaboration among international and national universities, governmental, national and international research institutes and non-governmental organizations. Using the insights of this case study, we provide six recommendations to help such teams with respect to capacity strengthening, harmonization, operationalization, capitalizing on strengths, integration and communication (). The use of a research framework outlining different steps can support structuring the research, dividing tasks, and improving communication within and among task-groups. Furthermore, the ability to work through disciplinary, organizational and cultural conflicts is essential. Addressing these concerns will ensure that the intellectual creativity and nuance that such teams can bring to survey design will not become its downfall. If donors wish to support such partnerships, then sufficient time and budget must be allocated to team building and capacity development.
Figure 2. Foundations of complex team effectiveness.
6. Limitations
The technography of this survey was developed in hindsight using observations, experiences, comments, project documents and actual collected data. Although the authors were to some extent involved in each stage of the process, we were unable to follow up with all the involved team members. Therefore, we were able to documents different actors’ involvement in different stages of making a survey, but could not go further into depth describing power dynamics and actual influence of those actors in different stages.
Acknowledgments
We acknowledge the efforts of the team designing, implementing and analysing the survey and the respondents. We also acknowledge all our colleagues who have been engaged in discussions on how to position this paper.
Disclosure statement
No potential conflict of interest was reported by the author(s).
Additional information
Funding
Notes
1 The five tools used in the baseline research were the baseline intra-household survey, trait preferences for banana products and varieties focus group discussion, seasonal calendar focus group discussion, weekly and daily calendar focus group discussion and community wealth ranking focus group discussion.
References
- Arora, S., & Glover, D. (2017). Power in practice: Insights from technography and actor-network theory for agricultural sustainability. STEPS Centre Working Paper. ISBN: 978-1-78118-395-3.
- Ball, H. L. (2019). Conducting online surveys. Journal of Human Lactation, 35(3), 413–25.
- Bark, R., Kragt, M., & Robson, B. (2016). Evaluating an interdisciplinary research project: Lessons learned for organisations, researchers and funders. International Journal of Project Management, 34, 1449–1459.
- Biemer, P., de Leeuw, E., Eckman, S., Edwards, B., Kreuter, F., Lyberg, L., Tucker, N., & West, B. (2017). Total survey error in practice. John Wiley & Sons.
- Biemer, P., & Lyberg, L. (2003). Introduction to survey quality. John Wiley & Sons.
- Bonis, S. (2013). Concept analysis: Method to enhance interdisciplinary conceptual understanding. Advances in Nursing Science, 36(2), 80–93.
- Breeding Better Bananas. (2023). Retrieved October 18, 2023, from https://breedingbetterbananas.org/
- Brister, E. (2016). Disciplinary capture and epistemological obstacles to interdisciplinary research: Lessons from central African conservation disputes. Studies in History and Philosophy of Science Part C: Studies in History and Philosophy of Biological and Biomedical Sciences, 56, 82–91.
- Campbell, L. (2005). Overcoming obstacles to interdisciplinary research. Conservation Biology, 19(2), 574–577.
- Clarke, A., & Fuller, M. (2010). Collaborative strategic management: Strategy formulation and implementation by multi-organizational cross-sector social partnerships. Journal of Business Ethics, 94, 85–101.
- Crichton, R., Ainembabazi, J. H., Caron, C., & Van den Bergh, I. (2017). Tools for understanding the agricultural production systems and their socio-economic context in target regions for the introduction of new banana cultivars: Baseline intra-household survey. Bioversity International, Montpellier, France, 28. http://hdl.handle.net/10568/89321
- Dasborough, M., & (2010) Book Review of ‘Saris’, W. E. (2010). Book review: Dasborough: Saris, W. E. & gallhofer, I. N. (2007). Design, evaluation, and analysis of questionnaires for survey research. Hoboken, NJ: Wiley. Organizational Research Methods, 13(4), 834–837.
- Doss, C. (2006). Analyzing technology adoption using microstudies: Limitations, challenges, and opportunities for improvement. Procedia - Social and Behavioral Sciences Elsevier BV, 34(3), 207–219.
- Fischer, A., Tobi, H., & Ronteltap, A. (2011). When natural met social: A review of collaboration between the natural and social sciences. Interdisciplinary Science Reviews, 36(4), 341–358.
- Fraval, S., Hammond, J., Wichern, J., Oosting, S., de Boer, J., Teufel, N., Lannerstad, M., Waha, K., Pagella, T., Rosenstock, T., Giller, K., Herrero, M., Harris, D., & Van Wijk, M. (2019). Making the most of imperfect data: A critical evaluation of standard information collected in farm household surveys. Procedia - Social and Behavioral Sciences Elsevier BV, 55(2), 230–250.
- Freeth, R., & Caniglia, G. (2020). Learning to collaborate while collaborating: Advancing interdisciplinary sustainability research. Sustainability Science, 15(1), 247–261. https://doi.org/10.1007/s11625-019-00701-z
- Freshwater, D., Sherwood, G., & Drury, V. (2006). International research collaboration: Issues, benefits and challenges of the global network. Journal of Research in Nursing, 11(4), 295–303.
- Gillett, A., Loader, K., Doherty, B., & Scott, J. (2016). A multi-organizational cross-sectoral collaboration: Empirical evidence from an ‘empty homes’ project. Public Money & Management, 36(1), 15–22.
- Girvetz, E., Hammond, J., Van Wijk, M., & Frelat, R. (2023). One tool to survey them all: Standardization creates helpful datasets – and individual pictures – of smallholder families across the globe. Retrieved January 24, 2023, from https://www.cgiar.org/news-events/news/one-tool-to-survey-them-all-standardization-creates-helpful-datasets-and-individual-pictures-of-smallholder-families-across-the-globe/
- Gorman, L., Browne, W., Woods, C., Eisler, M., van Wijk, M., Dowsey, A., & Hammond, J. (2021). What’s stopping knowledge synthesis? A systematic review of recent practices in research on smallholder diversity. Frontiers in Sustainable Food Systems, 5, 727425.
- Groves, R. (2005). Survey errors and survey costs. John Wiley & Sons.
- Guterbock, T., & Marcopulos, B. (2020). Survey methods for neuropsychologists: A review of typical methodological pitfalls and suggested solutions. The Clinical Neuropsychologist, 34(1), 13–31.
- Hair-Jr, J., Bus, R., & Ortinau, D. (2006). Marketing research. McGraw-Hill.
- Hallberg, I. (2008). Surveys. In R. Watson, H. McKenna, S. Cowman, & J. Keady (Eds.), Nursing research: Designs and methods (pp. 179–189). Elsevier Health Sciences.
- Harkness, J., Braun, M., Edwards, B., Johnson, T., Lyberg, L., Mohler, P., Pennell, B., & Smith, T. (2010). Survey methods in multinational, multiregional, and multicultural contexts. John Wiley & Sons.
- Hipp, L., Bünning, M., Munnes, S., & Sauermann, A. (2020). Problems and pitfalls of retrospective survey questions in COVID-19 studies. Survey Research Methods, 14(2), 109–114.
- Ioannidis, J., Greenland, S., Hlatky, M., Khoury, M., Macleod, M., Moher, D., Schulz, K. F., & Tibshirani, R. (2014). Increasing value and reducing waste in research design, conduct, and analysis. Lancet, 383(9912), 166–175.
- Jansen, K., & Vellema, S. (2011). What is technography? NJAS: Wageningen Journal of Life Sciences, 57(3–4), 169–177.
- Kanbur, R., & Shaffer, P. (2007). Epistemology, normative theory and poverty analysis: Implications for Q-squared in practice. World Development, 35(2), 183–196.
- Kandiyoti, D. (1999). Poverty in transition: An ethnographic critique of household surveys in post‐Soviet central asia. Development & Change, 30(3), 499–524.
- Kelley, K., Clark, B., Brown, V., & Sitzia, J. (2003). Good practice in the conduct and reporting of survey research. International Journal for Quality in Health Care, 15(3), 261–266.
- Kim, K. (2006). Measuring international research collaboration of peripheral countries: Taking the context into consideration. Scientometrics, 66(2), 231–240.
- Knowler, D., & Bradshaw, B. (2007). Farmers’ adoption of conservation agriculture: A review and synthesis of recent research. Food Policy, 32(1), 25–48.
- Kumar, R. (2018). Research methodology: A step-by-step guide for beginners (3rd ed.). Sage Publications.
- Kursa, M. (2014). Robustness of random forest-based gene selection methods. BMC Bioinformatics, 15(1), 1–8.
- Latour, B., & Woolgar, S. (1979). Laboratory life. Sage Publications.
- Law, J. (2004). After method: Mess in social science research. Routledge.
- Liamputtong, P. (2010). Performing qualitative cross-cultural research. Cambridge University Press.
- Lowndes, V., & Skelcher, C. (1998). The dynamics of multi‐organizational partnerships: An analysis of changing modes of governance. Public Administration, 76(2), 313–333.
- Ludwig, D., Boogaard, B., Macnaghten, P., & Leeuwis, C. (2022). The politics of knowledge in inclusive development and innovation. Routledge.
- Lyall, C., Bruce, A., Tait, J., & Meagher, L. (2011). Interdisciplinary research journeys: Practical strategies for capturing creativity. Bloomsbury Academic.
- Magnuson, B., Jain, S., Roomian, T., Pagni, S., Tran, D., & Finkelman, M. D. (2020). Conducting surveys in dental education research: Guidelines and reminders. Journal of Dental Education, 84(3), 283–289.
- Malhotra, N. (2002). Marketing research an applied orientation. Pearson.
- McGuire, E., Al-Zu’bi, M., Boa-Alvarado, M., Luu, T., Sylvester, J., & Leñero, E. (2024). Equity principles: Using social theory for more effective social transformation in agricultural research for development. Agricultural Systems, 218, 103999.
- McInroy, L. (2016). Pitfalls, potentials, and ethics of online survey research: LGBTQ and other marginalized and hard-to-access youths. Social Work Research, 40(2), 83–93.
- Mowles, C. (2013). Evaluation, complexity, uncertainty – theories of change and some alternatives. In T. Wallace, F. Porter, & M. Ralph-Bowman (Eds.), AID, NGOs and the realities of women’s lives: A perfect storm (pp. 47–60). Practical Action Publishing.
- Moy, P., & Murphy, J. (2016). Problems and prospects in survey research. Journalism & Mass Communication Quarterly, 93(1), 16–37.
- National Research Council. (1984). Cognitive aspects of survey methodology: Building a bridge between disciplines: Report of the advanced research seminar on cognitive aspects of survey methodology. National Academies Press.
- Nyanga, P. (2012). Factors influencing adoption and area under conservation agriculture: A mixed methods approach. Sustainable Agriculture Research, 1(2), 27.
- Oll, J., Hahn, R., Reimsbach, D., & Kotzian, P. (2018). Tackling complexity in business and society research: The methodological and thematic potential of factorial surveys. Business & Society, 57(1), 26–59.
- Pannell, D., Marshall, G., Barr, N., Curtis, A., Vanclay, F., & Wilkinson, R. (2006). Understanding and promoting adoption of conservation practices by rural landholders. Procedia - Social and Behavioral Sciences Elsevier BV, 46(11), 1407–1424.
- Peña, E. (2007). Lost in translation: Methodological considerations in cross‐cultural research. Child Development, 78(4), 1255–1264.
- Phillips, A. (2017). Proper applications for surveys as a study methodology. The Western Journal of Emergency Medicine, 18(1), 8–11.
- Phillips, A. W., & Artino, A. R. (2017). Lies, damned lies, and surveys. Journal of Graduate Medical Education, 9(6), 677–679.
- Pratley, P. (2010). Opening the black box of a household survey: A technography on the collection of data under field conditions [ MSc thesis]. Wageningen University and Research.
- Richards, P. (2001). Reviving the green revolution: A technographic approach. In P. Hebinck & G. Verschoor (Eds.), Resonances and dissonances in development actors, networks, and cultural repertoires (pp. 19–32). Royal Van Gorcum.
- Richards, P. (2010). A green revolution from below?: Science and technology for global food security and poverty alleviation. Wageningen University.
- Ruzzante, S., Labarta, R., & Bilton, A. (2021). Adoption of agricultural technology in the developing world: A meta-analysis of the empirical literature. World Development, 146, 105599.
- Rzewnicki, P. (1991). Farmers perceptions of experiment station research, demonstrations, and on‐farm research in agronomy. Journal of Agronomic Education, 20(1), 31–36.
- Sanya, L., Sseguya, H., Kyazze, F., Diiro, G., & Nakazi, F. (2020). The role of variety attributes in the uptake of new hybrid bananas among smallholder rural farmers in central Uganda. Agriculture & Food Security, 9(1), 1–13.
- Saris, W., & Gallhofer, I. (2007). Design, evaluation, and analysis of questionnaires for survey research. John Wiley and sons.
- Schreyer, R. (1980). Survey research in recreation management – pitfalls and potentials. Journal of Forestry, 78(6), 338–340.
- Schwarz, N. (2007). Cognitive aspects of survey methodology. Applied Cognitive Psychology: The Official Journal of the Society for Applied Research in Memory & Cognition, 21(2), 277–287.
- Shaffer, P. (2013). Ten years of “Q-Squared”: Implications for understanding and explaining poverty. World Development, 45, 269–285.
- Smale, M., & Tushemereirwe, W. (2007). An economic assessment of banana genetic improvement and innovation in the Lake Victoria region of Uganda and Tanzania. Research report 155. International Food Policy Research Institute.
- Steinmetz-Wood, M., Pluye, P., & Ross, N. (2019). The planning and reporting of mixed methods studies on the built environment and health. Preventive Medicine, 126, 105752.
- Syll, L. (2018). The main reason why almost all econometric models are wrong. WEA Commentaries, 8(3), 5–10.
- Tashakkori, A., & Creswell, J. (2007). Editorial: The new era of mixed methods. Journal of Mixed Methods Research, 1(1), 3–7.
- Thiebes, S., Gao, F., Briggs, R., Schmidt-Kraepelin, M., & Sunyaev, A. (2023). Design concerns for multiorganizational, multistakeholder collaboration: A study in the healthcare industry. Journal of Management Information Systems, 40(1), 239–270.
- Thiele, G., Dufour, D., Vernier, P., Mwanga, R., Parker, M., Schulte Geldermann, E., Teeken, B., Wossen, T., Gotor, E., Kikulwe, E., Tufan, H., Sinille, S., Kouakou, A., Friedmann, M., Polar, V., & Hershey, C. (2021). A review of varietal change in roots, tubers and bananas: Consumer preferences and other drivers of adoption and implications for breeding. International Journal of Food Science & Technology, 56(3), 1076–1092.
- Thompson, J., & Scoones, I. (2009). Addressing the dynamics of agri-food systems: An emerging agenda for social science research. Environmental Science & Policy, 12(4), 386–397.
- Tobi, H., & Kampen, J. (2018). Research design: The methodology for interdisciplinary research framework. Quality & Quantity, 52, 1209–1225.
- Torchiano, M., Fernández, D., Travassos, G., & De Mello, R. (2017). Lessons learnt in conducting survey research. ICSE ‘17: 39th International Conference on Software Engineering, May 20 - 28, 2017, Buenos Aires, Argentina (pp. 33–39). CESI.
- Van de Vijver, F., & Leung, K. (2021). Methods and data analysis for cross-cultural research. Cambridge University Press.
- Wagner, C. (2008). The new invisible college. Science for development. Brookings Institution Press.
- Williams, T. (1959). A critique of some assumptions of social survey research. Public Opinion Quarterly, 23(1), 55–62.