
 ?Mathematical formulae have been encoded as MathML and are displayed in this HTML version using MathJax in order to improve their display. Uncheck the box to turn MathJax off. This feature requires Javascript. Click on a formula to zoom.
ABSTRACT
The present work proposes a multi-stage optimization technique for damage detection of the thin plate-like structure using sparse modal data collected from the limited sensors. The response of the thin plate structures is obtained from a finite element model, which is developed with constant strain triangle elements. The iterated improved reduction system (IIRS) is applied to simulate the state of sparse sensors numerically. Next, the damage identification problem is formulated as a constrained optimization problem. A weighted linear combination of the natural frequencies and modes shapes of the structure is used to construct the objective function. The damage extent of each element is considered as the design variable. The formulated objective function is minimized by the proposed multi-stage strategy employing a hybrid metaheuristic algorithm, which is based on particle swarm optimization and gravitational search algorithm (PSOGSA). The algorithm identifies the healthy elements in each stage and eliminates them from the search space of the next stage. Thus, the search space dimension of the optimization problem reduces in each stage, and actual damaged elements are identified effectively. The efficiency of the proposed method is demonstrated through three numerical examples with different damage scenarios.
1. Introduction
A structural system faces different types of damage throughout its service life. The presence of these damages adversely affects the performance of the structure. So, structural damage assessment plays an important role in structural health monitoring (SHM). Local damage detection and global damage detection technique are the two techniques for damage detection. Vibration-based damage detection methods (VBDD) are one of the global damage detection techniques. The presence of damage in the structure changes the modal parameters of the structure. Inverse techniques are used to identify the damage of the structure by utilizing the changes in modal parameters. Frequency and mode shape are the most popular modal signals which are used for damage detection.
There are different inverse methods are developed by the researchers for damage detection in engineering structures [Citation1–4]. In recent years, several studies have been performed where the damage detection problem is defined as an optimization problem. In this technique, a mathematical relation between the modal parameters of the actual damage structure and the finite element (FE) model is formulated, often referred to as error or objective function. This error function is minimized using a suitable optimization method, and the FE model is updated accordingly to identify the damaged members of the structure. Among these different kinds of optimization techniques, metaheuristic-based optimization techniques are used mostly. These nature-inspired algorithms are population-based and independent of gradient information of the objective function. These algorithms are capable of global search and avoid the local minima trap. Some of the examples of metaheuristic algorithms, which are used for damage identification, are genetic algorithm and its hybrid variants (GA) [Citation5,Citation6], Particle Swarm Optimization (PSO) and its improved variants [Citation7,Citation8], Ant Colony Optimization (ACO) [Citation9], Harmony search Algorithm [Citation10], Cuckoo Search (CS) method [Citation11], Magnetic Charged System Search (MCSS) [Citation12], Improved Charged System Search (CSS) Method [Citation13], Artificial Bee Colony (ABC) [Citation14,Citation15], Gravitational Search Algorithm (GSA) [Citation16], Echolocation Search Algorithm (ESA) [Citation17], Cyclical Parthenogenesis Algorithm (CPA) [Citation18], Big Bang and Big Crunch (BB-BC) optimization algorithm [Citation19], Tug-of-War Optimization (TWO) algorithm [Citation20], Teaching-Learning-Based Optimization (TLBO) [Citation21], Moth Flame Optimization (MFO) [Citation22], Grey Wolf Optimization (GWO) [Citation23], Slap Swarm Algorithm (SSA) [Citation24], Multiverse Optimizer (MVO) [Citation25] and others.
These metaheuristic-based approaches described above performed well to identify the structural damage. But, researchers were interested to improve the performance of the algorithms in terms of accuracy and cost-efficiency. So, hybrid metaheuristics algorithms started to gain popularity considerably among the researchers in combinational optimization [Citation26]. These hybrid optimization techniques are used in many engineering problems, and some are also applied in structural damage detection problem. Begambre and Laier [Citation27] used a strategy to control PSO parameter using Nelder–Mead algorithm (simplex method) and identified damage of truss and beam. Sandesh and Shankar [Citation28] developed a hybrid GA-PSO to detect the crack in the plate structure. Baghmisheh et al. [Citation29] proposed a hybrid Particle Swarm–Nelder–Mead (PS–NM) algorithm for estimating the crack location and depth. Qian et al. [Citation30] combined PSO with simplex method (SM) to identify delamination in laminated beams. Pan et al. [Citation31] improved the local searching capability of Firefly Algorithm (FA) by incorporating Nelder–Mead algorithm and applied this hybrid self-adaptive Firefly–Nelder–Mead (SA-FNM) algorithm for structural damage detection. Damage detection of thin plates was performed by Vaez and Fallah [Citation32] using hybrid GA-PSO. Kaveh and Dadras [Citation33] developed an enhanced thermal exchange optimization technique using GWO at the meta-level and Thermal Exchange Optimization (TEO) based level and used it for structural damage identification problem. Some other examples of damage identification using hybrid metaheuristic optimization algorithms can be found in [Citation34–37]. However, Mirjalili and Hashim [Citation38] proposed a hybrid algorithm PSOGSA, which is developed hybridizing PSO and GSA. This algorithm is proven more efficient than other algorithms for different applications [Citation39–41]. But, its capability in structural damage detection problem is still unexplored. In this study, the capability of PSOGSA in structural damage detection will be explored.
Optimization techniques are very efficient for damage detection of structures when the number of structural elements (design variables) is less. When the optimization algorithm tries to identify the damage location and its extent simultaneously for large structures, it increases the computational cost and reduces the accuracy of damage identification. So, researchers tried to develop methods to reduce design variables and decrease the dimension of the search space. In this regard, the multi-stage approach is evolved as a variable reduction technique, where a single metaheuristic algorithm is applied in multiple stages to identify the damage. Damage variables reduce in each stage, and real damaged elements are identified eventually. Here damage localization is done by the stages, and damage quantification of damage is carried out simultaneously. The multi-stage strategy was successfully applied in the structural damage detection by [Citation42–44]. A novel self-controlled multi-stage strategy with an adaptive threshold value of damage index was introduced by Das and Dhang [Citation45]. In the present study, an efficient multi-stage strategy has been proposed and employed for damage identification.
Plate-like structure is an essential structural component and has several applications in many engineering structures (e.g. aerospace, civil, and mechanical). This plate structure can be damaged due to fatigue, buckling, impact load, corrosion, and other service loads. Like other structures, damage or crack reduces the plate’s stiffness, which affects its vibrational characteristics. Various vibration-based response parameters have been developed for one-dimensional structures like beam, truss, and frame structures. Comparatively, the study on damage identification of two-dimensional plate-like structures is less. Cawley and Adams [Citation46] were probably the first who developed a damage detection algorithm for plate structures based on frequency shifts. Though considerable numbers of literature are available for damage identification of plate structures applying various methods, very few are available using metaheuristic methods. Some literature on damage detection of plate structures using metaheuristics optimization-based damage detection techniques are [Citation14,Citation28,Citation44,Citation47,Citation48]. The forward FE method model of the plate is generally developed using thin plate and thick plate element applying Kirchhoff plate theory and Mindlin plate theory, respectively. Sometimes thin plate can be considered in plane stress condition and can be modelled with constant strain triangle (CST) elements [Citation32]. This consideration will make the forward model simple and reduce computational costs. One of the noticeable studies on the damage identification of the thin plate study was performed by Vaez and Fallah [Citation32] using the GA-PSO algorithm based on modal data. Study on damage identification of thin plate has done very few, so more studies on the thin plate damage detection techniques are required.
The metaheuristic-based damage detection technique needs to have the complete modal data from both numerical models and actual structure. Practically, it is not possible to install sensors at every node, so the modal data generally obtained from the experiments are incomplete. In real-life, the number of sensors installed on a structure is much less than the total degrees of freedom (DOFs) in a FE model. The problem arising from the sparse or incomplete modal data can be tackled by two techniques. Firstly, the experimental mode shapes can be expanded to match the global model, which is known as the modal expansion technique [Citation49]. Examples of damage identification using mode shape expansion can be found in [Citation23,Citation50–52]. Secondly, DOFs of the FE model can be reduced to match the measured DOFs of the experimental structure, which is known as model reduction technique [Citation53,Citation54]. A detailed study on modal reduction techniques can be found in [Citation55]. The model expansion techniques can aggregate additional errors [Citation53], so in the present study model reduction technique is used.
Based on these considerations, the paper proposes a robust and efficient multi-stage strategy to identify the damage in thin plate structures with sparse modal data using a hybrid optimization algorithm called hybrid Particle Swarm Optimization-Gravitational Search Algorithm (PSOGSA). In the proposed method Iterated Improved Reduction System (IIRS) method is employed as a model reduction technique. The IIRS is chosen for the present study as it gives more accurate results than other available reduction techniques [Citation56]. Next, an objective function is formulated using the combination of frequency and modal assurance criteria (MAC). This objective function is minimized using hybrid PSOGSA along with a novel and efficient multi-stage strategy. In the present paper, three numerical examples of thin plate structures are used to investigate the efficiency of the proposed multi-stage PSOGSA using the sparse modal data, and the results are compared with other well-established three algorithms.
The remaining parts of this article are organized as follows. Section 2 briefly introduces damage modelling. Next, Section 3 describes modelling of noise. Then, Section 4 presents a background of IIRS method. The formulation of damage identification as an optimization problem using modal parameters is described in Section 5. Next, a description of hybrid PSOGSA and proposed multi-stage strategy are given in Section 6. In Section 7, the performance of the proposed algorithm through numerical examples is described. Finally, the concluding remarks are given in Section 8.
2. Damage modelling
Damage can be introduced to the structure by reducing stiffness and mass of the structural elements of the structure. In the present study, the damage is modelled by reducing the elasticity modulus (E) of the element, and it is assumed that the mass of the structure will remain constant. A scalar parameter ‘damage index’ is introduced here for the reduction of the modulus of elasticity. The value of
lies in range [0,1], where value ‘one’ indicates the total damage of the structure and a value ‘zero’ indicates no damage to the corresponding member. The
is defined as follows
(1)
(1) where elastic moduli of the of the ith member of the structure in the undamaged and damaged state are denoted by
and
. The corresponding damage index of the ith element is represented by
. Then stiffness matrix of the ith member due to damage can be updated as
(2)
(2) [k]ei and
are the initial and updated damaged stiffness matrix of the ith member of the structure, respectively. Next, updated element stiffness matrix of members can be assembled to create the total stiffness matrix
of the damaged structural system.
In this present study, it is assumed that the mass matrix remains constant [Citation9,Citation57]. The eigenvalue equation of the damaged system can be expressed as
(3)
(3) where
is the global stiffness matrix of the damaged structure, and
is the global mass matrix.
and
represent the natural frequency and corresponding mode shape for the damaged structure, respectively.
3. Modelling of noise
In the real-life scenario, experimental data are always polluted with noise. So, it is required to check the performance of the proposed method with noisy data. In the present study, numerically simulated mode shapes and frequencies are contaminated with Gaussian white noise. Equation (4) and Equation (5) represent the noise addition in frequency and mode shape, respectively.
(4)
(4)
(5)
(5) where
is the ith natural frequency contaminated by noise and
is the jth component of the ith mode shape vector polluted by noise;
is the noise level in percentage (e.g. 5.0 relates to 5.0% noise level) and randn is a random number normally distributed with a mean zero and standard deviation one [Citation58]. In the present study, natural frequencies and modes shapes are contaminated with
and
Gaussian white noise, respectively [Citation44,Citation45].
4. Iterated improved reduction system (IIRS)
In the present damage detection study, vibration-based parameters like mode shapes and frequencies of the structure are utilized. These mode shapes and frequencies of the structure are obtained from a real-life structure through experimental modal analysis (EMA). The sensors installed at each node of the structure are used to get the vibration data of every degree DOFs. EMA utilized these vibration signals from each DOFs to construct the mode shapes and frequencies of the structure. But, in the real-life scenario, it is not possible to place the sensor at all DOFs or nodes and measure vibration signals from each DOFs. So, in real-life scenario limited data from limited sensors are available to obtain mode shapes and frequencies of the structure. However, it is necessary to ensure that the measured DOFs and modes are equal and match with the developed FE model. This can be achieved by following two approaches [Citation59]:
The FE model DOFs may be reduced to match the same DOFs as the measured ones. This method is called the model reduction technique. Sometimes, when the FE model consists of large numbers of DOFs, this technique is also applied to reduce the DOFs of the FE model. This will lead to a faster computation of natural frequencies and mode shapes of structures [Citation60].
The measured DOFs data may be expanded to the same number of DOFs as the FE model ones. This approach is known as the model expansion technique.
In the present study, model reduction technique is used, where the DOFs of the structure are divided into two groups named master DOFs and slave DOFs. The DOFs which can be measured by the installed sensors are called master DOFs, and which cannot be measured by the installed sensors are called slave DOFs. These slave DOFs will be eliminated from the full-scale FE model to get a reduced FE model consisting of only master DOFs. Then, the eigenvalue problem is solved for this reduced FE model to get the frequencies and mode shapes. One of the most popular reduction methods is static or Guyan reduction method [Citation61]. However, this method neglects the inertia terms, so it is reliable only at zero frequency. This drawback can be overcome by considering the inertia terms [Citation60,Citation62,Citation63]. Friswell et al. [Citation60] proposed Iterated improved reduction system (IIRS), which will include the inertia effects, and lead to an accurate reduced model. It is observed that IIRS [Citation56] is performing better than other existing methods. So, in the present study, IIRS is employed to get the reduced model. This method is briefly described in the following.
The eigen value equation of structure can be rewritten by selecting master and slave DOFs as:
(6)
(6) where the subscripts m and s denote the master and slave DOFs, respectively. The equation related to the second row of the Equation (6) can be written as
(7)
(7) Equation (7) can be written as:
(8)
(8) Equation (8) can be expanded using binomial theorem as
(9)
(9) Ignoring the higher order terms, Equation (9) can be modified as
(10)
(10) After rearranging Equation (10) can be expressed as
(11)
(11) where
(12)
(12)
(13)
(13)
(14)
(14)
(15)
(15)
The subscript i indicates the ith iteration. The transformation matrix , reduced stiffness
, and mass matrices
of the ith iteration of IIRS are given by Equations (11), (14), and (15), respectively. The total mode shapes can be obtained by
(16)
(16) In the present study, the number of iterations of IIRS is set as 10 for all examples. The reduced stiffness matrix ([KIRS,i]) and reduced mass matrix ([MIRS,i]) will be used in the eigenvalue problem defined by Equation (3). The mode shapes and frequency obtained from the eigenvalue solution will be used in the damage identification problem.
5. Optimization-based damage identification
An error function can be constructed using the modal parameters of the measured and numerical modal data. This error function will be minimized by an optimization algorithm to identify the location and severity of the damage.
5.1. Objective function
Frequency can be easily obtained and it is the least affected by noise. But, damage cannot be effectively identified by using frequencies alone. In the present method, an objective function based on the linear combination of frequencies and mode shapes is utilized. The frequencies and mode shapes of the structure can be obtained by Equation (3).
The error in the frequency can be expressed by Equation (17).
(17)
(17) Here,
is the numerically obtained
frequency of the structure, and it is a function of damage indices.
is a variable part of the Equation (17) and it will be updated iteratively to minimize the objective function, which is defined by the Equation (20).
is the experimentally obtained
frequency of the actual structure, it is a constant part of the Equation (17). NF is the number of frequencies.
The error in frequency alone cannot predict the damage location and its extent properly. So, an error in mode shape based function is required for better results. The error in mode shape can be incorporated through a correlation function named modal assurance criteria (MAC). The MAC basically establishes a correlation between two mode shapes and
. The modal assurance criteria (MAC) is formulated as [Citation64]
(18)
(18) where
represents gth mode shape. A MAC value of one indicates two exactly correlated modes, whereas a MAC value zero indicates no correlation between two modes.
The error in the MAC value is shown in Equation (19).
(19)
(19) Here,
is the numerically obtained
mode shape of the structure, and it is a function of damage indices.
is a variable part of the Equation (19) and it will be updated iteratively to minimize the objective function, which is defined by Equation (20).
is the experimentally obtained
mode shape of the actual structure, it is a constant part of the equation (19). M represents the number of mode shapes.
The linear combination of error in frequency and the MAC value is presented as:
(20)
(20) where
depends on a vector
, which represents the damage variable containing the damage severity (θi, i = 1,2, … t); t is the number of structural elements of the numerical model.
and
are the weighting factors to ensure a well-conditioned objective function [Citation65]. For the present study, the values of
and
were taken as 0.01 and 100, respectively. So, the damage detection problem is reduced to a constrained optimization problem, where the objective function is minimized to find a set of design variables. Here, the set of damage indices is used as design variables. So, the constrained optimization problem is defined as
(21)
(21) where
and
are the lower and upper bound of the damage index. For the present problem damage index (
) ranges from 0 to 0.9. The Equation (21) represents a constrained minimization problem with t dimensional search space, here t represents the total number of structural elements which are considered as design variables.
The minimization problem defined by Equation (21) can be solved by any optimization technique. However, with the increase of the design variables and considering the noise in the input data, the conventional optimization methods and gradient-based techniques are found to be inefficient to identify damage. Because, the conventional algorithms easily fall into the local minima trap and lead to inaccurate results, and information of gradient is not always available. Whereas, this local minimum trap can be avoided easily by utilizing population-based metaheuristic algorithms. Hence, metaheuristic algorithm is adopted to solve the minimization problem of the present study.
6. Optimization algorithms
GSA, proposed by E. Rashdeli et al. [Citation66], is a population-based search algorithm based on gravity rules and mass interactions. It has been proven that GSA has an excellent capability of local search. PSO is also a population-based search technique proposed by Kennedy and Eberthart [Citation67]. PSO is known for its ability of social thinking, which enhances its capability of global search. Mirjalili and Hashim [Citation38] introduced a hybrid PSOGSA algorithm combing the capability of social thinking in PSO with the local search ability of GSA. Mirjalili and Hashim [Citation38] hybridize PSO with GSA using is a low level co-evolutionary heterogeneous hybrid algorithm. The combining procedure of PSO and GSA is stated below.
6.1. Particle swarm optimization
PSO is a swarm-based metaheuristic search technique utilizing the social behaviour of a swarm of birds. Initially, a swarm of particles is generated with random velocity and position in a specified search space. Each of the particles is a potential candidate for the solution of the problem. The velocity and position of each particle ( ith particle at tth iteration) is updated using Equation (22):
(22)
(22) where
and
are the position and velocity of ith particle at tth iteration, w is the weighting function, C1 and C2 are the cognitive and social scaling parameter respectively, rand is a random number between 0 and 1, pbesti is the best position achieved by ith particle at tth iteration and gbest is the global best solution achieved by the swarm so far.
6.2. Gravitational search algorithm
One of the recently developed population-based searched algorithms is GSA, which is developed by utilizing the idea of the gravitational laws and Newtonian laws of motion. It is a population-based method, each and every agent of the population is a potential candidate for the solution and is referred to as an object. The performance of each object is mainly determined by its mass. Each and every mass of the population follows the gravitational law and attract each other. The heavier mass will generate more attraction force towards other objects. Thus, the heaviest masses will have the best chance to reach the closest position to the global minimum, and it will attract other masses to that location according to their mass and distances. The mathematical formulation is as follows.
At first, P number of agents (masses) with random positions are generated in the search space. The position of each candidate is a potential solution to the problem. So, the position of the ith agent in the n dimensional search space is described as:
(23)
(23) where
represents the position of ith agent in the kth dimension. The algorithm randomly places all the agents in the search space. At time t the gravitational force
applied by agent j on agent i in the kth dimension can be expressed as:
(24)
(24) where G(t) is gravitational constant at a time t,
is the passive gravitational mass of agent i,
is the active gravitational mass of agent j,
is the Euclidian distance between two agents i and j and ε is a small constant. The gravitational constant G(t) and the Euclidian distance between two agents i and j are calculated as follows:
(25)
(25)
(26)
(26) where
represents the initial value of gravitational constant, α is the descending coefficient, t is the current iteration and tmax is the maximum number of iterations.
The total force exerted on an agent i from the other masses present in the kth dimensional search space can be computed as:
(27)
(27) where
is a random number uniformly distributed in the range [0,1].
In accordance to Newton’s second law of motion, the acceleration of an agent i with mass , in the kth dimensional search space at time t is given as:
(28)
(28) The velocity and position of an agent i in the kth dimension of the problem are calculated as follow:
(29)
(29)
(30)
(30) where
is a random number uniformly distributed in the range [0,1].
In this algorithm, at first user specified number of agents are generated with random and different initial mass and position. The gravitational constant is calculated using Equations (25) and (26), which is used afterward to calculate the gravitational force between two agents (mass) using Equation (20). Then, the total force exerted on an agent is calculated using Equation (27). Afterward, the acceleration of that agent is calculated using Equation (28). Then using this acceleration data, the velocity and position of the particle are updated using Equations (29) and (30), respectively. Next, the objective function is evaluated on the basis of the new position of the agents. The aforesaid process continues in a closed loop until the algorithm meets the termination criteria defined by the user.
6.3. Hybrid PSOGSA algorithm
It is observed that GSA has an excellent capability of local exploration, and the social thinking (gbest) capability of PSO is a unique and robust ability, which enhances the performance of the PSO in global search. So, the individual strength of PSO and GSA are combined together to develop a new hybrid algorithm which performs better in both local and global search. The algorithms are hybridized using Equation (31), which is described as follows:
(31)
(31) where
is the velocity of agent i at iteration t,
is an acceleration coefficient. w is a weighting function, rand is a random number uniformly distributed in the range [0,1],
is the acceleration of agent i at iteration t, and gbest is the best solution so far.
The position of the agent i particle is updated as follows:
(32)
(32) Here, all agents are randomly generated with different initial masses and positions. Each agent is considered a potential candidate for the solution. At first, a population of the particles (agents) is generated, then the accelerations of the particles are calculated by Equation (28) after calculating gravitational force, gravitational constant, and resultant force using Equations (24), (25), and (27), respectively. In each iteration, the best solution is achieved till now is identified. The velocities of all agents are calculated using Equation (31). Finally, the position of each particle is updated using Equation (32), and the process repeats until the termination criterion is met. In the present study, for all the cases, the population size is taken as 75. Besides, the values of
and
are fixed to 0.75 and 2.05, the initial value of gravitational constant
is taken as 1, initial velocities of the particles are generated randomly in the range [0,1], and w value decreases from 0.9 to .02 with a damping ratio 0.99.
6.4. Multi-stage strategy
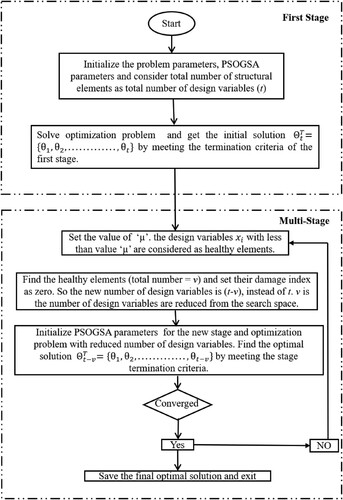
Sometimes, optimization algorithms with the single-stage strategy identify some undamaged members as damaged members with very less severity of damage. As a result, the actual damage location with the original damage extent cannot be captured exactly. In addition, in the single-stage strategy damage localization and quantification are performed simultaneously, which increases the computational cost. However, these drawbacks can be overcome by employing multi-stage strategy. In this study, a novel multi-stage strategy is proposed. Optimization algorithm along with the proposed multi-stage strategy is applied for damage detection. The termination criteria of the optimization stages are controlled by the desired tolerance of the objective function as well as of the maximum number of iterations. This kind of termination criterion will ensure both the accuracy and cost-efficiency of the problem.
In this method, the first stage is terminated after the objective function reaches the desired tolerance. This confirms that the original solution will remain in the search space in the next stage. The design variables which have very less value are considered as undamaged elements, and their damage index is set as zero. These elements with zero damage index will not consider as a design variable for the next stage. Then, a new stage of the optimization problem starts with a reduced number of damage variables. The stage terminates when it meets the stage termination criteria or problem convergence criteria. The process repeats until it meets the convergence criteria of the problem.
In the present problem damage indices of the structural elements are the design variables. The structural elements which are having damage indices less than 0.01 (1% damage) will be considered as undamaged elements with a zero damage index value. Thus, structural elements which are less susceptible to damage are removed from the search space of the next stage. This reduction in search space will increase the accuracy of the problem and reduce computational time. Different steps are involved in this method are described as follows:
The parameters of the problem as well as PSOGSA parameters are initialized. The total number of elements (t) is considered as the design variables for the optimization problem defined by Equation (21).
PSOGSA is utilized to minimize the optimization problem.
The optimization algorithm terminates when it reaches the first stage termination criteria and the result obtained from the optimization problem gives an initial solution
for the damage detection problem.
A very low value (µ) of damage index is set to quantify the healthy elements. The elements which are having damage index less than this value (µ) are considered as healthy elements. In the present problem, µ value is set as 0.01, i.e. the elements with damage less than 1% or damage index 0.01 are considered healthy elements.
Total number of the healthy elements (v) identified from the previous solution. In the next stage, the healthy element’s damage index is set as zero. The total number of design variables will reduce to (t−v).
Again solve the optimization problem defined by Equation (21) with the reduced number of design variables until the stage termination criteria are reached. The new solution achieved by the optimization algorithm can be represented by
Check the convergence criteria of the problem. If satisfies go to step 8. Otherwise, go to step 4.
Save the final optimal solution and exit.
The steps from 1 to 8 are described by a flowchart, shown in Figure .
Figure 1. Flowchart of the proposed multi-stage optimization-based method for damage identification.
The first stage terminates when the objective function reaches 1e-2. In addition, the termination criteria of each stage are either the maximum number of iteration which is fixed as 75, or there is no relative change in the objective function for consecutive 50 iterations. And, the final stopping criteria or convergence criteria for the present multi-stage strategy is either the objective function reaches 1e-7 [Citation53] or no relative change in the objective function for two consecutive stages.
7. Numerical examples
In this section, three numerical examples are studied for damage detection. A comparison study among PSO, GSA, TLBO, and PSOGSA has been performed. PSO and GSA are selected for comparison because these are the parental algorithms of PSOGSA. TLBO is selected for the present study because it performs the best among the well-established 10 metaheuristic algorithms applied for damage detection of large-scale spatial truss studied by Mishra et al. (Citation2020) [Citation68]. In addition, TLBO is very simple in mathematical formulation and does not depend on any intrinsic parameter [Citation68]. Besides, Dinh-Cong et al. [Citation53] also reported that the performance of TLBO is the best among the five well-established algorithms for damage detection of truss structures. Hence, TLBO is established as one of the most effective algorithms for damage detection of structures, and it is assumed that the result comparison of the proposed algorithm with TLBO will be sufficient to prove the efficacy of the proposed algorithm. In the present study, all the damage scenarios of the three examples are studied without noise and with noise. Ten independent runs are made for each damage scenario to take care of the stochastic nature of the optimization algorithm. A comparison study among the well-established model reduction methods is performed. These model reduction methods are Guyan method [Citation61], second-order approximation of Neumann series expansion-based model reduction (NSEMR-II) [Citation53,Citation69,Citation70], improved reduced system (IRS) [Citation71], and iterated improved reduction system (IIRS) [Citation56,Citation60].
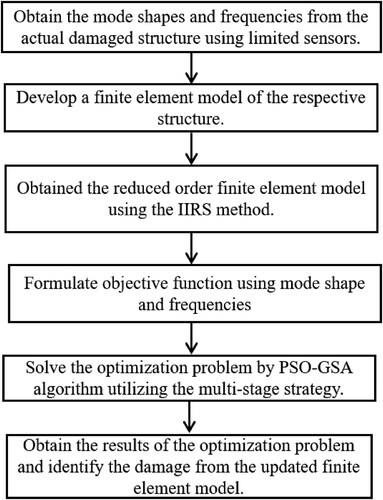
The steps followed in the present study for damage identification are shown in Figure .
Figure 2. Flowchart for damage identification using incomplete modal data and multi-stage PSOGSA.
7.1. An L-shaped two-clamped supported plate
An L-shaped two edges clamped supported thin plate is selected from Vaez and Fallah [Citation32]. The finite element model of this thin plate consists of 27 nodes and 32 CST elements. The problem is described in Figure . The physical properties of the plate are kept as same as mentioned by Vaez and Fallah [Citation32], which is given in Table .
Figure 3. 32 CST elements thin plate structure.
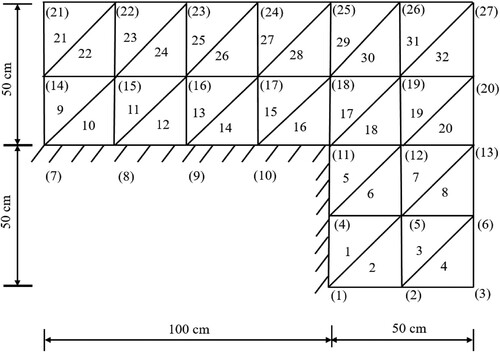
Table 1. Physical properties of the thin plates.
For this study, three different damage scenarios with a different number of elements and severity are investigated, which are shown in Table .
Table 2. Damage scenarios induced in 32 CST element.
The capability of the proposed algorithm is investigated for identification damage in the thin plate with incomplete modal data. It is assumed that measurements are obtained from only nine sensors placed at nodes 5, 12, 15, 17, 19, 21, 23, 25, and 27. The original finite element model consists of a total number of 54 degrees of freedom (DOFs), but the information is available only from the sensor installed nine nodes and corresponding 18 DOFs. So, only 33.33% of total nodal information will be used in the present study to identify the damage. The first five frequencies of the full-scale FE model and the frequencies obtained from the reduced model using the Guyan method, IRS, NSEMR-II and IIRS method are compared in Table . Guyan method produces the highest error (13.958%) for frequency calculation. However, the IIRS method shows zero error up to three decimal places for calculating the first five frequencies. It is clear from the result that IIRS produces a better result than the other methods. The correlation between the mode shape of the full-scale model and the mode shape
obtained by the IIRS is represented by modal assurance criteria (MAC), which is shown in Figure .
Figure 4. MAC value obtained from mode shapes of the full model and reduced model (IIRS).
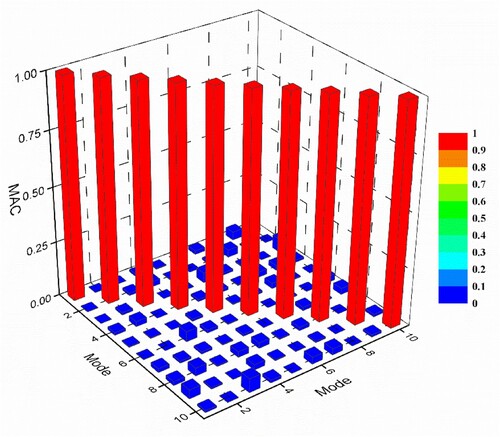
Table 3. The comparison of natural frequencies (rad/s) of the 32 CST elements thin plate obtained by different methods.
It is observed from Figure that the first 10 modes are well correlated, as the diagonal terms of the MAC matrix are close to one, and off-diagonal terms are close to zero. MAC value also confirms that the sensors are properly placed.
7.1.1. Identification of damage using incomplete modal data
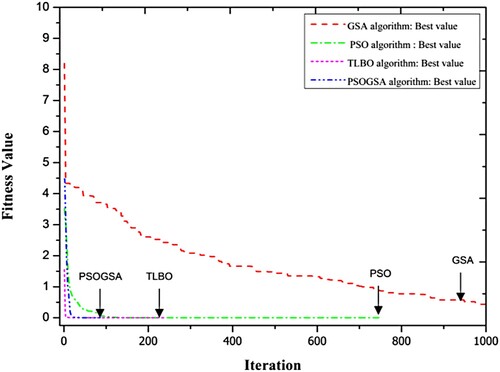
In this section PSO, GSA, TLBO, and PSOGSA are used to locate the damage and quantify the damage severity. The first five natural frequencies and the first five mode shapes, which are obtained from the reduced model using IIRS method, are used in the objective function for the damage identification of the three scenarios. Aforesaid algorithms are used to minimize the objective function to locate the damaged element and quantify the same. At first, PSOGSA, PSO, GSA, and TLBO are applied to detect the damage in a single stage without any noise. The convergence rate comparison among these four algorithms for a sample run of scenario I without noise is shown in Figure . The convergence rate of the PSOGSA is much faster than PSO and GSA. Though the initial convergence rate of the TLBO is faster than PSOGSA, but TLBO becomes slow with the increment of the iterations. PSOGSA, TLBO, and PSO converged to the tolerance limit with 86, 242, and 635 numbers of iteration, respectively. The objective function value for GSA is far away from the tolerance limit within the maximum iteration number, which is set to 1000. It is observed that GSA performs considerably poor in all the scenarios of the current damage identification problem, so the results obtained by GSA are further not shown in the current study.
Figure 5. Convergence study of PSOGSA, TLBO, PSO, and GSA for scenario I of 32 CST elements thin plate without noise.
The performance of the algorithm is compared with PSO and TLBO. The detailed results obtained by three algorithms are shown in Tables and .
Table 4. The results of assessment of damage in 32 CST elements thin plate without noise for single-stage.
Table 5. The results of assessment of damage in 32 CST elements thin plate without noise for multi-stage.
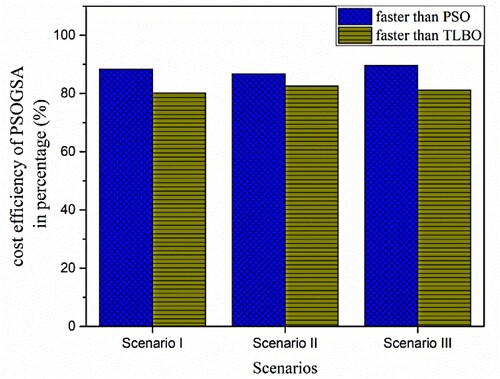
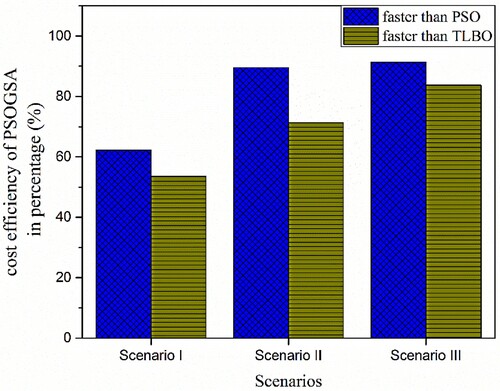
Table shows a comparison of the results of single-stage PSO, TLBO, and PSOGSA. It can be seen that the computational cost of PSOGSA is the least among them. Particularly, for scenario I all the algorithms determine the damage index with no error. PSOGSA takes 88.36% and 80.13% less average number of structural analyses (NSA) than PSO and TLBO, respectively. For scenario II, the mean errors between the identified average damage index and the actual damage index obtained by PSO, TLBO, and PSOGSA are 0.89%, 0.04%, and 0.0%, respectively. While PSOGSA is 86.75%, and 82.56% cost efficient than PSO and TLBO, respectively. For scenario III the mean error between obtained and average damage index and the actual damage index by PSO, TLBO, and PSOGSA are 8.27%, 0.88%, and 0.66%, respectively. PSOGSA takes 89.63% and 81.14% less computational cost than PSO and TLBO. So, PSOGSA predicts more accurately the damage extent than PSO and TLBO with less average NSA. The cost efficiency of PSOGSA compared to PSO and TLBO is shown in Figure .
Figure 6. Computational cost efficiency of the single-stage PSOGSA in comparison with the single-stage PSO and TLBO for 32 CST elements thin plate without noise.
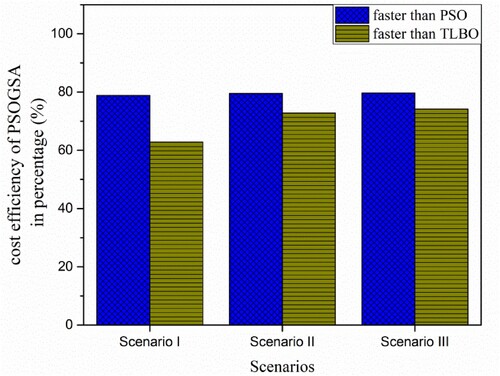
Next, all three algorithms are applied for damage detection of previous scenarios with a proposed multi-stage strategy. The statistical results of the damage assessments without noise for the multi-stage strategy utilizing PSO, TLBO, and PSOGSA are shown in Table . Specifically, all three algorithms precisely detect the damage location and identify damage extent accurately for scenario I. It can be observed that the multi-stage PSO, TLBO, and PSOGSA take 69.41%, 70.25%, and 40.04% less average NSA than the single-stage PSO, TLBO, and PSOGSA, respectively. In addition, the multi-stage PSO and TLBO take 79.12% and 63.36% more average NSA than the multi-stage PSOGSA. Similar improvements can be noticed in scenario II and scenario III. The cost efficiency of the multi-stage PSOGSA compared to multi-stage PSO and TLBO is shown in Figure .
Figure 7. Computational cost efficiency of the multi-stage PSOGSA in comparison with the multi-stage PSO and TLBO for 32 CST elements thin plate without noise.
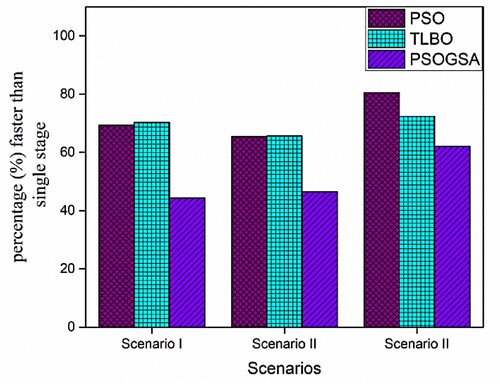
The cost efficiency improvement of all the algorithms due to the multi-stage strategy is shown in Figure . It is observed that the cost efficiency of all the algorithms PSO, TLBO, and PSOGSA are improved in multi-stage. PSO shows the most improvement among all. Besides, the cost efficiency of TLBO, PSOGSA also improved with the multi-stage strategy.
Figure 8. Computational cost efficiency comparison between the single-stage and the multi-stage of PSO, TLBO, and PSOGSA for 32 CST elements thin plate without noise.
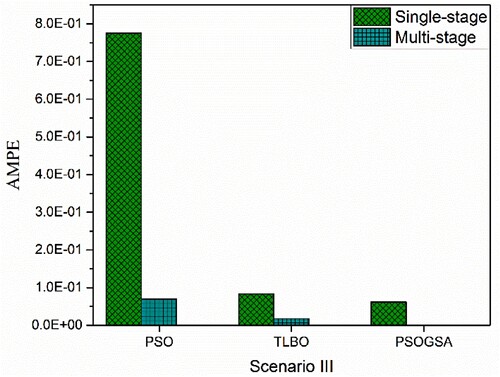
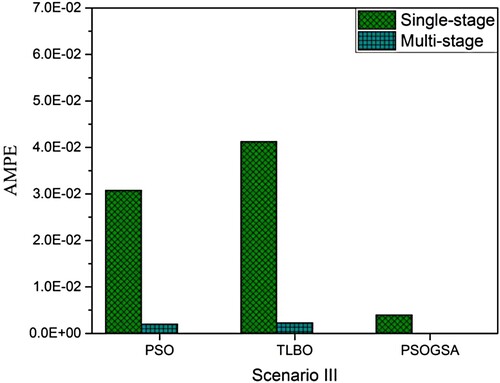
Absolute mean percentage error (AMPE) for scenario I is zero for all the algorithms employing both single and multi-stage strategy. The AMPE comparison for all the algorithms in the single-stage and multi-stage for scenario II and scenario III is shown in Figures and .
Figure 9. Absolute mean percentage error comparison among PSOGSA, PSO, and TLBO for scenario II of 32 CST elements thin plate without noise.
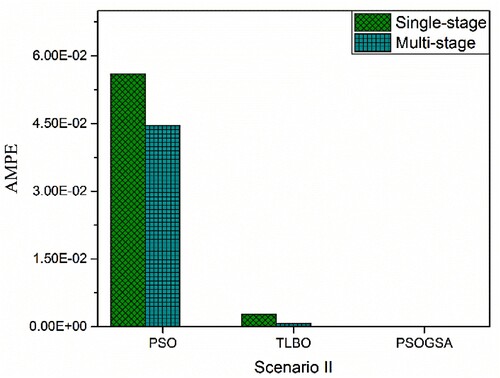
Figure 10. Absolute mean percentage error comparison among PSOGSA, PSO, and TLBO for scenario III of 32 CST elements thin plate without noise.
It is observed from Tables and that PSOGSA is performing better than other algorithms without noise. So, only the performance of the single-stage and multi-stage PSOGSA algorithm with noise is compared in Table . It is observed that the single-stage PSOGSA predicts one false damage with very little severity of damage in both scenario I and scenario II. whereas the multi-stage PSOGSA successfully avoids false damage detection, and consequently, the mean error of damage severity prediction is reduced for the multi-stage damage detection. In addition, the computational cost is considerably less in the case of multi-stage damage detection. However, it can be noticed that the objective function mean value is lesser in case of the single-stage PSOGSA. In scenario III both the single-stage and multi-stage can locate the damage with an acceptable mean error in quantifying the damage severity. But the single-stage is utilizing 36.27% more average NSA than the multi-stage. The results obtained by the single-stage and multistage PSOGSA without and with noise is shown in Figures , , and for scenario I, scenario II, and scenario III, respectively. The AMPE comparison between the single-stage and multi-stage PSOGSA with noise is shown in Figure . It is clearly observed that PSOGSA with the multi-stage strategy is performing better than the single-stage in regard of computational cost as well as accuracy with and without noise.
Figure 11. The obtained results of damage prediction for 32 CST elements thin plate using the single-stage and multi-stage PSOGSA considering noise free and noisy data for damage scenario I.
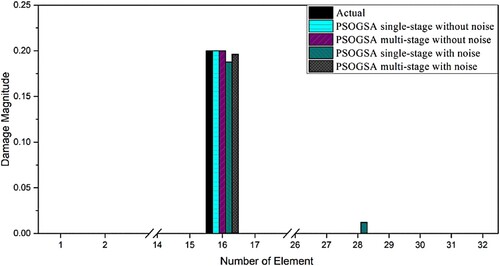
Figure 12. The obtained results of damage prediction for 32 CST elements thin plate using the single-stage and multi-stage PSOGSA considering noise free and noisy data for damage scenario II.
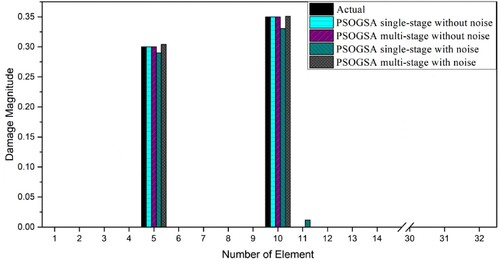
Figure 13. The obtained results of damage prediction for 32 CST elements thin plate using the single-stage and multi-stage PSOGSA considering noise free and noisy data for damage scenario III.
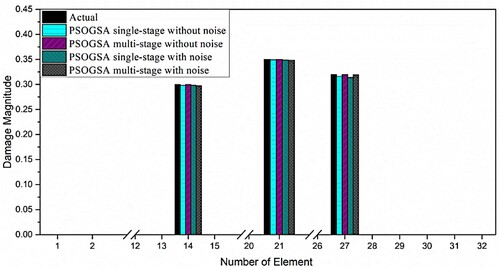
Figure 14. Absolute mean percentage error comparison between the single-stage and multi-stage PSOGSA of 32 CST elements thin plate with noise.
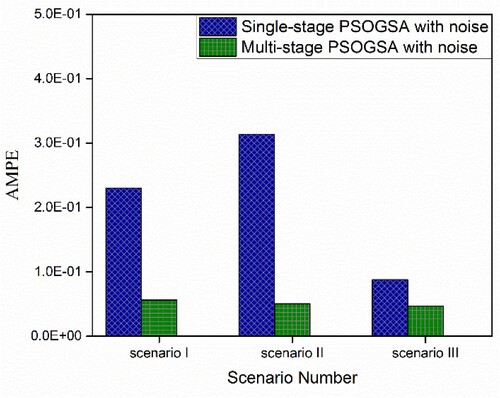
Table 6. The results of damage assessment in 32 CST elements thin plate with noise for single stage and multistage with noise.
A typical run of scenario I obtained by the single-stage PSOGSA and the multi-stage PSOGSA without noise and with noise is shown in Table . In the first stage of the multi-stage damage detection, the number of design variables is the same as the total number of elements of the structure. The first stage optimization algorithm stops when the objective function reaches the termination criteria of the first stage, and an initial solution is obtained. In the initial solution, the design variables whose values are less than 0.01 (1% damage) are considered healthy elements. These elements are removed from the search space of the optimization algorithm considering their damage indices as zero. So in the second stage, optimization algorithms are again applied to reduce the objective function with only four design variables. The algorithm terminates as the value of the objective function reaches 10e-7, which is the termination criteria of the problem. Similarly, for the single-stage without noise, the algorithm stops when the objective function value reaches the termination value. It is observed that the accuracy of the results for both the single-stage and multi-stage without noise is the same, but the single-stage takes much more average NSA than the multi-stage. In the case of noisy data, the first stage of the multi-stage algorithm terminates when it reaches the first stage of stopping criteria. Next, only four elements are identified to be the most damage-prone elements and considered as the damage variable for the following stage. The second stage terminates when it reaches the maximum number of iterations per stage. Then only one element is selected as a damage variable for the next stage. The third stage also terminates after attaining the maximum number of iterations per stage. However, the relative change of the objective function value in the second and third stage is zero. This means the algorithm cannot improve the damage prediction results further. So, it satisfies another stopping criterion of the algorithm, which is described earlier. Besides, in the single-stage, PSOGSA is terminated when there is no relative change in the objective function in consecutive 50 iterations. It is assumed that this is the best result that this algorithm can predict with noise.
Table 7. Damage variable identified in single-stage PSOGSA and multi-stage PSOGSA (MSPSOGSA) for the scenario I of the 32 CST element plate with noise free and noisy data.
7.2. A rectangular cantilever plate
In the second example, a thin plate consisting of 40 CST elements is considered, as shown in Figure . The physical properties are the same as example 1, which is shown in Table . The finite model consists of 30 nodes and 60 DOFs. In this example, the damage scenarios which are considered are shown in Table .
Figure 15. 40 CST elements thin plate structure.
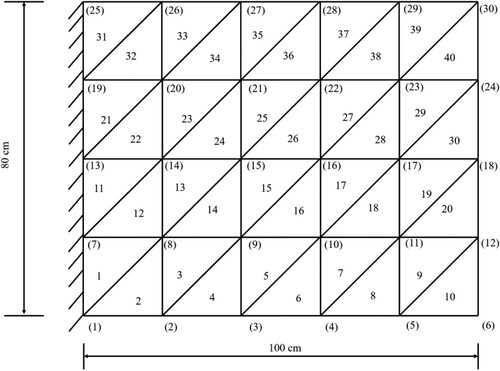
Table 8. Three damage scenarios induced in 40 CST elements.
Only 10 sensors are installed at nodes 4, 6, 8, 10, 15, 17, 20, 22, 27, and 29. So, the data only from 20 numbers of DOFs can be measured from the installed sensors, and the rest of the DOFs are remained unmeasured. So, the finite element model of this thin plate is reduced to a model with 20 DOFs. This reduced model has only 33.33% of DOFs compare to the full-scale FE model. The comparison of the initial six frequencies obtained by the full FE model and reduced model employing the Guyan technique, IRS, NSEMR-II, and IIRS method are shown in Table . It is observed that the frequencies obtained from the reduced model utilizing the IIRS model have zero error up to three decimal places. A correlation between the mode shape vector obtained by the IIRS method utilizing the reduced model and mode shapes obtained from the full-scale FE model is achieved using MAC values, which is shown in Figure . It is observed that the values of the diagonal terms are near to 1, whereas the other terms are close to zero. This result ensures that these two sets of vectors are well correlated.
Figure 16. MAC value obtained from mode shapes of the full model and reduced model (IIRS).
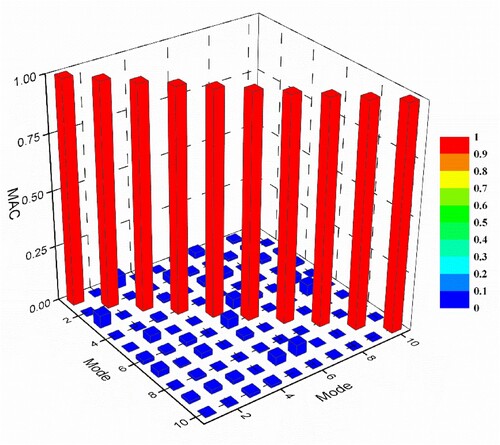
Table 9. The comparison of natural frequencies (rad/s) of the 40 CST elements thin plate obtained by different methods.
7.2.1. Identification of damage using incomplete modal data
In this section PSO, TLBO, and PSOGSA are applied to identify the three different damage scenarios, and the results are shown in Table . The first 10 natural frequencies and mode shapes are utilized in the objective function to identify the damage. Aforesaid algorithms are used to minimize the objective function to locate the damaged element and quantify the same. At first, PSOGSA, PSO, GSA, and TLBO are applied to detect the damage in a single stage without any noise. The convergence rate comparison among the four algorithms for a sample run of scenario II without noise is shown in Figure . The convergence rate of the PSOGSA is much faster than PSO and GSA. It is observed that the initial convergence rate of the TLBO is faster than PSOGSA, but with the increment of the iterations, TLBO becomes slow. PSOGSA, TLBO, and PSO converged to the tolerance limit with 150, 293, and 1373 numbers of iteration, respectively. The objective function value for GSA is far away from the tolerance limit within the maximum iteration number, which is fixed as 1750. It is observed that GSA performs considerably poor in all the scenarios of the current damage identification problem, so the results obtained by GSA are further not shown in the current study.
Figure 17. Convergence study of PSOGSA, TLBO, PSO, and GSA for scenario II of 40 CST elements thin plate without noise.
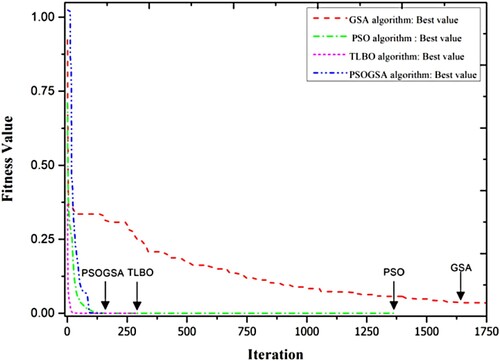
Table 10. The results of damage identification of 40 CST element thin plate without noise for single stage.
The results of the single-stage PSO, TLBO, and PSOGSA are shown and compared in Table . All the algorithms can identify the damage for scenario I with acceptable accuracy. However, it is observed that PSOGSA is the most cost-effective among these three algorithms as it takes the least average NSA. PSOGSA takes 62.24% and 53.47% less average NSA than PSO and TLBO. For all scenarios, PSOGSA outperforms other algorithms by average NSA and AMPE. The cost efficiency of PSOGSA in comparison with PSO and TLBO is shown in Figure . It is observed that PSOGSA cost efficiency improves than the other two algorithms with the increment damage member numbers.
Figure 18. Computational cost efficiency of the single-stage PSOGSA in comparison with the single-stage PSO and TLBO for 40 CST elements thin plate without noise.
The multi-stage results for the three algorithms without noise are shown in Table . It can be observed that multi-stage strategy helps all the algorithms to reduce their average NSA and AMPE for damage detection for all scenarios. For example, in scenario II the values of AMPE are 0.03%,0.02%, and 0.0% for PSO, TLBO, and PSOGSA, respectively. PSOGSA is faster than PSO and TLBO for scenario II 79.34% and 76.67%, respectively. The cost efficiency of the multi-stage PSOGSA compared to the multi-stage PSO and TLBO is shown in Figure .
Figure 19. Computational cost efficiency of the multi-stage PSOGSA in comparison with the multi-stage PSO and TLBO for 40 CST elements thin plate without noise.
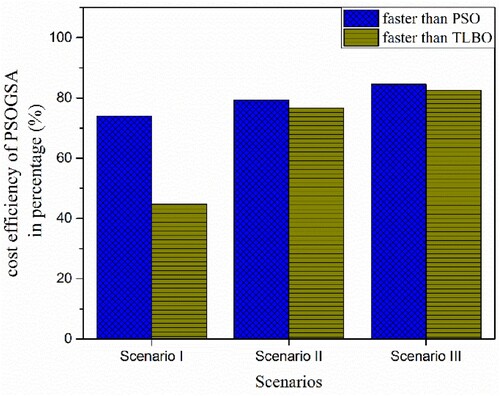
Table 11. The statistical results of damage identification of 40 CST element thin plate without noise for multi-stage.
The improvement of computational cost due to the multi-stage is shown in Figure . It is shown that the cost efficiency of all the algorithms PSO, TLBO, and PSOGSA are improved with the multi-stage strategy. The AMPE comparison for all the algorithms in both the single-stage and multi-stage for scenario I, scenario II, and scenario III are shown in Figures , , and , respectively. PSO shows the most improvement regarding computational cost and AMPE among all algorithms utilizing multi-stage strategy. Besides, the performance of TLBO and PSOGSA also improved with the multi-stage.
Figure 20. Computational cost efficiency comparison between the single-stage and multi-stage for 40 CST elements thin plate without noise.
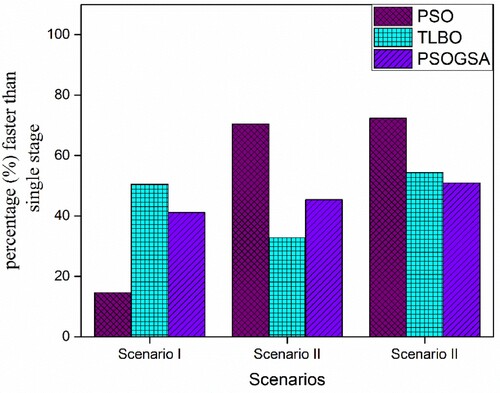
Figure 21. Absolute mean percentage error comparison among PSOGSA, PSO, and TLBO for scenario I of 40 CST elements thin plate without noise.
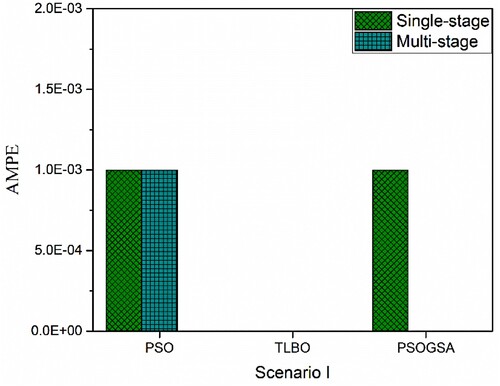
Figure 22. Absolute mean percentage error comparison among PSOGSA, PSO, and TLBO for scenario II of 40 CST elements thin plate without noise.
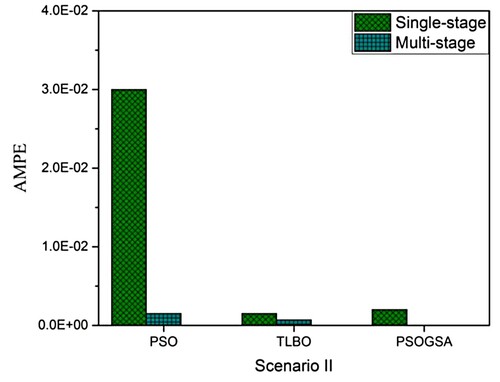
Figure 23. Absolute mean percentage error comparison among PSOGSA, PSO, and TLBO for scenario III of 40 CST elements thin plate without noise.
It is observed from Tables and that PSOGSA is performing better than other algorithms without noise. So, only the performance of the single-stage and multi-stage PSOGSA algorithm with noise is compared in Table . It is observed that the single-stage PSOGSA with noise predicts one, two, and four false damaged elements with very less severity of damage in scenario I, scenario II, and scenario III, respectively. Whereas the multi-stage PSOGSA successfully avoids false damage detection, and consequently, AMPE is reduced for the multi-stage damage detection. The computational cost is considerably less in the case of multi-stage damage detection. However, it is also noticed that the objective function mean values in the case of the multi-stage are lesser than the single-stage PSOGSA. In all the scenarios, the single-stage and multi-stage both can locate the damage with an acceptable mean error in quantifying the damage severity.
Table 12. The statistical results of damage assessment in 40 CST elements thin plate with noise for single stage and multistage with noise.
The results of damage detection for 40 CST elements thin plate obtained by single-stage and multi-stage PSOGSA without and with noise are shown in Figures , and for scenario I, scenario II, and scenario III, respectively. The AMPE comparison between the single-stage and multi-stage PSOGSA with noise is shown in Figure . It is observed that the multi-stage PSOGSA is performing better than the single-stage PSOGSA in regard to computational cost as well as accuracy with and without noise.
Figure 24. The obtained results of damage prediction for 40 CST elements thin plate using the single-stage and multi-stage PSOGSA considering noise free and noisy data for damage scenario I.
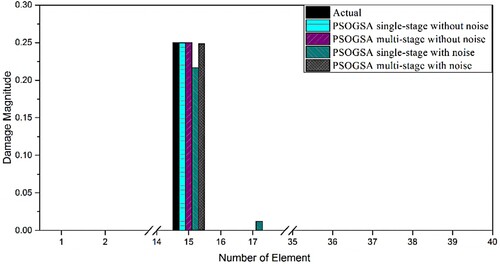
Figure 25. The obtained results of damage prediction for 40 CST elements thin plate using the single-stage and multi-stage PSOGSA considering noise free and noisy data for damage scenario II.
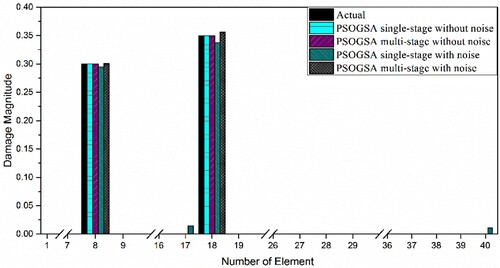
Figure 26. The obtained results of damage prediction for 40 CST elements thin plate using the single-stage and multi-stage PSOGSA considering noise free and noisy data for damage scenario III.
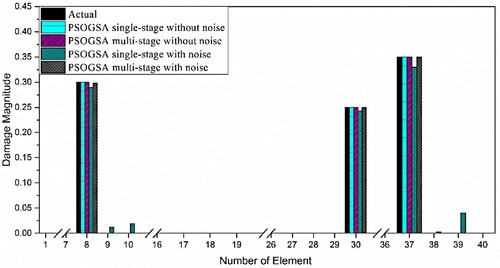
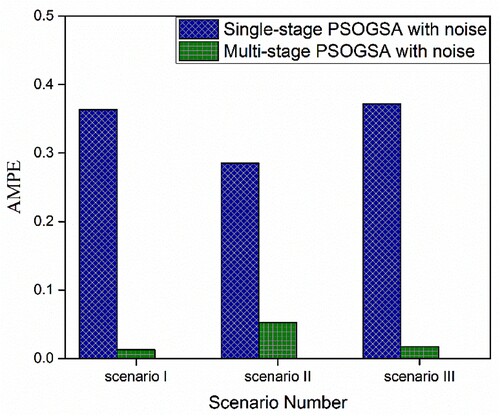
Figure 27. Absolute mean percentage error comparison between the single-stage and multi-stage PSOGSA of 40 CST elements thin plate with noise.
7.3. Both side fixed plate
In the third example, a thin plate consisting of 84 CST elements is considered, as shown in Figure . The physical properties of the plate are shown in Table . The finite model consists of 56 nodes and 112 DOFs. In this example, the damage scenarios which are considered are shown in Table .
Figure 28. 84 CST elements thin plate structure.
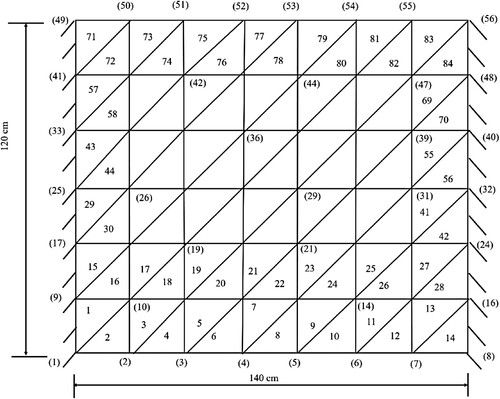
Table 13. Three damage scenarios induced in 84 CST elements.
Only 11 sensors are installed at nodes 10, 14, 19, 21, 26, 29, 36, 42, 47, 51, and 55. This reduced model has only 19.64% of DOFs in compariosn to the full-scale FE model. The initial six frequencies obtained by the full FE model and reduced model employing the Guyan technique, IRS, NSEMR-II, and IIRS method are shown in Table . IIRS predicts frequencies with negligible error and its performance is better than the other methods. A correlation between the mode shape vector obtained by the IIRS method utilizing the reduced model and mode shapes obtained from the full-scale FE model is achieved using MAC values, which is shown in Figure . This result ensures that these two sets of vectors are well correlated.
Figure 29. MAC value obtained from mode shapes of the full model and reduced model (IIRS).
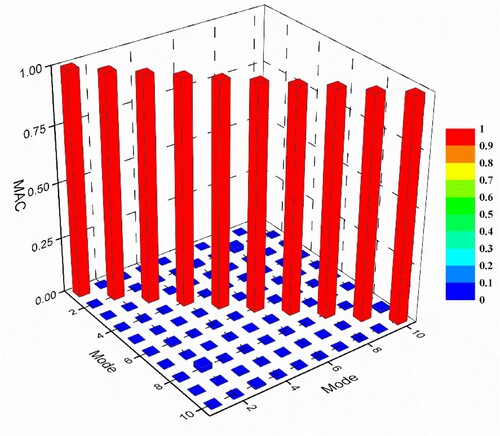
Table 14. The comparison of natural frequencies (rad/s) of the 84 CST elements thin plate obtained by different methods.
7.3.1. Identification of damage using incomplete modal data
It is observed from the previous examples that PSOGSA with multi-stage strategy produce the best results for damage detection of thin pate structure modelled with CST elements. So, in this example, only PSOGSA with multi-stage strategy is studied for damage detection of a thin plate with higher number of CST element (84 elements). In this study, first 12 frequencies and mode shapes have been used for damage identification. The results of damage detection with and without noise are shown in Table .
Table 15. The results of damage assessment in 84 CST elements thin plate with noise for multistage with and without noise.
It is observed from Table that PSOGSA with multi-stage strategy can identify damage of 84 CST elements thin plate structure without any false damage alarm. Particularly, without noise data PSOGSA can cost-efficiently identify the damage for all scenarios with zero percentage of error. Whereas, with noise PSOGSA successfully avoids false damage identification and a maximum of 0.077 AMPE can be noticed in all scenarios.
8. Conclusions
In this paper, an efficient and novel multi-stage strategy is incorporated with a hybrid PSOGSA for damage detection in thin plate-like structures. The structural damage detection problem is formulated as a constrained optimization problem, where the objective function is developed using incomplete modal data. Then the objective function is minimized with hybrid PSOGSA using a novel and robust multi-stage strategy. This hybrid PSOGSA performed better than the other three established optimization algorithms for the damage detection of the thin plate structure with and without noisy incomplete modal data. In the proposed novel multi-stage strategy, the damage variables with low values of damage index (healthy elements) are eliminated in successive stages, and the dimension of the search space gets reduced consequently in the following stages. The stage termination criteria are set by a low-value tolerance limit of the objective function instead of maximum iteration, which makes this multi-stage strategy independent of the algorithm, cost-efficient, and helps to avoid false damage detection. Besides, to create a real-life scenario where the number of sensors installed on the structure are limited, IIRS method is applied for the model reduction technique. The efficiency of the proposed method is verified through three numerical examples comprising 32- CST element, 40- CST element, and 84- CST element thin plate with different damage cases. Some conclusions are summarized as follows
IIRS performed well to identify frequency and mode shapes of the structure with limited numbers of sensors installed on thin plates.
The present PSOGSA is performing better than the other three well-established algorithms (PSO, GSA, and TLBO) for damage identification. Besides, PSOGSA has taken the least number of average number of structural analyses among the three algorithms, which shows that PSOGSA is the most computational cost efficient algorithm among these three.
The proposed multi-stage strategy improves the accuracy of all the three algorithms, as well as it helps to reduce the computational cost significantly.
Disclosure statement
No potential conflict of interest was reported by the authors.
References
- Friswell MI. Damage identification using inverse methods. Philos Trans R Soc A Math Phys Eng Sci. 2007;365:393–410.
- Liu H, Li Z. An improved generalized flexibility matrix approach for structural damage detection. Inverse Probl Sci Eng. 2020;28:877–893.
- Dahak M, Touat N, Kharoubi M. Damage detection in beam through change in measured frequency and undamaged curvature mode shape. Inverse Probl Sci Eng. 2019;27:89–114.
- Pedram M, Esfandiari A, Khedmati MR. Frequency domain damage detection of plate and shell structures by finite element model updating. Inverse Probl Sci Eng. 2018;26:100–132.
- Perera R, Torres R. Structural damage detection via modal data with genetic algorithms. J Struct Eng. 2006;132:1491–1501.
- Alexandrino PdS, Gomes GF, Cunha SS. A robust optimization for damage detection using multiobjective genetic algorithm, neural network and fuzzy decision making. Inverse Probl Sci Eng. 2020;28:21–46.
- Mohan SC, Maiti DK, Maity D. Structural damage assessment using FRF employing particle swarm optimization. Appl Math Comput. 2013;219:10387–10400.
- Wei Z, Liu J, Lu Z. Structural damage detection using improved particle swarm optimization. Inverse Probl Sci Eng. 2018;26:792–810.
- Majumdar A, Maiti DK, Maity D. Damage assessment of truss structures from changes in natural frequencies using ant colony optimization. Appl Math Comput. 2012;218:9759–9772.
- Miguel LFF, Miguel LFF, João K, et al. Damage detection under ambient vibration by harmony search algorithm. Expert Syst Appl. 2012;39:9704–9714.
- Krishnanunni CG, Raj RS, Nandan D, et al. Sensitivity-based damage detection algorithm for structures using vibration data. J Civ Struct Heal Monit. 2019;9:137–151.
- Kaveh A, Maniat M. Damage detection based on MCSS and PSO using modal data. Smart Struct Syst. 2015;15:1253–1270.
- Kaveh A, Zolghadr A. An improved CSS for damage detection of truss structures using changes in natural frequencies and mode shapes. Adv Eng Softw. 2015;80:93–100.
- Ding ZH, Huang M, Lu ZR. Structural damage detection using artificial bee colony algorithm with hybrid search strategy. Swarm Evol Comput. 2016;28: 1–13.
- Ding Z, Yao R, Li J, et al. Structural damage identification based on modified artificial bee colony algorithm using modal data. Inverse Probl Sci Eng. 2018;26:422–442.
- Liu JK, Wei ZT, Lu ZR, et al. Structural damage identification using gravitational search algorithm. Struct Eng Mech. 2016;60:729–747.
- Nobahari M, Ghasemi MR, Shabakhty N. A novel heuristic search algorithm for optimization with application to structural damage identification. Smart Struct Syst. 2017;19:449–461.
- Kaveh A, Zolghadr A. Cyclical parthenogenesis algorithm for guided modal strain energy based structural damage detection. Appl Soft Comput J. 2017;57:250–264.
- Huang JL, Lu ZR. BB-BC optimization algorithm for structural damage detection using measured acceleration responses. Struct Eng Mech. 2017;3:353–360.
- Kaveh A, Zolghadr A. Guided modal strain energy-based approach for structural damage identification using tug-of-war optimization algorithm. J Comput Civ Eng. 2017;31:1–12.
- Fallahian S, Joghataie A, Kazemi MT. Structural damage detection using time domain responses and teaching-learning-based optimization (TLBO) algorithm. Sci Iran. 2018;25:3088–3100.
- Ghannadi P, Kourehli SS. Structural damage detection based on MAC flexibility and frequency using moth – flame algorithm. Struct Eng Mech. 2019;6:649–659.
- Ghannadi P, Kourehli SS, Noori M, et al. Efficiency of grey wolf optimization algorithm for damage detection of skeletal structures via expanded mode shapes. Adv Struct Eng. 2020;23:2850–2865.
- Ghannadi P, Kourehli SS. Model updating and damage detection in multi-story shear frames using salp swarm algorithm. Earthquakes Struct. 2019;17:63–73.
- Ghannadi P, Kourehli SS. Multiverse optimizer for structural damage detection: numerical study and experimental validation. Struct Des Tall Spec Build. 2020;29:1–27.
- Talbi EG. A taxonomy of hybrid metaheuristics. J Heuristics. 2002;8:541–564.
- Begambre O, Laier JE. A hybrid particle swarm optimization – simplex algorithm (PSOS) for structural damage identification. Adv Eng Softw J. 2009;40:883–891.
- Sandesh S, Shankar K. Application of a hybrid of particle swarm and genetic algorithm for structural damage detection. Inverse Probl Sci Eng. 2010;18:997–1021.
- Baghmisheh MTV, Peimani M, Homayoun M. A hybrid particle swarm – Nelder–Mead optimization method for crack detection in cantilever beams. Appl Soft Comput J. 2012;12:2217–2226.
- Qian X, Cao M, Su Z, et al. A hybrid particle swarm optimization (PSO)-simplex algorithm for damage identification of delaminated beams. Math Probl Eng. 2012;2012:1–12.
- Pan C-D, Yu L, Chen Z-P, et al. A hybrid self-adaptive firefly-nelder-mead algorithm for structural damage detection. Smart Struct Syst. 2016;17:957–980.
- Vaez SRH, Fallah N. Damage detection of thin plates using GA-PSO algorithm based on modal data. Arab J Sci Eng. 2017;42:1251–1263.
- Kaveh A, Dadras A. Structural damage identification using an enhanced thermal exchange optimization algorithm. Eng Optim. 2018;50:430–451.
- Moezi SA, Zakeri E, Zare A. Structural single and multiple crack detection in cantilever beams using a hybrid cuckoo-nelder-mead optimization method. Mech Syst Signal Process. 2018;99:805–831.
- Shahrouzi M, Sabzi AH. Damage detection of truss structures by hybrid immune system and teaching–learning-based optimization. Asian J Civ Eng. 2018;19:811–825.
- Huang M, Lei Y, Cheng S. Damage identification of bridge structure considering temperature variations based on particle swarm optimization – cuckoo search algorithm. Adv Struct Eng. 2019;22:3262–3276.
- Chen C, Yu L. A hybrid ant lion optimizer with improved Nelder–Mead algorithm for structural damage detection by improving weighted trace lasso regularization. Adv Struct Eng. 2020;23:468–484.
- Mirjalili S, Zaiton S, Hashim M. A new hybrid PSOGSA algorithm for function optimization. IEEE Int Conf Comput Inf Appl (ICCIA 2010). 2010: 374–377. IEEE.
- Chutani S, Singh J. Use of modified hybrid PSOGSA for optimum design of RC frame. J Chinese Inst Eng. 2018;41(4):342–352.
- Jayaprakasam S, Rahim SKA, Leow CY. PSOGSA-Explore: a new hybrid metaheuristic approach for beampattern optimization in collaborative beamforming. Appl Soft Comput J. 2015;30:229–237.
- Jiang S, Ji Z, Shen Y. A novel hybrid particle swarm optimization and gravitational search algorithm for solving economic emission load dispatch problems with various practical constraints. Int J Electr Power Energy Syst. 2014;55:628–644.
- Seyedpoor SM. Structural damage detection using a multi-stage particle swarm optimization. Adv Struct Eng. 2011;14:533–549.
- Shirazi MRN, Mollamahmoudi H, Seyedpoor SM. Structural damage identification using an adaptive multi-stage optimization method based on a modified particle swarm algorithm. J Optim Theory Appl. 2014;160:1009–1019.
- Dinh-Cong D, Vo-Duy T, Ho-Huu V, et al. An efficient multi-stage optimization approach for damage detection in plate structures. Adv Eng Softw. 2017;112:76–87.
- Das S, Dhang N. Structural damage identification of truss structures using self-controlled multi-stage particle swarm optimization. Smart Struct Syst. 2020;25:345–368.
- Cawley P, Adams RD. The location of defects in structures from measurements of natural frequencies. J Strain Anal Eng Des. 1979;14:49–57.
- Nicknam A, Hosseini MH. Structural damage localization and evaluation based on modal data via a new evolutionary algorithm. Arch Appl Mech. 2012;82:191–203.
- Guedria NB. An accelerated differential evolution algorithm with new operators for multi-damage detection in plate-like structures. Appl Math Model. 2020;80:366–383.
- West ML, Milman M, Kissil A. Mode shape expansion techniques for prediction: experimental evaluation marie. Exp Eval AIAA J. 1996;34:821–829.
- Ghannadi P, Kourehli SS. Data-driven method of damage detection using sparse sensors installation by SEREPa. J Civ Struct Heal Monit. 2019;9:459–475.
- Ghannadi P, Kourehli SS. An effective method for damage assessment based on limited measured locations in skeletal structures. Adv Struct Eng. 2021;24:183–195.
- Kourehli SS. Prediction of unmeasured mode shapes and structural damage detection using least squares support vector machine. Struct Monit Maint. 2018;5:379–390.
- Dinh-cong D, Vo-duy T, Nguyen-thoi T. Damage assessment in truss structures with limited sensors using a two-stage method and model reduction. Appl Soft Comput J. 2018;66:264–277.
- Kourehli SS, Amiri GG, Ghafory-Ashtiany M, et al. Structural damage detection based on incomplete modal data using pattern search algorithm. JVC/Journal Vib Control. 2013;19:821–833.
- Ghannadi P, Kourehli SS. Investigation of the accuracy of different finite element model reduction techniques. Struct Monit Maint. 2018;5:417–428.
- Das S, Dhang N. Damage identification of structures using incomplete mode shape and improved TLBO-PSO with self-controlled multi-stage strategy. Structures. 2022;35:1101–1124.
- Nanda B, Maity D, Maiti DK. Vibration based structural damage detection technique using particle swarm optimization with incremental swarm size. Int J Aeronaut Sp Sci. 2012;13:323–331.
- Das S, Mondal S, Guchhait S. Particle swarm optimization-based characterization technique of nonproportional viscous damping parameter of a cantilever beam. J Vib Control. 2021: 10775463211010526.
- Marwala T. Finite-element -model updating using computional intelligence techniques. London: Springer; 2010.
- Friswell MI, Garvey SD, Penny JET. Model reduction using dynamic and iterated irs techniques. J Sound Vib. 1995;186:311–323.
- Guyan RJ. Reduction of stiffness and mass matrices. AIAA J. 1965;3:380–380.
- Friswell MI, Garvey S, Penny JE. The convergence of the iterated IRS. J Sound Vib. 1998;211:123–132.
- Sastry CVS, Mahapatra DR, Gopalakrishnan S, et al. An iterative system equivalent reduction expansion process for extraction of high frequency response from reduced order finite element model q. Comput Methods Appl Mech Eng. 2003;192:1821–1840.
- Pastor M, Binda M, Harčarik T. Modal assurance criterion. Procedia Eng. 2012;48:543–548.
- Harrison C, Butler R. Locating delaminations in composite beams using introduction. AIAA J. 2001;39:1383–1389.
- Rashedi E, Nezamabadi-pour H, Saryazdi S. GSA : a gravitational search algorithm. Inf Sci. 2009;179(13):2232–2248.
- Kennedy J, Eberhart R. Particle swarm optimization. Proc IEEE Int Conf Neural Netw. 1995;4:1942–1948.
- Mishra M, Barman SK, Maity D, et al. Performance studies of 10 metaheuristic techniques in determination of damages for large-scale spatial trusses from changes in vibration responses. J Comput Civ Eng. 2020;34:04019052.
- Yang QW. Model reduction by Neumann series expansion. Appl Math Model . 2009;33:4431–4434.
- Kourehli SS. Damage identification of structures using second-order approximation of neumann series expansion. J Rehabil Civ Eng. 2020;8:81–91.
- O’callahan JC. A procedure for an improved reduced system (IRS) model. Proc 7th IMAC; Las Vegas, NV, 1989. 17–21.
Appendix I
Acronyms
The following acronyms are used in this paper:
| AMPE | = | absolute mean percentage error |
| Avg. Values | = | average values of damage index |
| CST | = | constant strain triangle |
| DOFs | = | degrees of freedom |
| EMA | = | experimental modal analysis |
| FE | = | finite element |
| GSA | = | gravitational search algorithm |
| IRS | = | improved reduction system |
| IIRS | = | iterated improved reduction system |
| MAC | = | modal assurance criteria |
| Max. error | = | maximum error in percentage |
| MSPSOGSA | = | multi-stage particle swarm optimization- gravitational search algorithm |
| NSA | = | number of structural analyses |
| NSEMR-II | = | second-order approximation of Neumann series expansion-based model reduction |
| OFV | = | objective function value |
| PSO | = | particle swarm optimization |
| PSOGSA | = | particle swarm optimization-gravitational search algorithm |
| RSA | = | Required structural analyses |
| Std Dev | = | standard deviation of damage index |
| TRSA | = | total required structural analyses |
| VBDD | = | vibration-based damage detection |