
 ?Mathematical formulae have been encoded as MathML and are displayed in this HTML version using MathJax in order to improve their display. Uncheck the box to turn MathJax off. This feature requires Javascript. Click on a formula to zoom.
Abstract
This research seeks to propose an innovative mathematical approach for measuring students’ performance in engineering education. The numerical solutions to this mathematical model and a thorough analysis are included in this study. Four categories – average candidates, poor candidates, below average candidates, and good candidates – are used to build the mathematical model that was built. To solve the differential system based on the migration rate and average student rate moving to weak and above average, the Adams numerical scheme is applied to the numerical results of the designed nonlinear mathematical model. Moreover, an artificial neural network is also applied to get the stochastic results of ANNs-LMB, also known as the Levenberg-Marquardt training algorithm. The ANNs-LMB procedures have been implemented with three samples of data scales using the authentication, testing and training, which are chosen as 75%, 15% and 10%, respectively. According to the findings, when the rate of students leaving engineering studies increased, good students performed better, and when the rate of students below average moved, it was due to an increase in the rate of migration above average, the performance of the good students was only impacted in this way. This research material can be used in different designs and models to improve the students’ performance.
1. Introduction
Education in the engineering field is a mixture of science, mathematics fundamentals, composition of the state-of-the-art and emerging technologies, which boost the applicability in industry, and research-oriented careers, and has several fundamental principles [Citation1]. Engineering education encompasses a variety of subjects, including science, mathematics, and new and state-of-the-art technologies that enhance industry applicability, research-oriented employment, and several fundamental concepts. Engineering education not only helps people build abilities that are not expected to fade quickly but also fosters new opportunities and dimensions in the learning process that last for a very long period. The majority of engineering education's discoveries are used to complete transdisciplinary projects’ necessary capabilities. Most of the findings of engineering education are applied to accomplish the essential capabilities in trans-disciplinary projects. The research community showed keen interest in using different aspects of engineering education in the industry, multi-criteria decision-making, consistency and priority options [Citation2,Citation3]. Some detailed discussions associated with the future of engineering education are discussed by [Citation4]. Project-based learning analysis in engineering education is carried out by [Citation5]. Many factors that can impact higher education were identified by [Citation6] while working on curriculum innovation in higher engineering education. A learning needs analysis is a methodical procedure that evaluates the abilities, behaviours, and knowledge required to carry out a job function well. Finding performance gaps in line with business requirements is the goal, and such gaps should be mapped to the appropriate training. The main goal of learning analytics is to maximize learning outcomes by gathering and utilizing data on students’ academic progress. This entails figuring out how much time each student devotes to their coursework and tracking their development over time. Numerous educators used various techniques to evaluate innovation, performance, and underperformance in engineering education. Innovation keeps its different stages like the generation of ideas, concept development/evaluation, product development and implementation. Some concepts are made deeper when someone goes through these stages by focusing on these stage performances through engineering education. In other words, innovation is the process that results from having critical talents. In their discussion of the role of innovation in engineering education [Citation7], demonstrated how innovation directly affects engineering education. Innovation impacts along with the influence of engineering education are described by [Citation8]. Innovation based on the economy and socio-economic sustainable development elevates and boosts technology and engineering education. The process of coming up with something new via imagination or originality is called creativity. Similar to an engineering education, one may encounter novel and challenging issues where ingenuity is essential. It produces innovations that build the ability to support the development of creative and useful cloud applications. Creativity can have a favourable effect on an engineer's capacity to generate new ideas and enhance current ones.
Innovation grounded in economic principles and socio-economic sustainable development propels and elevates technology and engineering education. Using imagination or inventiveness to create something new is the process of creativity. Much as in engineering school, one may encounter novel and challenging issues where ingenuity is essential. It develops breakthroughs that build the ability to support the production of creative and useful cloud apps. It creates innovations that establish the capacity to foster the creation of innovative and practical cloud applications. The ability of an engineer to produce new ideas and improve existing ones can be positively impacted by creativity. Being creative can help an engineer come up with new concepts and enhance ones that already exist. Providing technical competence, or imparting information and skills, is a crucial if not the most crucial element for all of our engineering students. The current state of humanity cannot be compared to any previous state, which makes the adoption of revolutionary measures imperative. Scientists and engineers work together to create breakthrough technologies that address real-world issues. They employ their technological expertise to create and construct these systems, and they frequently include scientific data in their work to enhance its quality. Many scholars [Citation9,Citation10] studied and developed the relation between creativity and engineering education as proposed by [Citation11]. Similarly, the study, explaining the main factors affecting the performance of engineering education, was presented by [Citation12]. A detailed study, to promote creativity and curiosity along with the impacts of the underperformance of engineering students, is described in these references [Citation7,Citation13].
To understand the concepts related to the performances of engineering studies, it is necessary to recognize the social network term. Social networks serve two primary purposes: firstly, they organize the educational process into a social structure; secondly, they analyse the relationships among students. Social network-based engineering education has been the subject of extensive research recently to better understand how students connect and communicate with one another to diagnose problems. The emergence of social systems has created the framework for the development of new guidelines and approaches in engineering education. Over time, project-based learning has become more and more significant to engineering students’ learning processes.
Project-based learning demonstrates a method of instruction in which students collaborate to complete projects. Learning the ability to grasp the needs, aspirations, and expectations of the society in which one lives is the main purpose of education. Since society and education are mutually dependent entities, education is fundamentally a social system. Social class hierarchy and educational attainment are closely related. Empirical studies have demonstrated that those with lower socioeconomic status typically possess lower levels of educational attainment, whilst those with better socioeconomic status typically exhibit higher levels of knowledge acquisition.
To analyse the association between social systems, the study measures and presentation of candidates in a social system of engineering studies were presented by [Citation14]. The presentation of work related to integrate building information modelling into engineering education was discussed by [Citation15]. Furthermore, in respect of future analysis [Citation16] established some new challenges for the motivation and learning in engineering education. Over the past ten years, researchers have looked at predicting students’ academic success, and this is still a crucial area of study in many academic fields. Conventional statistical models have been created to forecast the achievement of students in programmes related to engineering and other fields. Typically, these models are assessed using the grades that students obtain. These scores range from a GPA to a percentage to single letter grades [Citation17]. It is possible to predict a student's academic achievement using data mining [Citation18]. Data mining methods have been applied to educational data mining, including decision trees, neural networks, and Bayesian networks. Among the domains where educational data mining can be utilized are graduation [Citation19] and academic performance.
The aim of this work is to examine the mathematical model for the students’ underperformance in engineering education. Incorporating information modelling into engineering curricula using a 3D model to bring the design to life, BIM helps teams facilitate design reviews with project stakeholders during the project. Verifying that the design represents the intended project outcomes can be done through visualization. Teams involved in design and construction can get much more out of their technological investment thanks to BIM. Throughout the lifecycle of an AEC project, the BIM process facilitates the development and administration of information by combining all multidisciplinary design and construction documentation into a single dataset. The detailed analysis along with the numerical solutions of this mathematical model is also presented. Moreover, an artificial neural network is applied using the Levenberg-Marquardt backpropagation (LMB), i.e. ANNs-LMB. The designed mathematical model is constructed upon four categories, average candidates, below-average candidates, weak candidates and good candidates. A few novel study features for solving the mathematical nonlinear engineering education model are given:
A novel design of the nonlinear students’ underperformance in engineering education is presented to investigate the numerical performances based on the average candidates, below-average candidates, weak candidates and good candidates.
To solve the engineering education for the numerical performances based on the average candidates, the probabilistic Ann model approach is used below-average candidates, weak candidates and good candidates.
The numerical performances of the mathematical nonlinear students’ underperformance in the engineering education model are presented using Adam’s scheme.
The numerical investigations based on the average candidates, below-average candidates, weak candidates and good candidates have been provided with a detailed analysis of the migration rate and the average student rate moves to weak or above average.
The proposed results through ANNs-LMB have been compared with the reference solutions and absolute error (AE) has also been presented.
The other paper’s parts are provided as follows: Section 2 shows the mathematical formulations of the nonlinear students’ underperformance in the engineering education model. The methodology based on the Adams scheme is provided in Section 3. Section 4 indicates the numerical performances of the results. The concluding remarks are provided in the last section.
2. Design of the nonlinear mathematical model
The detailed mathematical formulations to design the nonlinear mathematical models are presented in this section.
2.1. Mathematical formulations of the nonlinear engineering education model
The formulations based on the students’ underperformance of the mathematical engineering education model are presented. The design of different classes makes the model nonlinear. Many educators assessed innovation, performance, and underperformance in engineering education using a variety of methods. Innovation continues through its various stages, including idea generation, concept development and assessment, product development, and execution. By emphasizing these stage performances in the engineering curriculum, certain concepts are developed more deeply as students progress through these stages. Stated differently, crucial talents lead to the process of creativity. This mathematical system has four categories, average s candidates (A(t)), below-average candidates (B(t)), weak candidates (W(t)) and good candidates (G(t)). The mathematical representations of the designed nonlinear system along with the forms of initial conditions (ICs) are described as follows:
(1)
(1)
The nonlinear dynamics based on the engineering education model are represented by the mathematical model formulations mentioned above. Figure shows the formulation processes for the nonlinear engineering education model.
Figure 1. Mathematical design of the students’ underperformance in engineering education.
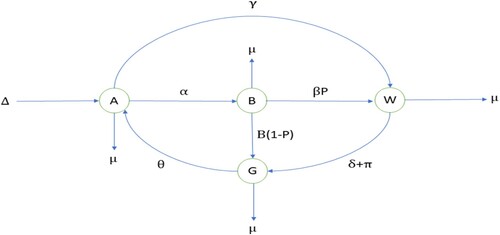
The detailed descriptions of each parameter used in the nonlinear mathematical system (1) based on the students’ underperformance in engineering education are described in Table .
Table 1. Details of the nonlinear mathematical engineering education model.
The designed nonlinear model based on the students’ underperformance in engineering education is constructed using four categories based on average candidates, below-average candidates, weak candidates and good candidates. Various analytical and numerical performances have been reported in the literature for solving the nonlinear system of equations. The nonlinear models have not only been used in engineering studies but also have various applications in the dynamical models [Citation20,Citation21]. A few well-known performances that have been implemented to solve the nonlinear model are presented by [Citation22] used Newton’s embedded approach to solve the system of optimal control policy in the SIR model. A significant amount of research has been conducted in stochastic computing (SC) on application-specific integrated circuit (ASIC) design for edge computing in artificial intelligence (AI), with a focus on the convolutional neural network (CNN) method. Nevertheless, SC's field-programmable gate array (FPGA) optimization is minimal to nonexistent. To put it simply, ‘the neural networks which are built by introducing random variations into the network’ is the basic description of stochastic neural networks, a type of recurrent neural network. [Citation23] discussed the stochastic computing artificial neural network scheme to solve the nonlinear dynamics based on the dengue fever system. [Citation24]. proposed the vaccination procedure in discrete time to spread out the periodic viruses. Another study [Citation25], presented the computational iterative process for the SIR system based on the spreading of viruses through the LMB method [Citation26]. proposed the fractional SIR epidemic system for a three-dimensional measles population. Few more nonlinear models that have been solved using the numerical schemes have been reported in these references [Citation27]. To measure student success in engineering education, a novel mathematical approach is suggested. The mathematical model's numerical solutions as well as a thorough analysis are included in this study. Four groups form the basis of the mathematical model that has been designed: average candidates, weak candidates, below-average candidates, and good candidates. The analysis using the Adams numerical scheme is used to the numerical findings of the designed nonlinear mathematical model to solve the differential system based on the migration rate and average student rate moves to weak and above average. The current study is to design a mathematical nonlinear students’ underperformance in engineering education model that are presented based on the average candidates, below-average candidates, weak candidates and good candidates [Citation28].
3. Proposed methodology
In this section, two different proposed methodologies are presented based on the Adams numerical method and the artificial neural network along with the LMB procedure.
3.1. Adams numerical scheme
The Adams numerical scheme is known as one of the formulas based on the general multistep for solving the nonlinear mathematical engineering education model.
(2)
(2)
Suppose represents the step size, whereas the expansion of Maclaurin’s series of
about
is written as follows:
(3)
(3)
The derivatives of using the formulations of the backward difference are provided as follows:
(4)
(4) where
represenets the
values. To find the interpolation of the 1st order, the numerical procedure adopts the process of iteration as follows:
(5)
(5)
3.2. ANNs-LMB procedure
For solving the mathematical nonlinear model, the architecture of ANNs-LMB is provided in two steps based on the engineering education system.
ANNs-LMB Computational procedures have been proposed along with their essential clarifications.
The recommended computationally techniques depend on ANNs-LMB to address the nonlinear dengue fever SIR system and are supported by formability.
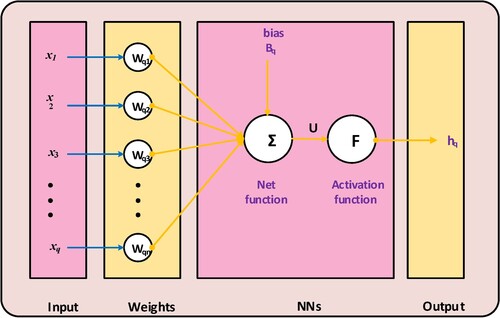
The complexity, overfitting, premature convergence, and underfitting scenarios have all been performed with the best cooperation by artificial intelligence-based supervised learning ANN-LMB. Artificial intelligence-based supervised learning ANN-LMB has accomplished the best cooperation in handling the complexity, overfitting, premature convergence, and underfitting scenarios. Moreover, these network properties are the result of careful consideration, experience, knowledge, and extensive simulation studies; little adjustments to these parameters cause the networks to function worse. Artificial neural networks with global swarming and heuristic approaches can be used to study performance in engineering education. Furthermore, the fractional order stochastic ANNs-LMB solvers will be built. Furthermore, these characteristics of the networks are chosen after extensive simulation studies, experience, expertise, and care, and even little changes to these settings result in a degradation of the networks’ performance. The workflow diagram is presented in Figure . The analysis using the Adams numerical scheme is used to the numerical findings of the designed nonlinear mathematical model to solve the differential system based on the migration rate and average student rate moves to weak and above average. Additionally, the Levenberg-Marquardt training procedure, or ANNs-LMB, is used to obtain stochastic outcomes through the application of artificial neural networks. Using authentication, testing, and training, three samples of data scales have been used to implement the ANNs-LMB methods. It explains the optimization based on a single neuron. Figure displays the designed single-layer structure.
Figure 2. Workflow illustrations of the mathematical engineering education model.
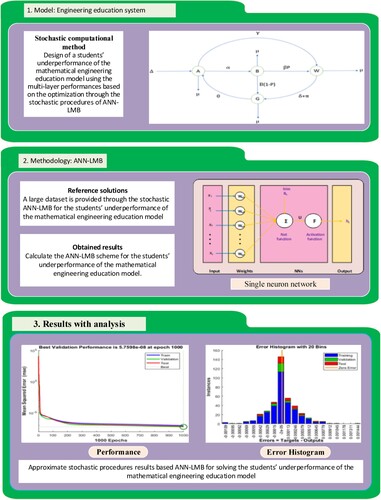
Figure 3. Designed single layer structure.
4. Results and discussion
In this section, a detailed analysis of the students’ underperformance in the mathematical engineering education model is presented.
4.1. Numerical solutions of the engineering education mathematical model
A detailed discussion of solving the students’ underperformance of the mathematical engineering education model is presented in this section. The architecture of ANNs-LMB is presented in two steps based on the engineering education system to solve the mathematical nonlinear model. ANN-LMB Essential clarifications and computational approaches have been proposed. To handle the nonlinear dengue illness, the suggested computational approaches rely on ANNs-LMB. Formability supports SIR systems.
The numerical Adams scheme to solve the designed mathematical model for average student rate moves to weak and above average is also implemented. To solve the differential system based on the migration rate and average student rate moving to weak and above average, the Adams numerical technique is utilized. Additionally, the Levenberg-Marquardt training procedure, or ANNs-LMB, is used to obtain stochastic outcomes through the application of artificial neural networks. One of the formulas for resolving the nonlinear mathematical engineering education model based on the general multistep is the Adams numerical scheme.
The input intervals applied between 0 and 150 for different variations to solve the students’ underperformance of the mathematical engineering education model. Table shows the variable details to solve the students’ underperformance of the mathematical engineering education model.
Table 2. Variable details to solve the students’ underperformance of the mathematical engineering education model.
Case 1: Consider the Migration rate based on the students’ underperformance of the mathematical engineering education model.
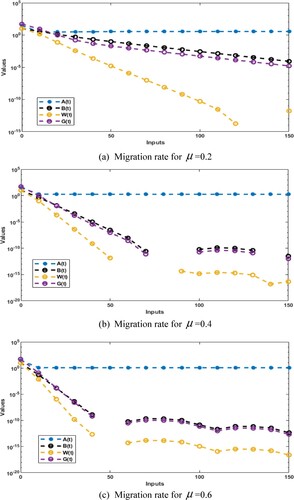
Figure shows the implication of the migration rate for 0.2, 0.4 and 0.6, which is defined for those who migrate from engineering studies. The migration rate of the engineering students is discussed in each class of the designed nonlinear model. In Figure (a–c), one can see that the performances of the average students are smooth, which was not disturbed by increasing the migration rate from engineering students. It means that the migration rate does not affect the average students with the migration. The below-average student behaviour has slightly decreased for
, but for
, the below-average study behaviour got down gradually, then it increased slightly and became stable. However, for
, the below-average study behaviour went down gradually, but it stopped and became stable very soon. This means that the migration rate from engineering studies does not affect below-average students for
. However, by increasing the migration rate from engineering studies, the decreasing effects are noticed but it become stable. The same behaviour has been noticed for the weak students. For good students, the migration rate from engineering studies is poor, but with the increasing values of the migration rate, it becomes better that is depicted for
, however, it becomes more stable for
. It is concluded when the migration rate from engineering studies increased, the performance of good students showed better performances. To analyse relationships between people, groups, organizations, or even entire societies (social units, see differentiation), social scientists might benefit from the theoretical construct known as the social network. A social structure that is shaped by these kinds of interactions is what the phrase refers to. Social networking is the process of connecting individuals and organizations over a variety of platforms to exchange information, sell goods, and communicate.
Figure 4. Migration rate based on the mathematical engineering education model. (a). Migration rate for . (b). Migration rate for
. (c). Migration rate for
.
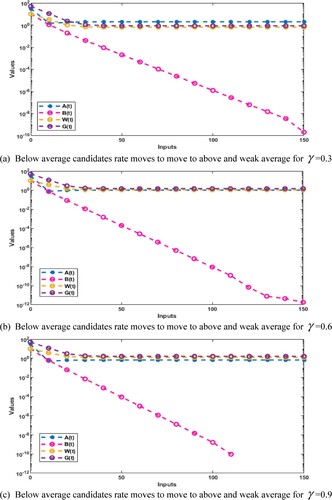
Case 2: Consider the rate at which below-average candidates move to above and weak-average in the mathematical engineering education model.
Figure indicates the implication of the below-average student rate moving to weak and above average for 0.3, 0.6 and 0.9. The average student rate moves to weak and above average and is discussed in each class of the designed nonlinear model. In Figure (a–c), one can see that change the below-average student rate moves to above and weak average, and the performances of first the classes of the nonlinear model go smoothly. It means that the performances of the average candidates, below-average candidates and weak candidates are not affected by the alteration of the average students’ rate moves to weak and above-average. However, the impacts of these variations are noticed for the good students. One can see that for
and 0.6, the performances of the good students went down and better performances have been calculated for
compared to 0.3. However,
represents the performances of the good students who get down and not be stable. It is concluded that the below-average students’ rate moves to weak and above-average migration rate from engineering studies increased, the performance of the good students only affected by this way.
Figure 5. Below-average candidates’ rate moves to move to the above and weak average based on the mathematical engineering education model. (a). Below-average candidates’ rate moves to move to the above and weak average for . (b). Below-average candidates’ rate moves to the above and weak average for
. (c). Below-average candidates’ rate moves to the above and weak average for
.
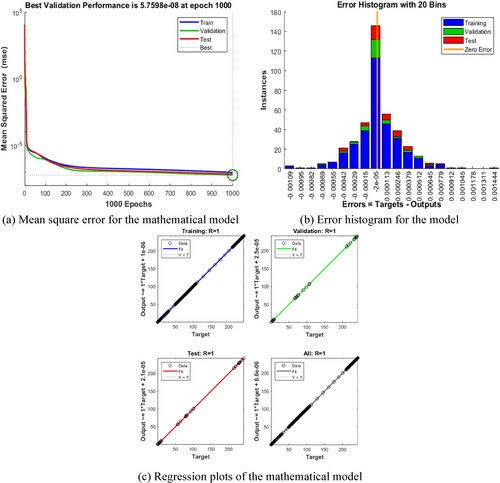
To solve the nonlinear mathematical engineering learning approach, Developed Ann dependent graphs are used are presented in Figure . The probabilistic Ann model approach is utilized for below-average candidates, weak candidates, and good candidates to solve the engineering education for the numerical performances based on the average candidates. The term ‘ANN model’ is often used to define a class of these functions, the members of which are created by adjusting parameters, connection weights, or architectural details like the number of neurons, layers, or connectivity of the architecture. The plots of the mean square error, error histograms and deterioration designs are demonstrated in Figure to solve the engineering education mathematical model. Plotting the mean square error performances for the best curves, learning, verification, and assessment of the mathematical system. The best curve presentation for the nonlinear mathematical engineering education model is found at epoch 1000, which lies around 5.7598 × 10−08. The error plot performances in Figure (b) are illustrated based on the testing, authentication mathematical engineering education model. The regression plots are performed in good measures that are calculated around 1.13 × 10−04. To resolve the diffusion system, the strength of association derived surrounding 1 is shown in Figure (c) mathematical engineering education model, which signifies the perfect model.
Figure 6. MSE, error histograms and regression plots for the nonlinear mathematical model. (a) Mean square error for the mathematical model. (b) Error histogram for the model. (c) Regression plots of the mathematical model.
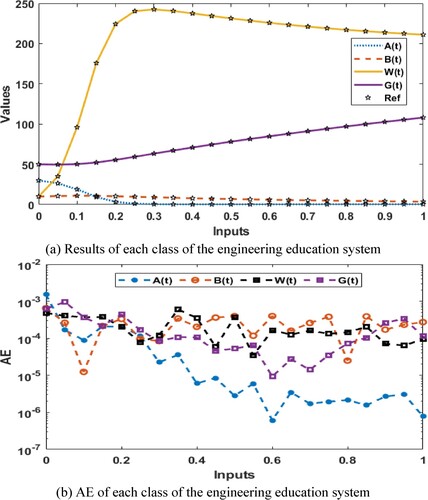
The evaluation of the outcomes and AE for each class of the engineering education system. The solution of the parameters based on the average candidates (A(t)), below-average candidates (B(t)), weak candidates (W(t)) and good candidates (G(t)) using solving each class of the engineering education system are presented in Figure (a). It is seen that the results overlapped for each class of the nonlinear mathematical model and this comparison of the results indicates the correctness of the proposed numerical computing approach. Four categories average candidates, below-average candidates, weak candidates, and good candidates are used to develop the nonlinear model that was designed in response to the students’ underperformance in engineering education. Numerous analytical and numerical approaches to solving the nonlinear system of equations have been documented in the literature. In addition to being employed in engineering research, nonlinear models find several uses in dynamical models. The AE performances of the average candidates (A(t)), below-average candidates (B(t)), weak candidates (W(t)) and good candidates (G(t)) using the designed ANNs-LMB for solving each class of the engineering education system are presented in Figure (b). One can prove that the values of the AE found 10−03 to 10−07, 10−03 to 10−04, 10−03 to 10−04 and 10−03 to 10−05 for the average candidates (A(t)), below-average candidates (B(t)), weak candidates (W(t)) and good candidates (G(t)) parameters of the nonlinear mathematical model. These designed AE performances label the precision and accuracy of the computational ANNs-LMB to solve the nonlinear mathematical model.
Figure 7. Comparison of the results and AE for each class of the engineering education system. (a) Results of each class of the engineering education system. (b) AE of each class of the engineering education system.
5. Conclusion
The purpose of the current investigations is to present a novel design of a mathematical model for the students’ performance in engineering education. The detailed analysis together with the numerical solutions of this mathematical model is also presented. Four groups form the basis of the mathematical model that has been designed: average candidates, weak candidates, below-average candidates, and good candidates. A detailed study is also provided, based on the migration rate and average student rate moving to weak and above average. It is possible to draw the following conclusions: good students perform better when the migration rate from engineering studies increases, and good students’ performance is only impacted in this way when the rate of below-average students shifts to weaker and the migration rate from engineering studies increases. Moreover, an artificial neural network is applied using the Levenberg-Marquardt backpropagation. Three samples of studies are used in the application of the Ann model methods employing authenticating, validation, and retraining, which are chosen as 75%, 15% and 10%, respectively. The values of the AE found 10−03 to 10−07, 10−03 to 10−04, 10−03 to 10−04 and 10−03 to 10−05 for the average candidates (A(t)), below-average candidates (B(t)), weak candidates (W(t)) and good candidates (G(t)) parameters of the nonlinear mathematical model. One can conclude that the comparison of the results is found in good measures and the AE values in good ranges indicate the correctness of the designed scheme.
In the future, the proposed nonlinear mathematical model based on the students’ performance in engineering education can be investigated using artificial neural networks with global swarming and heuristic approaches. Moreover, the designed stochastic ANNs-LMB solvers will be implemented to solve the fractional order, singular models, complex signalling systems using noisy nonlinear differential equation models, coupled nonlinear optical waveguides, thermal explosion model, Sieve estimate of constant and time-varying coefficients in nonlinear ordinary differential equation models by taking into account both mathematical error and imprecision and using no compensating approaches as a consequence of the job and the quantity of data.
Acknowledgements
The authors gratefully acknowledge technical and financial support provided by the Deanship of Scientific Research (DSR), King Abdulaziz University, Jeddah, for this project under grant No. (KEP-29-135-42).
Disclosure statement
No potential conflict of interest was reported by the author(s).
Additional information
Funding
References
- Rizwan A, Alvi MSI, Hammouda M. Analysis of factors affecting the satisfaction level of engineering students. Int J Eng Educ. 2008;24(4):811–816.
- Bell JT, Fogler HC. The application of virtual reality to (chemical engineering) education. IEEE Virtual Reality 2004. IEEE. 2004.
- Litzinger T, Lattuca LR, Hadgraft R, et al. Engineering education and the development of expertise. J Eng Educ. 2011;100(1):123–150. doi:10.1002/j.2168-9830.2011.tb00006.x
- Shuman LJ, Atman CJ, Eschenbach EA, et al. The future of engineering education. 32nd Annual Frontiers in Education. IEEE. 2003.
- Mills JE, Treagust D. Engineering education: is problem-based or project-based learning the answer? Australasian J Eng Educ. 2003;2023; doi:10.3316/aeipt.132462
- van Driel JH, Verloop N, Inge van Werven H, et al. Teachers’ craft knowledge and curriculum innovation in higher engineering education. High Educ. 1997;34(1):105–122. doi:10.1023/a:1003063317210
- Cropley DH. Promoting creativity and innovation in engineering education. Psychol Aesthet Creat Arts. 2015;9(2):161–171. doi:10.1037/aca0000008
- Abdulwahed M. Technology innovation and engineering’ education and entrepreneurship (TIEE) in engineering schools: novel model for elevating national knowledge based economy and socio-economic sustainable development. Sustainability. 2017;9(2):171, doi:10.3390/su9020171
- Khan A, Choudhary MA, Jahanzaib M, et al. Analysis of factors affecting the stress level of engineering students from remote areas. Int J Eng Educ. 2013;29(4):926–932.
- Kazerounian K, Foley S. Barriers to creativity in engineering education: a study of instructors and students perceptions. J Mech Des. 2007;129(7):761–768. doi:10.1115/1.2739569
- Zhou C, Kolmos A, Nielsen JFD. A problem and project-based learning (PBL) approach to motivate group creativity in engineering education. Int J Eng Educ. 2012;28(1):3–16. https://vbn.aau.dk/en/publications/a-problem-and-project-based-learning-pbl-approach-to-motivate-gro.
- Rajput M. Analysis of factors affecting the stress level of engineering students. Int J Eng Educ. 2010;26(3):681–686. https://urn.kb.se/resolve?urn=urn:nbn:se:kth:diva-224457.
- Khan A, Alsulami H, Elnahas N, et al. Impact of emotional intelligence on the academic performance and employability of female engineering students in Saudi arabia. Int J Eng Educ. 2018;35(1):119–125. https://ksascholar.dri.sa/en/publications/impact-of-emotional-intelligence-on-the-academic-performance-and–2.
- Putnik G, Costa E, Alves C, et al. Analysing the correlation between social network analysis measures and performance of students in social network-based engineering education. Int J Technol Des Educ. 2016;26(3):413–437. doi:10.1007/s10798-015-9318-z
- Panuwatwanich K, Wong ML, Doh J-H, et al. Integrating building information modelling (BIM) into engineering education: an exploratory study of industry perceptions using social network data, 1. 2013. https://ro.uow.edu.au/eispapers/1920/.
- Fakhar A, Jahanzaib M, Sarfraz MH, et al. Investigating the impact of emotional intelligence on academic performance of engineering students: an exploratory study in Pakistan. The Nucleus. 2019;56(3):105–111. https://thenucleuspak.org.pk/index.php/Nucleus/article/view/1277.
- Taylan O, Karagözoğlu B. An adaptive neuro-fuzzy model for prediction of student’s academic performance. Comput Ind Eng. October 2009;57(3):732–741. ISSN 0360-8352, doi:10.1016/j.cie.2009.01.019
- Platt J. Using sparseness and analytic QP to speed training of support vector machines. In: Kearns MS, Solla SA, Cohn DA, editors. Advances in neural information processing systems Vol. 59. MA: MIT Press; 1999. p. 222–241.
- Romero C, Ventura S, Espejo PG, et al. Data mining algorithmsto classify students. International Conference on Educational Data Mining (EDM); Montreal; 2008. pp. 8–17.
- Guerrero Sánchez Y, Sabir Z, Günerhan H, et al. Analytical and approximate solutions of a novel nervous stomach mathematical model. Discrete Dyn Nat Soc. 2020;2020:1–9. doi:10.1155/2020/5063271
- Alsulami H, Abualsauod EH, Alomar MA, et al. The impact of campus culture on the satisfaction level of engineering students: a metaheuristics approach. Math Probl Eng. 2022;2022:1–9. doi:10.1155/2022/1899139
- Ögren P, Martin CF. Vaccination strategies for epidemics in highly mobile populations. Appl Math Comput. 2002;127(2–3):261–276. doi:10.1016/s0096-3003(01)00004-2
- Umar M, Sabir Z, Raja MAZ, et al. A stochastic numerical computing heuristic of SIR nonlinear model based on dengue fever. Results Phys. 2020;19:103585, doi:10.1016/j.rinp.2020.103585
- Mickens RE. A discrete-time model for the spread of periodic diseases without immunity. BioSystems. 1992;26(3):193–198. doi:10.1016/0303-2647(92)90079-e
- Umar M, Sabir Z, Asif Zahoor Raja M, et al. Computational intelligent paradigms to solve the nonlinear SIR system for spreading infection and treatment using levenberg–marquardt backpropagation. Symmetry (Basel). 2021;13(4):618, doi:10.3390/sym13040618
- Goufo D, Franc E, Oukouomi Noutchie SC, et al. A fractional SEIR epidemic model for spatial and temporal spread of measles in metapopulations. Abs Appl Anal. 2014;2014:1–6. doi:10.1155/2014/781028
- Müller J. Optimal vaccination patterns in age-structured populations. SIAM J Appl Math. 1998;59(1):222–241. doi:10.1137/s0036139995293270
- Joshi HR. Optimal control of an HIV immunology model. Optim Control Appl Methods. 2002;23(4):199–213. doi:10.1002/oca.710