
ABSTRACT
Purpose
This study aimed to compare the perioral soft tissue movements in patients with skeletal Class III malocclusion with and without mandibular asymmetry during sound articulation.
Materials and Methods
Patients with skeletal Class III facial deformity with mandibular asymmetry (asymmetric facial deformity; AFD, n = 21), without mandibular asymmetry (symmetric facial deformity; SFD, n = 27), and control skeletal Class I healthy individuals (n = 24) participated in this study. Perioral soft tissue movements were recorded during the articulation of /apa/, /ipi/, /upu/, /epe/, and /opo/ using a three-dimensional motion capture system. The asymmetry index (AI) of the range of movements of the commissure points on both sides was compared among the three groups by Kruskal–Wallis test and Dunn–Bonferroni test. Additionally, the correlation between the AI and the range of menton (Me) deviation was examined among patients in the SFD or AFD group by Spearman’s correlation test.
Results
AI on the vertical and sagittal dimensions during the /ipi/ sound articulation in the AFD group was significantly lower than in the other two groups (p < 0.05). In the AFD and SFD groups, AI on the vertical dimension was significantly correlated with Me deviation during /ipi/ sound articulation, as well as on the sagittal dimension during /apa/, /ipi/, /upu/, and /epe/ sound articulation (p < 0.05).
Conclusion
AFD patients displayed more asymmetric perioral soft tissue movements than SFD patients during bilabial sound production.
Introduction
Orofacial movements play essential roles in sound articulation by changing the shape of the acoustic tube of the mouth, and detailed modelling of facial biomechanics for sound production have been considered necessary to understanding the neural control of speech [Citation1,Citation2]. In the recent, with the spread of three dimensional (3D) motion capture systems, many studies have investigated facial movements as speech motor control to elucidate the pathology of dysarthria caused by not only impairment in the central nervous system, such as the patients with aphasia [Citation3] and unilateral facial palsy [Citation4], but also peripheral facial soft-tissue deformities, such as the patients with cleft lip and palate [Citation5] and skeletal facial deformity [Citation6]. Skeletal Class III facial deformity, in particular, induces facial soft-tissue disharmony [Citation7] and affects facial muscle movement during articulation [Citation6], possibly resulting in impaired oral function due to misarticulation [Citation8].
Mandibular asymmetry, associated with a higher frequency in skeletal Class III patients than other skeletal patterns [Citation9], also adversely affects facial soft-tissue harmony [Citation11]. A previous 3D motion analysis study revealed that patients with skeletal Class III malocclusion with mandibular asymmetry have asymmetrical movements of two labial commissure points during non-verbal expressions of smiling [Citation12]. However, how mandibular asymmetry affects perioral muscle movement during sound articulation in skeletal Class III patients remains unclear.
This study aimed to investigate the orofacial movement of the facial soft tissue in skeletal Class III patients with mandibular asymmetry during sound articulation using a 3D motion capture system. The null hypothesis was that the orofacial soft tissue in skeletal Class III patients with mandibular asymmetry would display the same movement as those without mandibular asymmetry. The clinical implication of this study is to better understand the mechanism of speech motor control, which may lead to evidence-based treatment planning, especially for patients who present with asymmetrical mandibular prognathism.
Materials and methods
Participants
This cross-sectional study took place at the Orthodontic Department of Tokyo Medical and Dental University (TMDU) hospital from 2017 to 2021. The inclusion and exclusion criteria of each group are presented in . The asymmetric facial deformity (AFD) group comprised 21 patients with skeletal Class III jaw relationship and mandibular asymmetry (12 men and 9 women; mean age, 21.57 [range, 18–32] years), with a menton deviation (the definition will be shown later) of > 4 mm. The symmetric facial deformity (SFD) group comprised 27 patients with skeletal Class III jaw relationship without mandibular asymmetry (12 men and 15 women; mean age, 21.4 [range, 16–28] years) who displayed a menton deviation of ≤ 4 mm. The control group (CTRL) comprised 24 participants (8 men and 16 women; mean age, 19.7 [range, 16–27] years) with skeletal and dental Class I occlusions, with a menton deviation of ≤ 4 mm. The purpose of this study was explained to the participants, and every participant provided informed consent. The Clinical Investigation Ethics Committee of TMDU approved this study (D2018-017).
Table 1. The inclusion and exclusion criteria of this study.
We performed a power analysis assuming that the statistical comparisons we made in this study were ANOVA, a parametric test corresponding to the Kruskal-Wallis test, which would be the limitation of this study. The sample size was estimated to be 66 patients for a power calculation of 0.80, an alpha of 0.05, and an effect size f of 0.4, which is conventionally considered to be large [Citation13] (G*Power, version 3.1.9.2). Therefore, the number of participants in this study, 72 in total, was considered sufficient.
Regarding the cephalometric variables, the reference points of lateral and posterior-anterior (PA) cephalometric are shown in , respectively. From the PA cephalogram, the menton deviation was measured as the distance between Me and each patient’s midline, which was defined as a line perpendicular to the line connecting the Lo to Lo’ points through the crista galli. The occlusal cant was calculated by measuring the distance from the line connecting the Lo and Lo’ to the Mo point and Mo’ point, respectively and taking the absolute value of the difference between them ().
Figure 1. Lateral and posterior-anterior (PA) cephalometric landmarks and planes. (a) S, sella; N, Nasion; Po, porion; Or, orbitale; A, subspinale; B, supramentale; U1, incisal edge of upper first incisor; L1, incisal edge of lower first incisor; Me, menton; FH plane, Frankfort horizontal plane; Mandibular plane, tangent line of the lower border of the mandible. (b) Lo (‘), right and left Latero-orbitale; Mo (‘), right and left side of the intersection of the maxillary bone and the maxillary first molar.
Motion capture system
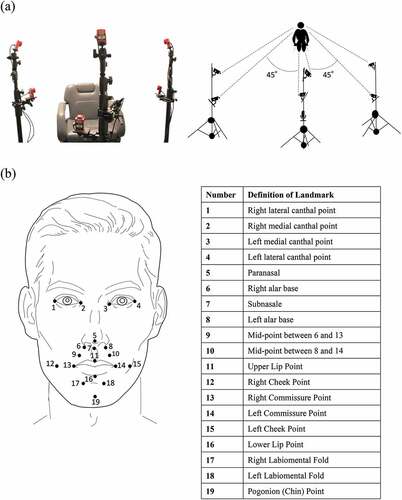
The video-based tracking system (Flex3 Opti-track, Acuity Inc., Japan) was used to record facial movements during articulation (). The motion analysis system has been used in previous studies and is accepted for biomechanical scientific applications [Citation14]. The 3D analysis system for animated images (Motive software, Acuity Inc., Japan) controls Opti-track and calculates 3D coordinates in real-time with a positional accuracy of ± 0.2 mm. The resolution was 640 × 480 pixels. The measurement error in the motion capture system, calculated after the calibration, was 0.054 ± 0.010 mm. The system tracked silver foam polyethylene markers (diameter, 3 mm) attached to 19 specific landmarks on the face with a point contact ().
Figure 2. Three-dimensional motion capture system for orofacial soft tissue. (a) Two cameras were mounted opposite the participants’ faces. The remaining four cameras were divided into two on each side of the participant and mounted symmetrically at 45° from the participant’s midline. The two cameras at each angle were 70 cm away from the participant’s head and were higher and lower than the patient’s head. The vertical distance between the two cameras at each angle was 35 cm. (b) Facial landmarks were used for the dynamic analysis.
Data acquisition
Motive software automatically calculated the camera position, posture, and lens distortion and performed calibration before recording all participants. The participants were requested to pronounce five Japanese vowels associated with the bilabial sound ‘p’ (/apa/, /ipi/, /upu/, /epe/, and /opo/) in the natural head position. The participants underwent a practice session to pronounce the target sound correctly before data collection. After the practice session, each participant repeated the speech tasks series shown in three times. The data for the first sound in each line were excluded from the analysis to avoid any bias of soft tissue movement at the beginning of the task. Fifteen repeated trials were obtained for each sound in each recording.
Figure 3. Design of the speech task. The participants repeated the pronunciations series three times. Each session in an alternating pattern consisted of six rest blocks and five speech blocks. The rest block was 3 seconds in duration.
Data analyses
According to the previous study, the three axes were defined in Euclidean space for the analysis [Citation6] (). The distance each landmark moved was calculated from the trajectory of each landmark during the articulation of each sound for each axis using the 3D Venous software (Nobby Tech. Ltd, Japan). PRAAT software version 6 (Amsterdam University, the Netherlands) was used to determine each sound’s start and finish times. We then obtained the range of motion of each landmark while pronouncing each sound for each axis and calculated the maximum raw displacement of each landmark for each axis (). The raw maximum displacement value calculated by the software was divided by the distance between the left and right lateral canthal points to normalize the effect of the size of an individual’s face on soft tissue movement, and the value was treated as the maximum displacement.
Figure 4. Reference planes in the 3D coordinate system and waveforms representing the motion of each landmark.
The maximum displacement was compared among the three groups for each landmark. The shifted side was defined as the side towards which the Me deviation for the AFD and SFD groups. In contrast, the contralateral side was defined as the non-shifted side. The motion results were reversed left and right as needed so that the left was always the shifted side in all patients. The asymmetry index (AI) (calculation: shifted side − non-shifted side/shifted side + non-shifted side × 100) of the maximum displacement of the two commissure points was also calculated and compared among the three groups. We also examined the correlation between the maximum movement of each landmark or AI value and the range of menton deviation for patients with mandibular prognathism (patients in the SFD or AFD group).
Measurement error
We chose 30 cases from our participants, took five males and five females from each group, and measured all the cephalometrics to evaluate intra-examiner errors in measurements. Then, the intraclass correlation coefficient (ICC) was calculated. As for the motion data, the maximum displacement during each sound articulation was measured twice at 6-week intervals by one examiner, and the ICC was calculated.
Statistical analyses
The Fisher’s exact probability test was used to compare the association in the male/female ratio demographic data; the Kruskal-Wallis test was used to compare the age among the three groups. The Shapiro-Wilk test was used for the non-normalized distributed samples of motion analysis. Accordingly, the Mann–Whitney U test was used to compare variables between men and women. The Kruskal–Wallis test was used to compare the maximum displacement, AI of two commissure points, and each morphological measurement among the three groups. The Dunn–Bonferroni test was used for post hoc pairwise comparison. Spearman’s rank correlation coefficient was used to analyse the correlation between maximum movement or AI and the range of menton deviations. All analyses were performed using SPSS version 27 (SPSS Inc., Chicago, Illinois, USA). The level of significance was set at p < 0.05.
Results
In this study, the ICC of the cephalometric measurements ranged from 0.890 to 0.998, and movement measurements ranged from 0.837 to 0.999, indicating excellent reliability. Furthermore, there were no significant differences in age and male/female ratio among the three groups, indicating the comparability of the three groups in this study. Additionally, there were no significant sex differences in any variable. The variables in the lateral and cephalogram and irregularity index are shown in
Table 2. Descriptive values and statistical calculations for cephalometric variables and irregularity index between each group.
There was no difference among the three groups in any motion analysis, except for the landmarks at the upper lip, lower lip, and two commissure points (points #11, #16, #13, and #14 in , respectively). The results for the movement of each landmark are shown in . The main findings were as follows. The upper lip displayed significantly smaller movement on the Y-axis in the AFD group than in the SFD group during the /apa/, /ipi/, and /epe/ sounds articulation (p = 0.023, p = 0.041, and p = 0.006, respectively). The lower lip exhibited significantly larger movement on the Z-axis in the AFD and SFD group than the CTRL group during the /ipi/ (p = 0.002 and p < 0.001, respectively) and /upu/ sounds articulation (p = 0.016 and p = 0.048, respectively). The AI of the two commissure points was significantly larger in the AFD group than in the SFD group on the Z-axis during the /apa/, /ipi/, and /epe/ sounds articulation (p = 0.011, p < 0.001, and p = 0.005 respectively), and on the Y-axis during the /ipi/ sound articulation (p < 0.001). shows the correlation between the AI of the two commissure points and the menton deviation for the patients in the SFD and AFD groups. The AI was positively correlated with menton deviation on the Y-axis during the sound articulation of /ipi/ (p = 0.006, r = 0.388), and on the Z-axis during the /apa/ (p = 0.016, r = 0.346), /ipi/ (p < 0.001, r = 0.451), /upu/ (p = 0.003, r = 0.414), and /epe/ (p = 0.011, r = 0.362) sounds articulation.
Table 3. Comparison of the maximum displacement of landmarks during /apa/ articulation between the three groups
Table 4. Comparison of the maximum displacement of landmarks /ipi/ articulation between the three groups
Table 5. Comparison of the maximum displacement of landmarks during /upu/ articulation between the three groups
Table 6. Comparison of the maximum displacement of landmarks during /epe/ articulation between the three groups
Table 7. Comparison of the range of movement of landmarks during /opo/ articulation between the three groups
Table 8. Comparison of the asymmetry index (AI) during each sound articulation between the three groups
Figure 5. Correlation between the menton deviations and the asymmetry index (AI) of the two commissure points in the facial deformity patients (SFD and AFD groups).
Discussion
Articulation tasks
In this study, speech tasks of vowel-consonant-vowel (VCV) sequences, where the consonant was a bilabial plosive consonant (/p/), were used [Citation15]. Articulating the /p/ sound requires complete competence of the lips, and the release of airflow is achieved by proper synchronous closing movement of the lips [Citation16]. A deviation in the dental structure interferes with the normal process of airflow and pressure and proper lip and tongue placement and contouring, affecting the integrity of speech sound production [Citation17]. Our results indicate that the maximum displacement of each landmark was consistently observed when the /p/ sound was pronounced. Thus, the difference in the maximum displacement among the groups may indicate the articulatory characteristics of the /p/ sound in each maxillofacial morphology.
Perioral movements in patients with skeletal Class III malocclusion compared with skeletal Class I malocclusion
The SFD and AFD group patients displayed greater lower lip and commissure point movement on the Z-axis than in the CTRL group during articulation of the /ipi/ and /upu/sounds. Additionally, the previous 3D motion capture study revealed that the midpoint of the lower lip moved more posteriorly in the patients with mandibular prognathism during articulating Japanese vowels /a/, /u/, /e/, and /o/ [Citation6] on the Z-axis (anterior-posterior axis). Therefore, these characteristic lower lip movements were postulated to compensate for the horizontal skeletal discrepancy, which can be applied to the present results.
The upper lip in the SFD group showed relatively greater movement during /apa/, /ipi/, /upu/, and /epe/ sound and significantly greater movement during /opo/ sound than in the CTRL group on the Y-axis. A previous study using a 3D motion capture system showed that, in healthy participants, vertical movement of the upper lip had been the main contributor to pronouncing bilabial consonant combinations with the rounded vowel of /o/ [Citation18]. Additionally, a previous study using electromyography showed that patients with skeletal Class III malocclusion required greater upper orbicularis oris muscle activity to achieve lip closure than patients with skeletal Class I malocclusion because of their labial incompetence [Citation19]. Therefore, the upper lip in patients with mandibular prognathism would display greater vertical movement to achieve lip closure during bilabial articulation.
Perioral movements in patients with skeletal Class III malocclusion with mandibular asymmetry
The results of the AI of the two commissure points indicate that patients with mandibular asymmetry display asymmetric commissure point movement in the anteroposterior dimensions, specifically during the articulation of the /apa/, /ipi/, and /epe/ sounds. A previous motion capture study revealed that the difference between the maximum movements of two commissure points was significantly greater in patients with mandibular asymmetry than those without mandibular asymmetry during smiling [Citation12]. This finding is consistent with our results that two labial commissure points in patients with mandibular asymmetry may also move asymmetrically during sound articulation. Furthermore, a previous study using computer tomography (CT) showed that the midpoint of the lower lip was shifted to the shifted side [Citation20]. However, we did not find any compensatory lateral (X-axis) movement of the lower lip. Another previous CT study found that the patients with mandibular asymmetry showed antero-posterior asymmetry in facial soft tissue, evident in the lateral region of the lower lip [Citation9]. Therefore, it would be assumed that the articulation points may be shifted towards the skeletal deviated side in the AFD group, which may have caused the asymmetric antero-posterior movement in the two commissure points, specifically during bilabial stop consonants with the vowel of /a/, /i/, /e/ where articulation points were located anterior. In addition, the relatively large vertical movement of the upper lip, which would be characteristic for symmetrical skeletal Class III patients as mentioned in the last paragraph, was significantly smaller during /apa/, /ipi/, and /epe/ sounds in the AFD group than in the SFD group. This may also be because the point of articulation has shifted from the midpoint of the upper lip.
The asymmetric movements of the two commissure points are greater when the mandibular asymmetry increases, according to the results of the correlation analysis. A previous CT study showed that facial soft-tissue asymmetry was correlated to the degree of skeletal asymmetry in patients with mandibular asymmetry [Citation20]. Therefore, the skeletal mandibular asymmetry would also affect the function of facial soft tissue besides the morphology. Since orthodontists must also treat function in facial deformity patients with mandibular asymmetry, understanding facial movement asymmetry is considered essential for treatment planning. Moreover, as a clinical implication, these characteristic facial soft-tissue movements in skeletal Class III patients with mandibular asymmetry may be one important finding to elucidate their mechanism of articulation.
Limitations
One possible limitation is that we did not investigate the perioral muscle activities for stopping and releasing airflow, which would also be an important factor in producing bilabial plosives sounds. Another limitation is that sound evaluation, such as acoustic analysis [Citation8] and speech intelligibility [Citation3], was not conducted in this study. Such evaluations can increase our understanding of misarticulation. Finally, another limitation of this study is that we cannot objectively demonstrate the reproducibility of the sound task by not analysing them.
Conclusion
The patients with skeletal Class III malocclusion with mandibular asymmetry displayed more asymmetric perioral soft tissue movements than those without mandibular asymmetry during articulation of bilabial sounds. Additionally, these asymmetric perioral muscle movements are related to the degree of skeletal mandibular deviation. Future studies should clarify how these characteristic movements are altered by orthognathic surgery.
Authors’ contributions
AF and MT designed, performed the experiments, and obtained the data. In consultation with YH and MT, AF analyzed the data. AF and YH interpreted the results MJJ and MK supervised the overall theoretical structure of the manuscript. AF and YH drafted the manuscript. MJJ and MK edited the manuscript. All authors read and approved the final manuscript.
Ethical approval
The purpose of this study was explained to the participants, and each participant provided informed consent. The Clinical Investigation Ethics Committee of Tokyo Medical and Dental University (D2018-017) approved this study.
Acknowledgments
We thank the members of our department for their helpful comments
Disclosure statement
No potential conflict of interest was reported by the authors.
Data availability statement
The datasets used and analyzed during the current study are available from the corresponding author, KM, upon reasonable request.
Additional information
Funding
References
- Lindblom BE, Sundberg JE. Acoustical consequences of lip, tongue, jaw, and larynx movement. J Acoust Soc Am. 1971;50(4):1166–1179.
- Lucero JC, Munhall KG. A model of facial biomechanics for speech production. J Acoust Soc Am. 1999;106(5):2834–2842.
- Bose A, van Lieshout P. Speech-like and non-speech lip kinematics and coordination in aphasia. Int J Lang Commun Dis. 2012;47(6):654–672.
- Trotman CA, Faraway J, Hadlock T, et al. Facial soft-tissue mobility: baseline dynamics of patients with unilateral facial paralysis.”. Plast Reconstr Surg, Glob Open. 2018;6(10):e1955.
- Trotman CA, Faraway JJ, Phillips C. Visual and statistical modeling of facial movement in patients with cleft lip and palate. Cleft Palate-Craniofacial J: Off Publication Am Cleft Palate-Craniofacial Assoc. 2005;42(3):245–254.
- Okudaira M, Ono T, Kawamoto T, et al. Three-dimensional analysis of lower lip movement during articulation in subjects with mandibular prognathism. Orthod Waves. 2008;67(3):93–103.
- Kale B, Buyukcavus MH. Comparison of three-dimensional soft-tissue evaluations between skeletal and pseudo-class III malocclusions. Sci Rep. 2020;10(1):14717.
- Lathrop-Marshall HMM, Keyser B, Jhingree S, et al. Orthognathic speech pathology: impacts of Class III malocclusion on speech. Eur J Orthod. 2022;44(3):340–351.
- Good S, Edler R, Wertheim D, et al. A computerized photographic assessment of the relationship between skeletal discrepancy and mandibular outline asymmetry. Eur J Orthod. 2006;28(2):97–102.
- Iizuka T, Ishikawa H. Normal standards for various cephalometric analysis in Japanese adults. J Japan Orthodontic Soc. 1957;16:4–12.
- Duran GS, Dindaroğlu F, Kutlu P. Hard- and soft-tissue symmetry comparison in patients with Class III malocclusion. Am J Orthodont Dentofac Orthoped. 2019;155(4):509–522.
- Xue Z, Wu L, Qiu T, et al. Three-dimensional dynamic analysis of the facial movement symmetry of skeletal Class III patients with facial asymmetry. J Oral Maxillofacial Surg. 2020;78(2):267–274.
- Cohen J. A power primer. Psychol Bull. 1992;112(1):155–159.
- Nagymáté G, Kiss RM. Application of OptiTrack motion capture systems in human movement analysis: a systematic literature review. Recent Innov Mechatron. 2018;5(1):1–9.
- Inoue-Arai MS, Ono T, Honda E, et al. Motor coordination of articulators depends on the place of articulation. Behav Brain Res. 2009;199(2):307–316.
- Smith A. The control of orofacial movements in speech. Crit Rev Oral Biol Med: Off Publication Am Assoc Oral Biologists. 1992;3(3):233–267.
- Leavy KM, Cisneros GJ, LeBlanc EM. Malocclusion and its relationship to speech sound production: redefining the effect of malocclusal traits on sound production. Am J Orthodont Dentofac Orthoped. 2016;150(1):116–123.
- Popat H, Zhurov AI, Toma AM, et al. Statistical modelling of lip movement in the clinical context. Orthod Craniofac Res. 2012;15(2):92–102.
- Nicolet C, Muñoz D, Marino A, et al. Lip competence in Class III patients undergoing orthognathic surgery: an electromyographic study. J Cranio-Maxillo-Facial Surg: Off J Am Assoc Cranio-Maxillo-Facial Surg. 2012;70(5):e331–e336.
- Jeon EG, Lee ST, Kwon TG. Perioral soft tissue change after isolated mandibular surgery for asymmetry patients. J Oral Maxillofac Surg: Off Publication Eur Assoc Oral Maxillofacial Surg. 2017;45(6):962–968.