
 ?Mathematical formulae have been encoded as MathML and are displayed in this HTML version using MathJax in order to improve their display. Uncheck the box to turn MathJax off. This feature requires Javascript. Click on a formula to zoom.
ABSTRACT
Purpose
The purpose of the present study is to improve the quality of prediction of soft tissue morphology by clarifying the relationship between the amount of three-dimensional (3-D) changes of hard tissue and the morphological differences of the soft tissue chin before and after orthognathic surgery in skeletal class III malocclusion.
Materials and methods
Preoperative and six-month postoperative CT was used to analyze the changes in 26 adult Japanese skeletal class III patients. The mean age was 25.5 years. Lateral cephalograms were analyzed to evaluate the initial antero-posterior jaw relationship and the changes before and after treatment. Three-D masks and bone structures were reconstructed using 3-D modelling software, and the final chin models were defined for further analysis following voxel-based registration. Correlation and linear regression analyses were performed to clarify the relationship between the movement of the soft tissue chin and the underlying bone.
Results
The soft tissue chin volume and surface area significantly increased after surgery. The thickness of the chin significantly increased only at pogonion and menton after surgery. Furthermore, a statistically significant correlation between the movement of soft tissue chin and underlying bone was found. Consequently, the regression model predicted the changes in soft tissue chin from the movement of the underlying bone.
Conclusion
Three-D analysis of the soft tissue chin revealed a significant change in response to surgical orthodontic treatment in skeletal class III adult patients, and soft tissue chin movement could be predicted by using 3-D CT data when planning orthognathic treatment.
Introduction
Combined orthodontic-orthognathic surgical treatment improves functional and aesthetic outcomes in patients with severe skeletal class III malocclusion [Citation1]. Previous research has indicated the importance of evaluating soft tissue for facial attractiveness and beauty [Citation2]. Many studies have demonstrated the changes and relationship between the surgical movement of maxillofacial bones and changes in soft tissue related to the facial profile using two-dimensional analysis for a long time [Citation3–7]. Recently, methods for three-dimensional (3-D) analysis have been developed, and numerous investigators have focused on utilizing 3-D images to demonstrate the complexities of facial hard and soft tissue structures [Citation8–10]. Some studies have examined the correlation between hard and soft tissues through symmetrical and asymmetrical changes resulting from either isolated mandibular setback surgery [Citation11] or a combination of two jaw surgery [Citation12]. In addition, some researchers have assessed changes in the midfacial area because these areas have complex concavity and convexity shapes [Citation13–16]. However, they did not thoroughly analyze the chin region, which is a prominent facial structure in the frontal and profile views that is crucial in facial aesthetic assessment, and changes in it are considered one of the main changes that may affect the aesthetics of the lower face after orthodontic-orthognathic surgery [Citation17]. Hence, due to the importance of this region, other investigators have focused on evaluating chin thickness in relation to different skeletal malocclusions or vertical patterns [Citation18–20]. Moreover, studies also evaluated the thickness following orthognathic surgery [Citation21,Citation22]. Yet, they did not analyze the real 3-D changes, such as volumetric changes, and the correlation between soft and hard tissue chin was studied only at unilateral points. Recent research examined 3-D chin among different types of skeletal malocclusion using different parameters. Nevertheless, it only investigated hard tissue chin without reflecting the soft tissue chin part [Citation23].
Despite the increasing interest in the evaluation of facial soft tissue changes produced by orthognathic surgery, the current literature lacks a detailed 3-D analysis of the soft tissue chin after mandibular setback surgery with bilateral sagittal split ramus osteotomy (BSSO), which is crucial for determining facial attractiveness and establishing an appropriate orthognathic treatment plan. Understanding the correlation between changes in the soft tissue chin and underlying hard tissue is also essential for predicting the postoperative shape of the lower face.
Therefore, the present study aimed to evaluate 3-D changes in the soft tissue chin and to clarify the relationship between soft tissue and underlying hard tissue movement in the chin region after BSSO in adult Japanese patients with skeletal class III jaw deformities using 3-D computed tomography (CT). We hypothesized that the 3-D shape of the soft tissue chin might change significantly when the mandibular protrusion is surgically corrected, and the amount of the change in soft tissue is significantly correlated with the amount of hard tissue movement.
Materials and methods
Participants
Three-dimensional CT images of 26 adult Japanese patients (18 females, and 8 males) taken before and after treatment were utilized in the present study. Participants were recruited from the patients at the Orthodontic Clinic, Kyushu University Hospital. The mean age was (25.5 years, range 18–51 years).
The inclusion criteria for the present study were as follows:
Adult Japanese patients with good general health and had no systemic diseases.
They had severe skeletal class III malocclusion with an ANB angle of less than 0°.
They were treated by orthognathic surgery using BSSO with presurgical orthodontic treatment performed without Lefort 1 osteotomy and/or additional aesthetic surgical procedures, such as genioplasty.
The exclusion criteria were as follows:
(1) The patients who had a history of orthodontic treatment, orthognathic surgery, or maxillofacial trauma.
(2) They had a menton deviation greater than 4 mm from the midline.
(3) They had cleft lip and/or palate and craniofacial syndromes.
(4) They had lost or incomplete series of identifiable CT records, technically aberrant CTs, and non-continuous soft tissue contour at the chin level indicating chin strain.
This study was approved by the Ethics Committee of the Faculty of Dental Science of Kyushu University, Fukuoka, Japan (Approval no. 23182–00).
Image acquisition, segmentation, and registration
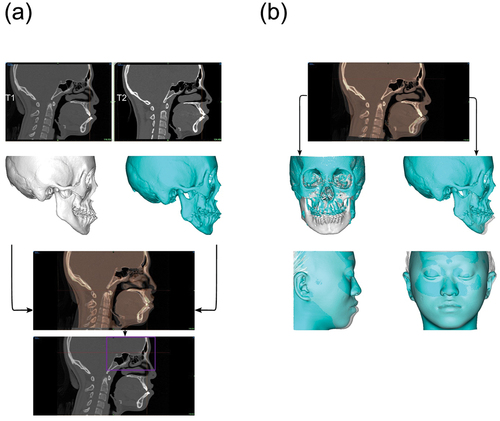
Each patient underwent CT scans before (T1) and six months after (T2) surgery. CT Images were acquired with the patient positioned supine on the CT couch, the head in a natural position, and relaxed facial musculature. During scanning, the patients were asked to bite with maximum intercuspation and not move their heads or tongues. CT scans were obtained using Aquilion (Toshiba Medical System Corporation, Tokyo, Japan). All patients had the following scan parameters: slice thickness, 0.5 mm; tube voltage, 120 kVp; tube current, 100 mA; image matrix size, 512 × 512; and field of view, 230 mm. Fifty-two CT scans were stored in Digital Imaging and Communications in Medicine (DICOM) format. DICOM data were imported into Mimics software (v.24.0, Materialise, Leuven, Belgium) to reconstruct the 3-D masks. A total of 104 hard and soft tissue 3-D models were reconstructed using a semi-automatic segmentation workflow function of grayscale thresholding with a range (−700–225) Hounsfield Units for soft tissue and (226–3071) for hard tissue [Citation24]. Voxel-based automatic image registration was used to compare the 3-D masks between T1 and T2 images [Citation25], as shown in ().
Figure 1. Image superimposition using voxel-based automatic registration. (a) Aligning the moving image (T2) and selecting the registration area for cranial base registration. (b) Image registration and superimposition of 3-D masks using transparency overlay tool.
Soft tissue chin analysis and measurements
The chin was defined by indicating four cephalometric landmarks in the 3-D soft tissue model: chelion right (ChR), chelion left (ChL), sublabial (Sl), and soft tissue menton (Me’). The final chin model was exported to the 3-D analytical and design software 3-Matic (v.16.0, Materialise, Leuven, Belgium) for further analysis and automatic computation of the volume and surface area of soft tissue chin. Mimics software was used to determine the distance between the soft and hard tissue landmarks (). During this process, seven soft tissue and seven hard tissue landmarks were identified to determine soft-tissue chin thickness. In addition, anthropometric point changes were measured, the ratio and correlation of 3-D soft-to-hard tissue movement were implemented, and linear regression was performed to predict 3-D soft tissue chin movement from the underlying skeletal movement following BSSO. presents the definitions of landmarks.Furthermore, Intraobserver reliability was determined by one examiner to reduce inexactness between the investigators. The measurements taken during the initial assessment were compared with those taken during repeated examinations after two-week intervals.
Figure 2. Three-D landmarks on the chin surface. To the left, 14 reproducible landmarks were plotted on the surface of the 3-D chin to perform the measurements. Six points on the midsagittal plane: Point B, hard tissue pogonion (Pog), hard tissue menton (Me), sublabial (Sl), soft tissue pogonion (Pog’), and soft tissue menton (Me’). Eight points were plotted on the right and left lateral sides of the hard and soft tissue chin surface: points 1H and 1S, points 2H and 2S, points 3H and 3S, and points 4H and 4S. To the right axial view of the points.
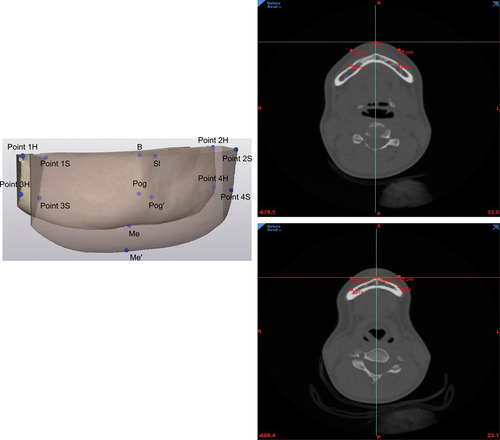
Table 1. Description of chin landmarks used in this study.
Cephalometric analysis
Cephalometric analysis was performed using lateral cephalograms taken before and after orthognathic surgery. The cephalometric parameters and their changes were analyzed, and the definition of the parameters is shown in Supplementary Table 1.
Statistical analysis
The Shapiro-Wilk test was used to check the normality of the data, as all tended to be normally distributed. A paired t-test was used to compare the soft tissue chin parameters between T1 and T2. The Pearson correlation coefficient was used to assess the relationship between the soft tissue chin and underlying hard tissue and to analyze the correlation between patient age and soft tissue chin volume, surface area, and thickness changes. Regression analysis was performed to develop an equation to predict 3-D soft tissue chin movement after mandibular setback and to evaluate the impact of vertical characteristics on soft tissue changes. All data were statistically analyzed using JMP software (JMP ® Pro Version 17.0.0 SAS Institute Inc., Cary, NC 2022). The results were presented as mean ± standard deviation and statistical significance was set at p < 0.05.
A sample size calculation was conducted using G*power 3.1.9 (Heinrich-Heine-Universität Düsseldorf, Düsseldorf, Germany). With reference to a previous study [Citation26], a significant level of ⍺ = 0.05, a power of 80% to detect a 1 mm difference (standard deviation = 1 mm) for the soft tissue thickness at pogonion between pre and post-surgical treatment. Consequently, the power analysis showed that 10 subjects would provide adequate statistical power for differences. Additionally, a power analysis for correlation was conducted based on a previous study [Citation10] with an estimated correlation of r = 0.55, ⍺ = 0.05, with 80% power. The analysis indicated that at least 23 samples would be required to achieve adequate statistical power for the correlation analysis.
Results
Measurement’s reliability
Intraexaminer agreement was high for the measurements, with intraclass correlation coefficients ranged from 0.84 to 0.99.
Changes in hard tissue before and after surgery
The cephalometric measurements of the samples before and after orthognathic surgery are indicated in Supplementary Table 2. The skeletal class III cephalometric characteristics of the patients were changed to skeletal class I.
Table 3. Comparison of the soft tissue chin volume and surface area before and after surgery.
summarizes the changes in the 3-D hard tissue chin landmarks following BSSO. The average amount of mandibular setback surgery was 7.5 mm. The amount of posterior movement at points B, Pog, and Me was 5.97 ± 2.43 mm, 5.70 ± 2.90 mm, and 5.85 ± 2.84 mm, respectively. The amount of upward movement at points B, Pog, and Me was 1.27 ± 1.86 mm, 1.13 ± 1.19 mm, and 0.91 ± 1.16 mm, respectively. These three points after orthognathic surgery showed significant backward and upward positions compared with those before surgery. On the other hand, there were no significant differences in the mediolateral direction between the three points.
Table 2. Three-dimensional changes in chin hard tissue landmarks before and after surgery.
Changes in soft tissue chin volume, surface area, and thickness before and after surgery
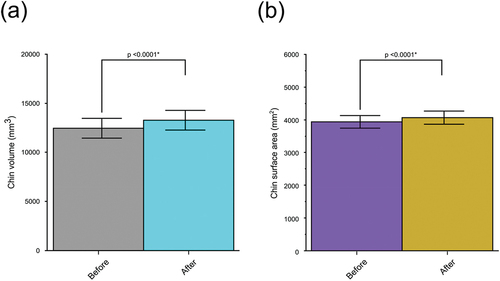
shows the changes in soft tissue chin volume and surface area. Chin volume statistically significantly increased at T2 (13273.3 ± 2483.10 mm3) compared to T1 (12455.4 ± 2494.25 mm3). The difference in chin volume was (817.93 ± 824.65 mm3, p < 0.0001). Similarly, the surface area of the chin demonstrated a statistically significant increase at T2, as the difference in surface area between T1 and T2 was (128.57 ± 136.31 mm2, p < 0.0001). This is further illustrated in .
Figure 3. Soft tissue chin volume and surface area before and after surgery. (a) Changes in the soft-tissue chin volume before and after surgery. (b) Changes in soft tissue chin surface area before and after surgery. Each error bar is reconstructed using a 95% confidence interval. A paired t-test was used to compare the values before and after surgery. Statistical significance was set at p < 0.05.
Furthermore, shows the chin thickness between T1 and T2. We found that the thickness significantly increased after surgery at Pog (0.39 mm ± 0.79 mm, p = 0.018) and at Me (0.29 mm ± 0.58 mm, p = 0.03). The increase in chin thickness at the lateral points was not statistically significant (p > 0.05).
Table 4. Chin soft tissue thickness changes before and after surgery.
Table 5. Ratio of chin soft tissue to chin hard tissue movement.
Correlation between chin hard and soft tissue following orthognathic surgery
shows the correlation between the soft tissue chin and the underlying bone. The average ratio was 0.90, ranged from 0.87 to 0.94 (). Consequently, we investigated the relationship between soft tissue chin movement and underlying hard tissue movement and found a high correlation for all landmarks, with an average correlation of 0.927 and ranged from 0.88 to 0.99.
Figure 4. Correlation between 3-D chin soft tissue movements and underlying hard tissue movements, where r denotes the correlation coefficient of each plot. Statistical significance was set at p < 0.05.
Regression analysis
presents the findings of the linear regression analysis. The R2 value was high for Sl, Pog’, and Me’ ranged from 0.9 to 0.98 (p < 0.0001) and medium to high R2 values for the lateral points ranged from 0.77 to 0.87 (p < 0.0001).
Table 6. Regression analysis predicting the 3-D movement of the soft tissue chin.
Correlation between patient’s age and soft tissue chin changes
No association exceeded r > 0.5 and no statistically significant correlation was observed between patient age and soft tissue chin changes including chin volume, chin surface area, and chin thicknesses at all points, as indicated in .
Table 7. Pearson correlation analysis for age and soft tissue changes.
Effect of vertical characteristics on soft tissue chin changes
Based on the regression analysis (), the presurgical mandibular plane, occlusal plane, and lower facial height had no statistically significant relationship with soft tissue changes in chin volume, chin surface area, and chin thickness at the Pog and Me.
Table 8. Impact of vertical characteristics on changes of soft tissue chin.
Discussion
The chin, a critical component of facial aesthetics, enormously affects facial harmony [Citation27]. In addition, orthognathic surgery is a procedure that may alter the shape of soft tissue chin [Citation28]. Therefore, investigating 3-D changes in the soft tissue chin after BSSO is essential for improving orthodontic treatment plans and patient-orthodontist communication.
The novel finding of the present study is that the chin volume and surface area are significantly increased after surgery. One possible explanation for this finding could be muscular relaxation in the strained mentalis and orbicularis oris after BSSO [Citation29]. This may be explained by the fact that remained and loosened soft tissue on the bony chin could remain and accumulates in this area when the mandibular bone is set back [Citation21]. A similar conclusion was reached by Filho et al. [Citation28], who reported an average increase in the chin surface six months after two-jaw surgery.
We observed an increase in chin thickness at all points following surgery. However, only Pog’ and Me’ thicknesses were statistically significant. Previous investigations have been conducted to determine whether mandibular setback affects soft tissue thickness and have shown conflicting findings. Our results are in line with those of Choi et al. [Citation21], who showed that the thickness at the Pog increased significantly following bimaxillary surgery in high-angle groups. In contrast, point B’ exhibited an average increase in thickness, which was not statistically significant. Ho et al. [Citation29] remarked a significant increase in chin thickness not only at Pog’ and Me’ but also at B’ following orthognathic surgery. This may be because their samples underwent a combination of mandibular setback surgery and vertical chin reduction genioplasty. In contrast, Naoumova et al. and Peng et al. [Citation26,Citation30] reported a decrease in point B thickness, accompanied by slight changes at Pog. These dissimilarities could result from the different methods of analysis and intergroup differences. In the present study, we found no significant difference in thickness between lateral landmarks. Moreover, the midpoints were thinner than the lateral points, which can be explained by differences in the chin level and location. As points approach the lateral region, which is known to be loose and thick, adhesion to the underlying bone stiffens and becomes less flexible [Citation10]. This highlights the need to investigate the chin points at different levels.
The current study investigated the relationship between the soft tissue chin and its underlying hard tissue in 3-D following BSSO for mandibular setback. We found that changes in the soft tissue chin had a high positive correlation (0.90) with the underlying hard tissue at all points. The ratio of points B, Pog, and Me yielded a value of 0.91 (). Previous research has shown the same ratio at the same points [Citation9]. However, another study indicated an almost 1:1 horizontal ratio for points B and Pog [Citation7]. In contrast, other studies found a ratio of (0.73:1) for point B’ [Citation14,Citation15,Citation31], and a ratio of (0.69:1) for Pog’ [Citation15]. Pog in our study tends to display 0.87 to the corresponding hard tissue; This finding is consistent with that of a three-dimensional study conducted by Shi et al. [Citation32] who reported that soft tissue changes relative to hard tissue in Pog were 86% following mandibular setback. These differences might be due to variations in the chin shape among the investigations.
illustrates the outcome of the linear regression analysis, which was significant across all points. However, R2 gained a greater value (R2 ≥0.9) for the central points compared to lateral points (R2 <0.87). Lo et al. [Citation10] evaluated the correlation between soft and hard tissue and found that as the proportion of soft tissue changes relative to hard tissue movements gradually decreased towards the lateral side following surgical correction of class III jaw deformity. Koerich et al. [Citation33] found that subchelion had smaller advancement when compared to soft tissue pogonion. The reason for this might be that the semicircular shape of the mandible causes soft tissue changes that tend to become smaller as it is farther from the midline [Citation34].
Upon analyzing the influence of age on chin soft tissue changes, we found no significant relationship or good correlation coefficient between age and chin soft tissue parameters (). This outcome aligns with that of Jokic et al. [Citation35], who found no correlation between patient age and soft tissue changes following orthognathic surgery.
Regression analysis indicated no significant impact of presurgical vertical characteristics on soft tissue chin changes after surgery (). These results may have been influenced by the population’s biocharacteristics and sample size.
The main strength of this study was the use of 3-D evaluation that precisely determined and analyzed the shape and volume of the soft tissue chin in patients with skeletal class III malocclusion who underwent surgical orthodontic treatment with isolated mandibular setback surgery.
The present study has certain limitations that should be considered when interpreting the results. Because of the small sample size and the gender imbalance, we combined males and females in our analysis, which might impact the research outcome. Accordingly, it is crucial to conduct future research with a balanced male-female study and a larger sample size. It is imperative to conduct further research utilizing the current methodology in different populations to generalize the results, as our study was mainly conducted on the Japanese population. While CT scans are a valuable tool for 3-D evaluation even while the patients are in the natural position in the supine position. The difference between natural head posture in cephalograms and supine natural posture in 3-D CT would cause some misunderstanding.
Conclusion
Three-dimensional soft tissue chin showed a significant change in response to surgical orthodontic treatment in skeletal class III adult patients. These changes include soft tissue chin volume, surface area, and thickness of the pogonion and menton. The effects of age on soft tissue changes were not significant, and vertical characteristics before surgery did not significantly influence the changes in soft tissue. On this basis, creating a 3-D chin model using CT scans can be effectively applied as an evaluation procedure, and in the future, it would be useful for predicting the postoperative outcomes of orthognathic treatment.
Authors’ contributions
Author 1 contributed to experimental investigation, methodology, data acquisition, statistics, original draft writing, conceptualization, review, and editing. Author 2,3,4,5 contributed to data acquisition and reviewed the final version before submission. Author 6 contributed to the conceptualization, project administration, methodology, writing, review, editing, and final approval of the manuscript. All authors read and approved the final manuscript.
Ethical approval
This study was approved by the Ethics Review Committee of the Faculty of Dental Science, Kyushu University, Fukuoka, Japan (Approval number: 23182–00).
Supplemental Material
Download (32.1 KB)Acknowledgments
We would like to thank all members of the Department of Orthodontics and Dentofacial Orthopedics, and the Department of Oral and Maxillofacial Surgery, Graduate School of Dental Science, Kyushu University, for their suggestions and support.
Disclosure statement
No potential conflict of interest was reported by the author(s).
Supplementary material
Supplemental data for this article can be accessed online at https://doi.org/10.1080/27705781.2024.2368374
Additional information
Funding
References
- Chen MYC, Wu YF, Huang HL, et al. Biomechanical evaluation of sagittal split ramus osteotomy fixation techniques in mandibular setback. Appl Sci (Switzerland). 2020;10(9):3031. doi: 10.3390/app10093031
- Naini FB, Garagiola U, Wertheim D. Analysing chin prominence in relation to the lower lip: The lower lip-chin prominence angle. J Craniomaxillofac Surg. 2019;47(8):1310–1316. doi: 10.1016/J.JCMS.2019.06.002
- Aydemir H, Efendiyeva R, Karasu H, et al. Evaluation of long-term soft tissue changes after bimaxillary orthognathic surgery in class III patients. Angle Orthodontist. 2015;85(4):631–637. doi: 10.2319/062214-449.1
- Storms AS, Miclotte A, Grosjean L, et al. Short-term hard and soft tissue changes after mandibular advancement surgery in class II patients: a retrospective cephalometric study. Eur J Orthod. 2017;39(5):567–576. doi: 10.1093/EJO/CJX003
- Yeo BY, Kim JS, Kim J, et al. Submandibular soft tissue changes after mandibular set-back surgery in skeletal class III patients. J Stomatol Oral Maxillofac Surg. 2019;120(4):301–309. doi: 10.1016/j.jormas.2019.05.004
- Joachim MV, Brosh Y, Daoud F, et al. Soft tissue movement in orthognathic surgery: does pre-operative soft tissue thickness affect movement change? Appl Sci (Switzerland). 2022;12(16):12. doi: 10.3390/app12168170
- Rupperti S, Winterhalder P, Rudzki I, Mast G, Holberg C. Changes in the facial soft-tissue profile after mandibular orthognathic surgery. Clin Oral Investig. 2019;23(4):1771–1776. doi: 10.1007/s00784-018-2609-5
- Celikoglu M, Buyuk SK, Ekizer A, et al. Assessment of the soft tissue thickness at the lower anterior face in adult patients with different skeletal vertical patterns using cone-beam computed tomography. Angle Orthodontist. 2015;85(2):211–217. doi: 10.2319/040114-237.1
- Chang YJ, Ruellas ACO, Yatabe MS, et al. Soft tissue changes measured with three-dimensional software provides new insights for surgical predictions. J Oral Maxillofacial Surg. 2017;75(10):2191–2201. doi: 10.1016/j.joms.2017.05.010
- Lo LJ, Weng JL, Ho CT, et al. Three-dimensional region-based study on the relationship between soft and hard tissue changes after orthognathic surgery in patients with prognathism. PLoS One. 2018;13(8):e0200589. doi: 10.1371/journal.pone.0200589
- Jung YJ, Kim MJ, Baek SH. Hard and soft tissue changes after correction of mandibular prognathism and facial asymmetry by mandibular setback surgery: Three-dimensional analysis using computerized tomography. Oral Surg Oral Med Oral Pathol Oral Radiol. 2009;107(6):763–771.e8. doi: 10.1016/j.tripleo.2008.12.026
- Lee TY, Kim KH, Yu HS, et al. Correlation analysis of three-dimensional changes of hard and soft tissues in class III orthognathic surgery patients using cone-beam computed tomography. J Craniofacial Surg. 2014;25(4):1530–1540. doi: 10.1097/SCS.0000000000000620
- Resnick CM, Dang RR, Glick SJ, et al. Accuracy of three-dimensional soft tissue prediction for Le fort i osteotomy using dolphin 3D software: a pilot study. Int J Oral Maxillofac Surg. 2017;46:289–295. doi: 10.1016/j.ijom.2016.10.016
- Jung J, Lee CH, Lee JW, et al. Three dimensional evaluation of soft tissue after orthognathic surgery. Head Face Med. 2018;14(1). doi: 10.1186/s13005-018-0179-z
- Kim YK, Moon SW, Yun PY, et al. Evaluation of soft tissue changes around the lips after mandibular setback surgery with minimal orthodontics using three-dimensional stereophotogrammetry. J Oral Maxillofacial Surg. 2016;74(5):1044–1054. doi: 10.1016/j.joms.2015.11.023
- Jeon EG, Lee ST, Kwon TG. Perioral soft tissue change after isolated mandibular surgery for asymmetry patients. J Craniomaxillofac Surg. 2017;45(6):962–968. doi: 10.1016/J.JCMS.2017.01.039
- Sella Tunis T, May H, Sarig R, et al. Are chin and symphysis morphology facial type–dependent? A computed tomography-based study. Am J Orthod Dentofacial Orthop. 2021;160(1):84–93. doi: 10.1016/j.ajodo.2020.03.031
- Macari AT, Hanna AE. Comparisons of soft tissue chin thickness in adult patients with various mandibular divergence patterns. Angle Orthodontist. 2014;84(4):708–714. doi: 10.2319/062613-474.1
- Patil HS, Golwalkar S, Chougule K, et al. Comparative evaluation of soft tissue chin thickness in adult patients with skeletal class ii malocclusion with various vertical growth patterns: a cephalometric study. Folia Med (Plovdiv). 2021;63(1):74–80. doi: 10.3897/folmed.63.e52165
- Jabbar A, Umar Zia A, Shaikh IA, et al. Evaluation of soft tissue chin thickness in various skeletal malocclusions. Pakistan Orthodontic J. 2016;8:62–66.
- Choi SH, Lee H, Hwang JJ, et al. Differences in soft-tissue thickness changes after bimaxillary surgery between patients with vertically high angle and normal angle. Am J Orthod Dentofacial Orthop. 2021;159(1):30–40. doi: 10.1016/j.ajodo.2019.10.028
- Kim KA, Chang YJ, Lee SH, et al. Three-dimensional soft tissue changes according to skeletal changes after mandibular setback surgery by using cone-beam computed tomography and a structured light scanner. Prog Orthod. 2019 20;20(1). doi: 10.1186/s40510-019-0282-0
- Okumura Y, Koizumi S, Suginouchi Y, et al. Chin morphology in relation to the skeletal pattern, age, gender, and ethnicity. Appl Sci (Switzerland). 2022;12(24):12. doi: 10.3390/app122412717
- Nur RB, Dg Ç, Arun T. Evaluation of facial hard and soft tissue asymmetry using cone-beam computed tomography. Am J Orthod Dentofacial Orthop. 2016;149(2):225–237. doi: 10.1016/j.ajodo.2015.07.038
- Diaconu A, Holte MB, Cattaneo PM, et al. A semi-automatic approach for longitudinal 3D upper airway analysis using voxel-based registration. Dentomaxillofac Radiol. 2022;51:20210253. doi: 10.1259/dmfr.20210253
- Naoumova J, Söderfeldt B, Lindman R. Soft tissue profile changes after vertical ramus osteotomy. Eur J Orthod. 2008;30(4):359–365. doi: 10.1093/ejo/cjn025
- Maglitto F, Sani L, Piloni S, et al. Step-technique genioplasty: A case report. Int J Surg Case Rep. 2022;95:107232. doi: 10.1016/J.IJSCR.2022.107232
- de FJ, S SAD, Trivellato AE, et al. Evaluation of chin morphology after two-jaw orthognathic surgery: A retrospective study using stereophotogrammetry. J Oral Res And Rev. 2022. doi: 10.4103/JORR.JORR_42_21
- Ho CT, Huang CS, Lo LJ. Improvement of chin profile after mandibular setback and reduction genioplasty for correction of prognathism and long chin. Aesthetic Plast Surg. 2012;36(5):1198–1206. doi: 10.1007/s00266-012-9933-y
- Peng SP, Lin CH, Chen YA, et al. Three-dimensional facial soft-tissue changes after surgical orthodontics in different vertical facial types of skeletal Class III malocclusion: A retrospective study. J Craniomaxillofac Surg. 2024;52(4):522–531. doi: 10.1016/j.jcms.2024.02.008
- Mandrekar P, Dhupar V, Akkara F. Prediction of soft-tissue changes following single and bi-jaw surgery: An evaluative study. Ann Maxillofac Surg. 2021;11(1):32–36. doi: 10.4103/ams.ams_138_20
- Shi Y, Liu S, Shao X, et al. Facial changes in patients with skeletal class III deformity after bimaxillary surgery: an evaluation based on three-dimensional photographs registered with computed tomography. Br J Oral Maxillofac Surg. 2022;60(10):1404–1410. doi: 10.1016/j.bjoms.2022.05.014
- Koerich L, Brunetto DP, Ohira ETB. The effect of hard tissue surgical changes on soft tissue displacement: A pilot CBCT study. Dental Press J Orthod. 2017;22(5):39–46. doi: 10.1590/2177-6709.22.5.039-046.oar
- Baik HS, Kim SY. Facial soft-tissue changes in skeletal class III orthognathic surgery patients analyzed with 3-dimensional laser scanning. Am J Orthod Dentofacial Orthop. 2010;138(2):167–178. doi: 10.1016/j.ajodo.2010.02.022
- Jokić D, Jokić D, Ugleśić V, et al. Soft tissue changes after mandibular setback and bimaxillary surgery in class III patients. Angle Orthodontist. 2013;83(5):817–823. doi: 10.2319/100112-775.1