
 ?Mathematical formulae have been encoded as MathML and are displayed in this HTML version using MathJax in order to improve their display. Uncheck the box to turn MathJax off. This feature requires Javascript. Click on a formula to zoom.
Abstract
Purpose
This study aimed to calculate and analyze the differences in electroencephalogram (EEG) between major depression disorder (MDD) patients and healthy controls using the method of brainwave music to provide evidence of physiological parameters for clinical diagnosis of MDD.
Methods
We translated the 5-minute resting EEG data of 20 MDD patients and 20 healthy controls, which were collected by Peking University Sixth Hospital, into brainwave music; and calculated the pitch, volume, duration and corresponding scaling exponents to analyze the differences between MDD patients and healthy people. Then combined the analysis methods of nonlinear dynamics and brain network structure to verify the validity of the proposed method.
Results
The pitch, volume, and Lemple-Ziv complexity (LZC) in the frontal lobe of MDD patients were higher than those of healthy people. In the central, occipital, and temporal regions of the left hemisphere, the scaling exponents, degrees, and clustering coefficient of MDD patients were lower than those of healthy people (P < 0.05).
Conclusions
This study has shown that brainwave music analysis can reflect the differences between MDD patients and healthy controls from a new perspective, and these differences may provide a scientific basis for the clinical diagnosis and brainwave music therapy of MDD.
1. Introduction
Major depression disorder (MDD) is a common mental disorder that seriously harms the physical and mental health of human beings. The main symptoms of MDD are emotional depression, loss of interest, anhedonia, and hypodynamia [Citation1]. The lifetime prevalence of depressive disorder is 6.8% [Citation2], and people of all ages can suffer from depression. Depression symptoms seriously disturb the life and work of patients and bring a heavy burden to their families and society. Currently, more than 350 million people worldwide suffer from depression of varying degrees [Citation3]. People with severe depression may have suicidal behavior [Citation4], and depression continues to be the leading cause of disability worldwide [Citation5].
Thus far, the pathogenesis of MDD is not clear. There are still no specific physiological and biochemical indicators as auxiliary diagnostic criteria. The clinical diagnosis of MDD is mainly based on the patients’ or their family members’ complaints and assessment with a depression scale [Citation6], such as the Hamilton Rating Scale for Depression (HAMD) [Citation7] or the Patient Health Questionnaire (PHQ-9) [Citation8]. Although these scales are good predictors of whether someone has a mental disorder [Citation9], they can only be used if the person or his or her family asks for help, and some patients may choose options that do not correspond to their actual situation, resulting in the inability to find a correct diagnosis and timely treatment. Thus, the diagnostic accuracy of MDD is still not up to the desired level. Given the severity of the current situation of MDD, we must strengthen the research on MDD to develop more effective means of diagnosis and prevention.
Wang et al. [Citation10] found that the abnormal transmission of excitatory signals between brain cells in Glires is associated with depression symptoms, suggesting that depression may be caused by the dysfunction of communication between brain cells. Electroencephalography (EEG) can reflect the excitability and inhibitory postsynaptic potential activity of neurons in the cerebral cortex [Citation11], which has abundant physiological and pathological information. Therefore, the analysis of EEG may provide a physiological basis for the diagnosis and treatment of MDD.
In recent years, there has been more and more research on the brain activity of depressive patients based on EEG. It has mainly included three analysis methods: frequency domain analysis [Citation12,Citation13], nonlinear dynamics analysis [Citation14–16] and brain network structure analysis [Citation17–19]. However, the findings are not entirely consistent. Therefore, it is meaningful to explore the EEG signals of MDD from a new perspective.
From an electrophysiology perspective, the study of sensory neurons shows that the firing rate and firing interval of auditory neurons have fractal characteristics, which accord with scale-free distribution [Citation20]. The earliest concept of a fractal was derived from observing and describing the shape of nature, and with the continuous study of fractals, their characteristics have gradually been identified. The scale property is the embodiment of the fractal characteristics of complex systems. Since the 1970s, it has been found that musical intensity, interval, and other parameters conform to the scale-free property [Citation21]. Therefore, Wu [Citation22] proposed a brainwave music mapping rule based on the scale free property, and their experiment demonstrated that scale-free brainwave music technology can distinguish the different states of the brain, so it can be used as a new method to analyze the brain function and state.
This study examines the differences in EEG between MDD patients and healthy controls from the perspective of brainwave music for the first time and analyzes the nonlinear dynamics and brain network structure to illustrate the validity of brainwave music analysis.
2. Materials and methods
2.1. Materials
The EEG data of 20 MDD patients and 20 healthy volunteers were collected by the Sixth Hospital of Peking University. Criteria for inclusion for MDD patients were as follows: (1) aged 18–60, with junior secondary education or above; (2) first or recurrent depressive episode diagnosed according to International Classification of Diseases-10 (ICD-10); (3) 17 item Hamilton Rating Scale score over 17. Criteria for exclusion: (1) severe organic disease of the body or brain; (2) pregnant or lactating women; (3) intellectual disability; and (4) drug abuser. The MDD patients comprised 14 females and 6 males aged between 18 and 48. The healthy volunteers comprised 13 females and 7 males aged between 20 and 43. All subjects were informed of the study details and signed a written consent form that was approved by the ethics committee of Peking University Sixth Hospital.
2.2. Methods
2.2.1. EEG data acquisition and pre-processing
In this study, the signal was collected using a BrainMaster-NM device, and electrode placement was consistent with international 10–20 scalp conduction. During the recording, the environment was quiet, and the subjects sat in their chair comfortably. The EEG was recorded in a resting state with eyes closed for 5 minutes. Fp1, Fp2, F3, F4, C3, C4, P3, P4, O1, O2, F7, F8, T3, T4, T5, and T6 electrodes were recorded, as in many previous studies [Citation16,Citation23]. The sampling frequency was 1000 Hz, for ease of calculation, we resampled it to 256 Hz. A high-pass filter with 0.5 Hz and a low-pass filter with 35 Hz were used to remove the high-frequency noise and electromyography (EMG) in the EEG collected. In addition, independent component analysis (ICA) [Citation24] was used to remove the eye-tracking artifact, and then we removed the severely drifted signal segments manually. We selected continuous 120 s data segments to create brainwave music and then calculate the corresponding parameters, and for the analysis of nonlinear dynamic and brain network structure, the 120 s data segment was divided into four consecutive 30 s segments, and their corresponding parameters were calculated. Then the average values were taken as the final parameters.
2.2.2. Translation of brainwave music
In this study, each channel of EEG was translated into Musical Instrument Digital Interface (MIDI) [Citation25] sequences using the Chinese five-tone filtering method and the Western seven-tone filtering method of single-channel brainwave music. The rule of mapping EEG to brainwave music adopted the method proposed by Wu [Citation22]. A musical note has four essential parameters: pitch, volume, duration, and timbre. The pitch is mapped by the amplitude of the EEG, with the amplitude of the EEG indicating the distance from the bottom to the peak of an EEG event (event: one cycle starts with the signal waveform changing from negative to positive and ends with the second change from negative to positive, and two cycles of data are one event). The volume is determined by the energy of each event. Other than that, the duration is the length of an event, and the choice of timbre can be based on needs. In this work, we chose the Piano Timbre, and the details of the pitch and volume translations are as follows:
From EEG amplitude (Amp) to Pitch of musical note
(1)
2. From the average power of the EEG (AP), we can derive the Volume of the musical note:
To make the comparison between the two groups more accurate and ensure the audibility of the music, we keep the parameters consistent when translating EEG to music. The α value of EEG ranges from 0.5 to 1.5 [Citation22], so we set α = 1. The range of pitch and volume in a MIDI sequence is 0–127, to bring the pitch and volume within this range and make the music more pleasing to the ear, we set n = 105, k = 10, and l = 80.
The original MIDI sequences had 12 notes in an octave, but this kind of music is chaotic. To improve the audibility of music, Wu [Citation27] used the recency and steadiness principles to adjust the MIDI sequence to five or seven notes in an octave. We also used this method to translate EEG into MIDI sequences.
2.2.3. Analysis of brainwave music
For brainwave music analysis, we calculated the average pitch, volume, duration (the MIDI sequences contained pitch, volume, and duration, so the average values could be obtained by a simple calculation), pitch scaling exponent, volume scaling exponent, and duration scaling exponent of the MIDI sequences.
The scaling property of a physical quantity can be measured by scaling analysis. The principle is that the oscillation amplitude of a physical quantity is regarded as a function of the scale of the physical quantity. It is shown that the physical quantity has a scaling property. If X(t) is made to represent the amplitude of the oscillations deviating from the steady state at time t, then X(t) has a power-function distribution:
(4)
(4)
where α is the scaling exponent; in double logarithmic coordinates, it is the slope of the fitted line. Since the function is a power function, this property is often referred to as a power law. Hence, the scaling exponent for pitch, volume, and duration was calculated as follows.
Pitch Scaling Exponent: We counted the number of times each musical note appeared in MIDI sequences. Arranged in descending order in double logarithmic coordinates, these points were linear fitting, and the absolute value of the slope was the pitch scaling exponent.
Volume Scaling Exponent: We counted the corresponding total volume of each musical note appeared in MIDI sequences. Arranged in descending order in double logarithmic coordinates, these points were linear fitting, and the absolute value of the slope was the volume scaling exponent.
Duration Scaling Exponent: We counted the total amount of time each musical note appeared in MIDI sequences. Arranged in descending order in double logarithmic coordinates, these points were linear fitting, and the absolute value of the slope was the duration scaling exponent.
2.2.4. Analysis of nonlinear dynamic
The purpose of nonlinear dynamics analysis is to reflect the change in the dynamic characteristics of the complex system, and the human brain has been demonstrated to be a typical nonlinear system with the characteristics of nonlinearity and chaos. The nonlinear study of EEG has received more and more attention. In this study, Lemple Ziv complexity (LZC) [Citation14–16] was used to analyze the differences in EEG between MDD patients and healthy subjects. LZC is a model-independent nonlinear measure that reflects the rate at which a new pattern appears with the increase of the length of a time series. The higher the LZC is, the higher the probability of new modes and the more frequency components there are, that is, the more complex the corresponding dynamic behavior is.
2.2.5. Analysis of brain network
The human brain is considered a complex system, including multiple functional areas. The interaction among the functional areas constitutes the human brain’s cognitive, emotional, and other complex activities [Citation28]. In recent years, there has been more and more research on the brain network of depression. In this study, we used mutual information (MI) to calculate the connectivity between two electrodes.
MI is a type of information entropy that measures the amount of information in one signal that contains another signal. It can be used to estimate the time series dependence of any two electrodes. The detailed calculation and analysis process is described as follows:
Taking 16 channels of EEG as 16 nodes, the mutual information between two nodes was calculated, and then we obtained a MI matrix M.
We Observed M and selected the threshold. To make the results more obvious, after many experiments, we selected 10 thresholds between 0.84 and 0.895, with a step size of 0.005.
Based on the Brain Connectivity Toolbox (BCT) [Citation29] (http://www.brain-connectivity-toolbox.net), we calculated the clustering coefficient and degrees of each node for 10 binary matrices and then obtained their average.
2.2.6. Statistical method
SPSS statistical software was used to analyze the differences in demographic factors and characteristics between MDD patients and healthy controls. The intergroup comparison was analyzed by an independent sample t test.
3. Results
3.1. Statistical analysis of demographic factors in MDD patients and healthy controls
The age and sex of patients with MDD and healthy controls were statistically analyzed. There was no significant difference between the two groups (P > 0.05), as shown in .
Table 1. Demographic factor statistics.
3.2. Analysis of brainwave music
3.2.1. Pitch
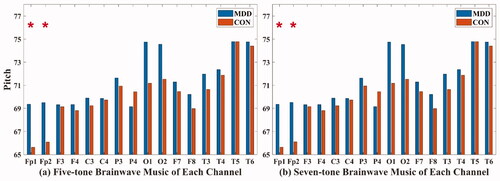
In the five-tone brainwave music translated from Fp1 (MDD: 69.362 ± 4.182; CON: 65.63 ± 5.69) and Fp2 (MDD: 69.513 ± 4.666; CON: 66.089 ± 4.618) channels, and in the seven-tone brainwave music translated from Fp1 (MDD: 69.356 ± 4.177; CON: 65.64 ± 5.695) and Fp2 (MDD: 69.516 ± 4.654; CON: 66.107 ± 4.612) channels, the pitches of MDD were all higher than those of healthy people (P < 0.05), as shown in .
Figure 1. The pitch of five-tone brainwave music (a) and seven-tone brainwave music (b). Orange: MDD patients; blue: healthy controls. *Significant difference between MDD patients and healthy controls.
3.2.2. Volume
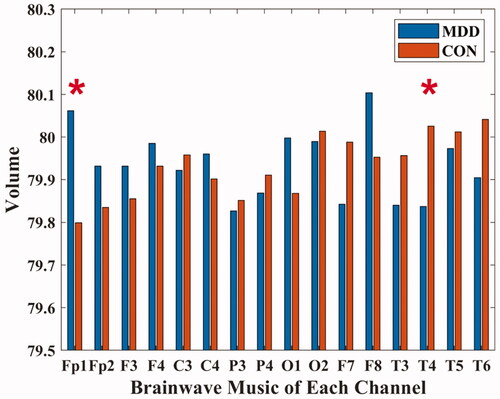
In the brainwave music translated from Fp1 (MDD: 80.062 ± 0.329; CON: 79.799 ± 0.37) and T4 (MDD: 79.838 ± 0.293; CON: 80.026 ± 0.239) channels, the MDD volumes were all different from those of healthy people (P < 0.05), as shown in . Furthermore, there was a significant positive correlation between the volume of the brainwave music translated from the Fp1 channel and the HAMD scores of MDD patients (P < 0.05).
Figure 2. The volume of brainwave music. Orange: MDD patients; blue: healthy controls. * Significant difference between MDD patients and healthy controls.
3.2.3. Duration
There was no significant difference between the two groups in the five and seven-tone brainwave music (P > 0.05).
3.2.4. Pitch scaling exponent
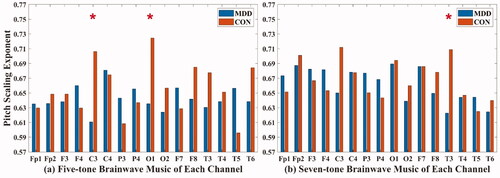
In the five-tone brainwave music translated from C3 (MDD: 0.611 ± 0.126; CON: 0.706 ± 0.136) and O1 (MDD: 0.635 ± 0.106; CON: 0.725 ± 0.085) channels and in the seven-tone brainwave music translated from the T3 (MDD: 0.623 ± 0.092; CON: 0.709 ± 0.085) channel, the pitch scaling exponents of MDD patients were all lower than those of healthy people (P < 0.05), as shown in .
Figure 3. The pitch scaling exponent of five-tone brainwave music (a) and seven-tone brainwave music (b). Orange: MDD patients; blue: healthy controls. * Significant difference between MDD patients and healthy controls.
3.2.5. Volume Scaling exponent
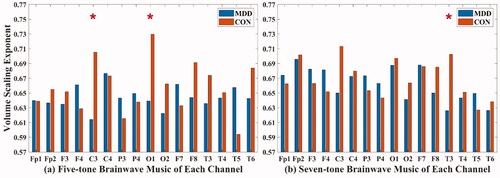
In the five-tone brainwave music translated from C3 (MDD: 0.614 ± 0.129; CON: 0.705 ± 0.137) and O1 (MDD: 0.639 ± 0.11; CON: 0.73 ± 0.09) channels, and in the seven-tone brainwave music translated from the T3 (MDD: 0.626 ± 0.095; CON: 0.702 ± 0.083) channel, the volume scaling exponents of MDD were all lower than those of healthy people (P < 0.05), as shown in .
Figure 4. The volume scaling exponent of five-tone brainwave music (a) and seven-tone brainwave music (b). Orange: MDD patients; blue: healthy controls. * Significant difference between MDD patients and healthy controls.
3.2.6. Duration Scaling exponent
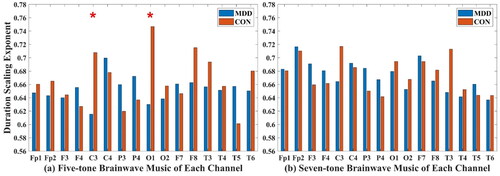
In the five-tone brainwave music translated from C3 (MDD: 0.615 ± 0.133; CON: 0.708 ± 0.141) and O1 (MDD: 0.63 ± 0.097; CON: 0.747 ± 0.094) channels, the duration scaling exponents of MDD were all lower than those of healthy people (P < 0.05), and there was no significant difference between the two groups in the seven-tone brainwave music, as shown in .
Figure 5. The duration scaling exponent of five-tone brainwave music (a) and seven-tone brainwave music (b). Orange: MDD patients; blue: healthy controls. * Significant difference between MDD patients and healthy controls.
3.3. Analysis of nonlinear dynamic
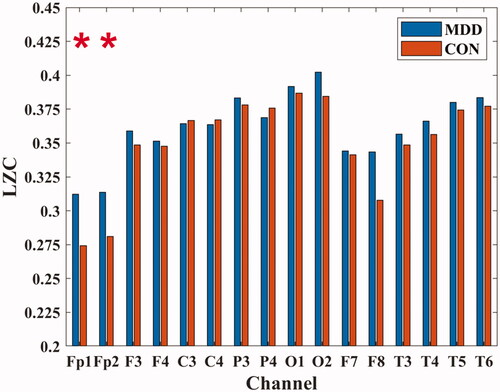
In the Fp1 (MDD: 0.312 ± 0.058; CON: 0.274 ± 0.046) and Fp2 (MDD: 0.314 ± 0.057; CON: 0.281 ± 0.041) channels, the LZC values of MDD were all higher than those of healthy people (P < 0.05), as shown in .
Figure 6. The LZC of each channel. Orange: MDD patients; blue: healthy controls. * Significant difference between MDD patients and healthy controls.
3.4. Analysis of brain network
3.4.1. Clustering Coefficient
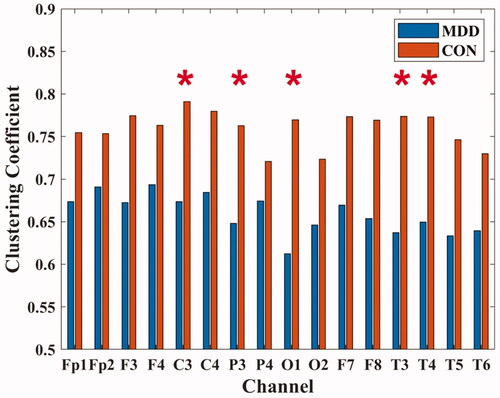
In C3 (MDD: 0.674 ± 0.194; CON: 0.791 ± 0.087), P3 (MDD: 0.648 ± 0.199; CON: 0.763 ± 0.094), O1 (MDD: 0.612 ± 0.259; CON: 0.769 ± 0.083), T3 (MDD: 0.637 ± 0.267; CON: 0.774 ± 0.086) and T4 (MDD: 0.650 ± 0.247; CON: 0.773 ± 0.102) channels, the clustering coefficients of MDD were all lower than those of healthy people (P < 0.05), as shown in .
Figure 7. The clustering coefficient of each channel. * Significant difference between MDD patients and healthy controls.
3.4.2. Degrees
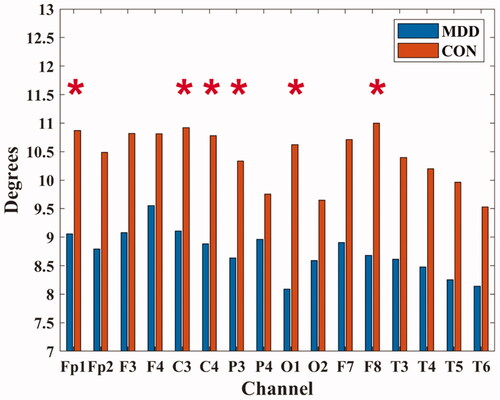
In Fp1 (MDD: 9.055 ± 3.415; CON: 10.870 ± 1.705), C3 (MDD: 9.110 ± 3.440; CON: 10.920 ± 1.069), C4 (MDD: 8.880 ± 3.669; CON: 10.780 ± 1.504), P3 (MDD: 8.635 ± 3.353; CON: 10.335 ± 1.546), O1 (MDD: 8.090 ± 4.272; CON: 10.620 ± 1.253) and F8 (MDD: 8.680 ± 3.863; CON: 11.000 ± 1.646) channels, the degrees of MDD were all lower than those of healthy people (P < 0.05), as shown in .
Figure 8. The degrees of each channel. * Significant difference between MDD patients and healthy controls.
4. Discussion
This study comprised 20 MDD patients and 20 healthy people matched by sex and age. The differences in resting-state EEG between the two groups were analyzed from the perspectives of brainwave music, nonlinear dynamics, and brain network structure. The results showed that the pitch and volume of brainwave music translated from the frontal-parietal channel of patients were higher than those of healthy people. Furthermore, the LZC in the frontal-parietal region of patients was also higher than that of healthy people, but the volume of MDD patients in the temporal region was lower than that of healthy people. In addition, in MDD, the pitch scaling exponents, volume scaling exponents and duration scaling exponents of brainwave music translated from multiple electrodes in the left brain region were significantly lower than those of healthy people, and the brain connectivity in the left brain region of patients was also weaker than that of healthy people. The results of brainwave music analysis were similar to those of two traditional EEG analysis methods, which show that brainwave music analysis can reflect the differences between MDD patients and healthy people from a new perspective.
Neuroimaging studies have shown that the prefrontal cortex, which is involved in mood regulation, is the area of the brain that makes the most difference between MDD patients and healthy people, and this brain area function impairment of MDD is quite serious and can be seen as an important therapeutic target [Citation30,Citation31]. In this study, we found that the pitch, volume, and LZC in the frontal-parietal region of MDD patients were higher than those of healthy people, indicating that the activities in the frontal region of MDD were more disordered than those in healthy people. This may result in impaired function in this area. Additionally, we found a significant positive correlation between the patients’ HAMD scores and the volume of brainwave music translated from the Fp1 channel, which suggests that this parameter may reflect the severity of depression.
Moreover, we found that the volume of brainwave music in the temporal region was significantly lower in MDD patients than in healthy people. As can be seen in , the connectivity of the temporal region in MDD was also weaker than that in healthy people. Some research has found that the temporal region is involved in the processing of executive function [Citation32]. Impairment in this area can lead to executive dysfunction; executive function is primarily concerned with the coordination of cognitive processes to ensure that they proceed in an orderly, coordinated, and purposeful manner [Citation33,Citation34]. Our study showed that the temporal region of the brain of MDD patients behaves differently from that of healthy people.
Moreover, our study found that the scaling exponents of pitch and volume in several channels in both five-tone brainwave music and seven-tone brainwave music and the duration scaling exponents in five-tone brainwave music translated from C3 and O1 channels of MDD patients were all significantly lower than those of healthy people. Studies have shown that if the scaling exponent is close to 0.5, the sequence is close to white noise, and if the scaling exponent is close to 1, the signal has a long-range power-law correlation property [Citation35], which makes music more beautiful. Our research suggests that the brainwave music of MDD is more chaotic, and the differences are mainly in the C3, O1, and T3 channels, suggesting that depressive symptoms have a greater effect on the left regions of the brain, resulting in a more chaotic distribution of activity in those regions. Additionally, and show that the left hemisphere of the patients had weak connectivity between multiple electrodes. It can be argued that it is the irregularity of the EEG signal that leads to its weak connectivity. Braun et al. [Citation36] found that adult and child patients with depression and/or psychomotor lethargy had predominantly left hemisphere lesions. In addition, our research supports this conclusion.
Listening to music can regulate mood, affect brain function, and even change the functional structure of the brain. Music intervention is a method used in medical, educational, and everyday environments with individuals and groups, often giving participants a sense of physical and mental well-being. The pleasure of active music therapy also increases the patient’s social engagement. Fachner et al. [Citation37] found that long-term music therapy significantly increased the power of alpha bands in the left frontotemporal region and the power of theta bands in the left central frontal and right parietal temporal regions and significantly decreased the Hospital Anxiety and Depression Rating Scale-Anxiety Subscale (HADS-A) scores, indicating a reduction in anxiety after music therapy. Zhu et al. [Citation38] found that the effect of music intervention was better than that of yoga and massage, and the effect of Music of Five Elements in Traditional Chinese Medicine intervention was better than that of common music. Hagemann et al. [Citation39] also found that music therapy interventions could effectively improve depressive symptoms and quality of life. In our study, brainwave music was translated from the EEG signals of the subjects, which contained unique information about the subjects. In addition, subjects can adjust their state in real time to get different brainwave music; this type of music may play a positive role in the treatment of depression. In the future, more experiments can be conducted to explore the improvement of MDD through brainwave music intervention.
This paper is the first to analyze the difference in EEG between MDD patients and healthy people using brainwave music. In addition, we found that there were significant differences in resting EEG between MDD patients and healthy people. The study of EEG in MDD will also help to discover the underlying neurophysiological mechanism of depression. Thus, it has great scientific and social significance and provides technical support for clinical diagnosis of MDD. In conclusion, brainwave music can be a useful tool for studying depression and discriminating between MDD patients and healthy people.
Disclosure statement
All Authors agree that there is no relevant conflict of interest.
Additional information
Funding
References
- American psychiatric association. Diagnostic and statistical manual. 5th ed. American Psychiatric Association, Washington, 2013.
- Huang Y, Wang Y, Wang H, et al. Prevalence of mental disorders in China: a cross-sectional epidemiological study. Lancet Psychiatry. 2019;6(6):468.
- Chen Y, Bennett D, Clarke R, et al. Patterns and correlates of major depression in Chinese adults: a cross-sectional study of 0.5 million men and women. Psychol Med. 2017;47(5):958–970.
- Zigmond A, Snaith R. The hospital anxiety and depression scale. Acta Psychiatr Scand. 1983;67(6):361–370.
- Joelle L, Gotlib I. Depression: a cognitive perspective. Clin Psychol Rev. 2018;S0272735817303914.
- Cai H, Qu Z, Li Z, et al. Feature-level fusion approaches based on multimodal EEG data for depression recognition. Information Fusion. 2020;59:127–138.
- Sharp R. The Hamilton rating scale for depression. Occup Med. 2015;65(4):340.
- Kroenke K, Spitzer R, Williams J, et al. The patient health questionnaire somatic, anxiety, and depressive symptom scales: a systematic review. Gen Hosp Psychiatry. 2010;32(4):345–359.
- Liu F, Zhu L, Fang X, et al. Evaluation of anxiety and depression in patients with functional dyspepsia with three different psychological assessment scales. Gastroenterology. 2012;17(2):106–109.
- Wang C, Zhang L, Zhang X, et al. Research progress on the specificity of resting EEG in depression. Chin J Biomed Eng. 2014;33(1):86–92.
- Zhou J, Ye J, Zhang X, et al. EEG signal analysis methods and their applications. Chin J Med Instrumentation. 2020;44(2):122–126.
- Arns M, Bruder G, Hegerl U, et al. EEG alpha asymmetry as a gender-specific predictor of outcome to acute treatment with different antidepressant medications in the randomized iSPOT-D study. Clin Neurophysiol. 2016;127(1):509–519.
- Bruder GE, Tenke CE, Warner V, et al. Electroencephalographic measures of regional hemispheric activity in offspring at risk for depressive disorders. Biol Psychiatry. 2005;57(4):328–335.
- Li Y, Tong S, Liu D, et al. Abnormal EEG complexity in patients with schizophrenia and depression. Clin Neurophysiol Shannon. 2008;119(6):1232–1241.
- Mendez M, Zuluaga P, Hornero R, et al. Complexity analysis of spontaneous brain activity: effects of depression and antidepressant treatment. J Psychopharmacol. 2012;26(5):636–643.
- Akar S, Kara S, Agambayev S, et al. Nonlinear analysis of EEGs of patients with major depression during different emotional states. Comp Biol Med. 2015;67:49–60.
- Sun C, Fei Y, Wang C, et al. Mutual information-based brain network analysis in post-stroke patients with different levels of depression. Front Hum Neurosci. 2018;12:285.
- Zhang B, Yan G, Yang Z, et al. Brain functional networks based on resting-state EEG data for major depressive disorder analysis and classification. IEEE Trans Neural Syst Rehabil Eng. 2020;(99):1–1.
- Hasanzadeh F, Mohebbi M, Rostami R. Graph theory analysis of directed functional brain networks in major depressive disorder based on EEG signal. J. Neural Eng. 2020;17(2):026010.
- Garcia-Lazaro J, Ahmed B, Schnupp J. Emergence of tuning to natural stimulus statistics along the central auditory pathway. PLOS One. 2011;6(8):e22584.
- Kenneth J, Hsu , Andrew H. Self-similarity of the "1\\/f noise" called music. In: Proceedings of the National Academy of Sciences; 1991.
- Wu D, Li C, Yao D. Scale-free music of the brain. PLOS One. 2009;4(6):e5915.
- Li X, Hu B, Sun S, et al. EEG-based mild depressive detection using feature selection methods and classifiers. Comput Methods Programs Biomed. 2016;136:151–161.
- Jung T, Makeig S, Humphries C, et al. Removing electroencephalographic artefacts by blind source separation. Psychophysiology. 2000;37(2):163–178.
- Huang Z, Zhou C. Sci-MIDI toolbox for music research 2009 IEEE International Workshop on Open-source Software for Scientific Computation (OSSC). 2009. p. 159–162.
- Fechner GT, Adler HE, Howes DH, et al. Elements of psychophysics. Holt, Rinehart and Winston; 1966. p. 113–170.
- Wu D, Li C, Yao D. An ensemble with the Chinese pentatonic scale using electroencephalogram from both hemispheres. Neurosci. Bull. 2013;29(5):581–587.
- Niki K, Hatou J, Tahara I. Structure analysis for fMRI brain data by using mutual information and interaction. IEEE. 1999;3:928–933.
- Rubinov M, Sporns O. Complex network measures of brain connectivity: uses and interpretations. Neuroimage. 2010;52(3):1059–1069.
- Drevets W. Neuroimaging studies of mood disorders. Biol Psychiatry. 2000;48(8):813–829.
- Irmen F, Horn A, Mosley P, et al. Left prefrontal connectivity links subthalamic stimulation with depressive symptoms. Ann Neurol. 2020;87(6):962–975.
- Burke S, Barnes C. Neural plasticity in the ageing brain. Nat Rev Neurosci. 2006;7(1):30–40.
- Clauset A, Newman M, Moore C. Finding community structure in very large networks. Phys Rev E Stat Nonlin Soft Matter Phys. 2004;70(6 Pt 2):066111.
- Moscovitch M, Rosenbaum R, Gilboa A, et al. Functional neuroanatomy of remote episodic, semantic and spatial memory: a unified account based on multiple trace theory. J Anat. 2005;207(1):35–66.
- Lee J, Kim D, Kim I, et al. Detrended fluctuation analysis of EEG in sleep apnea using MIT/BIH polysomnography data. Comp Biol Med. 2002;32(1):37–47.
- Braun C, Larocque C, Daigneault S, et al. Mania, pseudomania, depression, and pseudodepression resulting from focal unilateral cortical lesions. Neuropsychiatry Neuropsychol Behav Neurol. 1999;12(1):35–51.
- Fachner J, Gold C, Erkkil J. Music therapy modulates fronto-temporal activity in rest-EEG in depressed clients. Brain Topogr. 2013;26(2):338–354.
- Yuan Z, Rui W, Xt C, et al. The effect of music, massage, yoga and exercise on antenatal depression: a meta-analysis. J Affect Disord. 2021;292:592–602.
- Hagemann P, Martin L, Neme C. The effect of music therapy on hemodialysis patients' quality of life and depression symptoms. Braz. J. Nephrol. 2019;41(1):74–82.