
 ?Mathematical formulae have been encoded as MathML and are displayed in this HTML version using MathJax in order to improve their display. Uncheck the box to turn MathJax off. This feature requires Javascript. Click on a formula to zoom.
Abstract
Objective
Despite their many emerging applications, practical use of brain–computer interfaces (BCIs) is often impeded by BCI-inefficiency, that is, the failure of the technology to decode neural modulations with sufficient accuracy. Recent evidence suggests that ineffective user training, namely feeding back to the user performance metrics that do not relate to the future performance of the BCI, may be obstructing users from learning how to produce machine-discernible sensorimotor rhythm modulations. Here, we use models of human skill acquisition to design a user-training interface to address these challenges.
Approach
We presented feedback via Riemannian geometry-based user performance metrics, which were validated via BCI simulation as bearing relation to future classifier performance. We subsequently evaluated the effect of the proposed feedback on users’ interpretation of their performance.
Results
Regression models showed that the metrics accounted for 53%–62% of intersubject variation in future classification accuracy with common BCI classifiers, thereby substantiating the use of the metric to guide user training. Participants were significantly better (p < 0.05) at detecting user performance changes with Riemannian metric-based feedback than with classifier feedback.
Conclusion
Our findings suggest that the proposed metrics can be effective for both assessing and communicating user performance, and therefore, warrant further investigation.
1. Introduction
Brain–computer interfaces (BCI) enable control directly via neural activity and thus can serve as an access technology for individuals with severe motor impairments [Citation1,Citation2]. However, many users struggle to perform mental tasks, such as motor imagery, in a way that produces consistent neural patterns that can, in turn, be recognized by classification algorithms with high accuracy [Citation3–8]. This inability of classification algorithms to correctly decode user patterns with sufficient accuracy is referred to as BCI inefficiency [Citation3,Citation4,Citation8]. Despite efforts to improve computer decoding of brain signals by the way of sophisticated signal processing and classification algorithms, BCI inefficiency persists and interuser performance differences remain larger than interclassifier differences within users [Citation9–12]. Functional magnetic resonance imaging suggests that these inflated inter-participant performance variations are attributable to difficulties in performing motor imagery tasks, rather than limitations of computer decoding [Citation13].
An alternative approach to address BCI inefficiency is to improve user encoding performance [Citation5,Citation7,Citation14]. In fact, early BCIs using fixed decoding schemes [Citation15,Citation16], necessitating that users learn to modulate their brain activity to achieve BCI control. Neurofeedback studies have confirmed that users can regulate their electroencephalographic (EEG) signals with practice [Citation17–19]. However, users of early “operant conditioning”-based BCIs typically required extensive practice to reliably produce signals discernible by a fixed decoder, an issue alleviated by machine learning whereby BCI classifiers can be optimized to the specific signals of an individual user [Citation5,Citation20,Citation21]. Modern BCI training, therefore, seeks to leverage both operant conditioning and machine learning by providing users with meaningful feedback, with which they can progressively improve their neural modulation. Once user training is complete, user-specific classifiers can be optimized (in terms of maximizing accuracy) for the BCI. However, determining the type of user performance evaluation and feedback that supports user learning remains a daunting task.
1.1. Feedback that supports BCI skill development
BCI mental task skills can be characterized as procedural memories [Citation22–24], that is, memories associated with the performance of actions or skills and formed through systematic repetition [Citation25]. Models of skill development posit that skill learning is highly goal-oriented and aided by accurate and interpretable feedback [Citation26,Citation27]. During early stages of skill development, the learner must develop an understanding of how the task can be successfully performed; then, the individual components of the task can be practiced until they can be performed without conscious effort. For BCI-user training, successful mental tasks (i.e. those that produce machine-discernible EEG patterns) vary between users and are generally identified through exploration [Citation28–30]. For such exploration to be effective, extrinsic feedback should help users converge onto mental tasks that yield the best performance. Restated, to support BCI skill development, feedback should:
accurately reflect the user’s abilities;
clearly communicate any changes in the user’s task performance so that they can make informed choices about maintaining or abandoning a given mental task.
1.2. Limitations of classifier output as user feedback
At present, most BCI training paradigms derive user feedback from classifier output, that is, the predicted class to which the current EEG sample belongs. However, recent works illustrate that such feedback fails the two criteria outlined above, as classifier output does not reliably exhibit sensitivity to changes in the user’s abilities [Citation7,Citation30,Citation31] and does not communicate changes in the user’s task performance descriptively, thereby failing to advise users how to improve [Citation5,Citation6].
Jeunet et al. [Citation6] demonstrated that some individuals were unable to learn simple motor tasks when provided classifier-based feedback. Müller et al. [Citation32] demonstrated theoretical human and computer performance improvements during classifier feedback-based co-adaptation; however, successful co-adaptive improvements relied upon users employing a systematic adaptation approach that may not be intuitive, particularly to users who are unfamiliar with the mechanics of BCI classification [Citation5]. Because of this complex dual-learner problem, human and computer learning may in fact diverge [Citation32].
Although other approaches to improve user training, such as gamified training (e.g. [Citation33–36]) and alternative/augmented feedback presentation (e.g. [Citation37–40]) have been proposed, they generally still rely upon classifier-based feedback.
1.3. Classifier-unrelated feedback can support learning
Evidence suggests that user training with feedback unrelated to the BCI classifier can be effective. Hwang et al. [Citation41] presented participants with real-time heat maps of cortical activity during motor imagery practice sessions where no classifiers were used. These participants had greater intersession BCI classification accuracy than those of a control group without the practice session. Similarly, Ono et al. [Citation42] reported that after just one training session (before the introduction of a classifier), participants receiving feedback based on event-related desynchronization (ERD) strength exhibited a learning effect and produced more machine-discernible EEG signals compared to those of a control group. Faller et al. [Citation43] observed significant performance gains among participants when receiving positive reinforcement based on the value of the single most discriminatory feature of a linear discriminant analysis classifier. More recently, Duan et al. [Citation44] observed user learning when providing visual representations of similarities between task trials as quantified by Riemannian geometry-based metrics. Nonetheless, nonclassifier feedback must be improved to delineate amongst task variations (e.g. different motor imagery tasks unlike Ono et al. [Citation42] where ERD-based feedback was nonspecific), and explicitly communicate changes in user performance with reference to some stable anchors, unlike Duan et al. [Citation44] where diffusion maps between blocks of trials lacked a common reference.
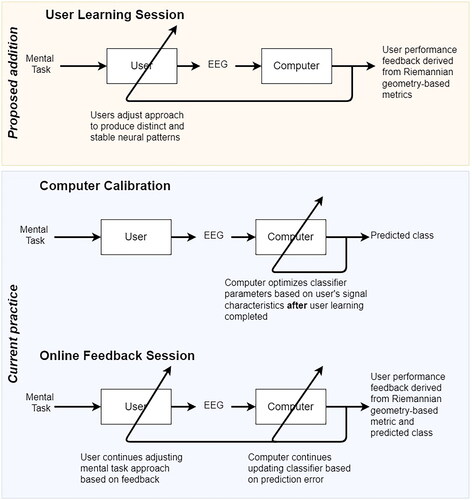
In the present study, we developed a feedback interface to address these opportunities. The interface was designed to be used within a BCI training approach which augments conventional machine learning-based BCI development (lower box in ) with an initial, dedicated user-training stage (top box in ) prior to classifier introduction. In this new user-training stage, the computer does not yet classify brain signals but simply provides feedback to guide the user towards producing more stable brain signals that are also likely to be distinct among classes (i.e. mental tasks). This approach of including a distinct user training component prior to classifier usage aligns with the human–computer interaction-inspired recommendations for BCI development and user training from Mladenović [Citation45].
Figure 1. Proposed co-adaptive BCI development protocol. Stages within the lower blue box are typically part of machine learning-based BCI development protocols. Here, we advocate for the addition of a user-training stage (upper orange box) prior to classifier introduction.
The interface presents visual representations of Riemannian geometry-based user performance metrics and is designed to be used to train users prior to classifier initialization. In accordance with the two criteria of pro-learning feedback introduced above, we evaluated this interface in two distinct parts. First, we investigated whether the Riemannian geometry user performance metrics are positively associated with future classifier accuracy and thereby ascertain whether the proposed metrics are suitable for shaping user performance. Second, we assessed whether participants could accurately interpret performance changes using the feedback.
2. Materials and methods
2.1. Do user performance metrics relate to eventual BCI accuracy?
2.1.1. User performance metrics
Central to our proposed training approach are trialwise, Riemannian geometric user performance metrics from which feedback is generated to support the early stages of user learning. In this first part of our study, we evaluated the extent to which these metrics were associated with future classifier accuracy in a simulated BCI development session.
Detailed formulations of the metrics and how they are adapted for trial-by-trial feedback can be found elsewhere [Citation31]. Briefly, a covariance matrix is computed for each multichannel EEG observation over a specific time interval. Each covariance matrix is geometrically represented as a point on a Riemannian manifold defined by the covariance between channels and variances within channels. A Riemannian distance is defined as the length of the geodesic between two points on the manifold [Citation46]. Interclass dispersion (interClassDisp) is then the Riemannian distance between the mean covariance matrices of two classes:
(1)
(1)
where
denotes the Riemannian distance and
is the mean covariance matrix for class l. Intraclass dispersion is the mean distance between covariance matrices of individual trials of a given class and the mean covariance of that class:
(2)
(2)
where
is the number of trials belonging to class l,
denotes the Riemannian distance and
is the mean covariance matrix for class l, and
is the ith trial from class l. The class distinct (classDistinct) metric is the ratio of inter- to intra-class dispersions:
(3)
(3)
while the class stability (classStability) metric is defined as:
(4)
(4)
The static forms of these metrics were originally proposed by Lotte and Jeunet [Citation7] and subsequently extended to reflect trial-by-trial changes in user performance by Ivanov and Chau [Citation31].
2.1.2. EEG data
Riemannian geometry-based user performance metrics (interClassDisp, classDistinct, classStability) and classification accuracies were computed using the motor imagery dataset from Cho et al. [Citation47], which contains EEG data from 52 participants performing 100-120 trials of left- and right-hand motor imagery tasks. Each trial consisted of a 7s recording from 64 Ag/AgCl active electrodes in a standard 10-10 EEG electrode montage. Full dataset details are provided in [Citation47].
2.1.3. Data preprocessing
All data were zero-phase filtered using fourth-order Butterworth filters with a passband of 4-38 Hz, downsampled from 512 Hz to 256 Hz, and then epoched into seven second trials with the three-second task execution window in the center of the segment. Nine electrode channels were included in our analyses: FC3, FCz, FC4, C3, Cz, C4, CP3, CPz, and CP4.
A two-stage procedure removed trials containing artifacts. First, any trials flagged as containing measurement or movement artifacts by Cho et al. [Citation47] were removed. Second, the offline Riemannian Potato Field signal quality procedure [Citation48] was applied with seven individual filters: five electrode contact loss detectors using paired electrode channels (FC3-C3, CP3-CPz, FC4-FCz, Cz-C4, and C4-CP4) bandpass filtered between 1–20 Hz and two general artifact detectors using groups of five electrodes (FC3-C3-CP3-CPz-FC4 and FC4-FCz-Cz-C4-CP4) bandstop filtered between 8–38 Hz. Each potato filter was calibrated using a subject’s entire set of trials. Any trial identified by the algorithm as containing artifacts was excluded from further analysis. Participants 12, 19, 20, 27, 29, 30, 32, 33, 34, and 49 had fewer than 90 nonartifacted trials in each class and were excluded from analysis. Finally, trials were truncated to the central two seconds of the MI task execution window.
2.1.4. Classifiers
A Riemannian minimum distance to the mean (RMDM) classifier [Citation49] was used to assess the BCI system performance. For comparison, a common spatial patterns rLDA classifier (CSP-rLDA) [Citation50] was also implemented, deploying four spatial patterns and regularization [Citation51]. For both classifiers, five-fold cross-validation using the training data was used to determine the most discriminative frequency band (8-10, 10-12, 12-18, 18-30, or 8-30 Hz) to use for the test set for each subject.
2.1.5. Statistical analysis
EEG data were split into three chronologically ordered subsets: a user evaluation set, a classifier training set, and a classifier test set, each containing 60 trials (30 per class per participant) of motor imagery tasks. User performance metrics were computed with the user evaluation set while classifiers were trained and tested with the correspondingly named data sets.
The relationship between the user evaluation metrics and classifier accuracy was modeled with linear regression. Residuals were checked for heteroscedasticity, correlation with independent variables, and nonnormality via appropriate statistical tests. No model assumptions were violated. We fit the regression models with the following candidate independent variables: interClassDisp, the mean classStability metric of both tasks, and the interaction between these variables. The classDistinct metric was highly correlated with the interClassDisp metric and thus omitted. A logarithmic transform was applied to the interClassDisp values.
Coefficients were estimated by standard least-means squares for the following equation:
(5)
(5)
Note that the independent variables were standardized to zero mean and unit variance.
2.2. How do users interpret metric-derived visual feedback?
In this second part of our study, we compared the ability of participants to infer changes in user performance while viewing videos of classifier-based and Riemannian metric-based visual feedback.
2.2.1. Riemannian metric-based visual feedback
We created a novel feedback interface () to visually communicate changes to user performance (as quantified by Riemannian geometry metrics) during BCI training. The primary concept of the proposed feedback interface was to portray the differences between tasks (interClassDisp) simultaneously with the consistency (classStability) of each class as circles on a two-dimensional plane (). Each of the circles represented one of the mental task classes. The lines connecting the centers of these task circles were the Riemannian distances between each pair of class mean covariance matrices. The radius of each circle was the average intra-task variability (i.e. inverse of classStability). From the user’s perspective, the training objective would be to minimize the overlapping area of the task circles. To achieve this objective, one could increase the distance between the centers of the circles (increase interClassDisp) or reduce the radius of the circles (increase classStability).
Figure 2. Proposed Riemannian metric-based visual feedback exemplified for a three-class scenario. (a) Visualization of user performance metrics at the beginning of a block of trials. Each circle represents a different BCI control task (labeled as class A, B, and C). The distance between circles is equal to the riemannian distance between class covariance matrices and the radius of each circle is equal to the inverse of the consistency (classStability) metric. (b) Visualization of metric changes during a block. The lines between the centers of the circles have been redrawn and color coded with red indicating decrease and green denoting increase in inter-mean distances relative to the distances at the beginning of the block (interClassDisp metric). A dashed circle represents the consistency (classStability metric) of the trials within the block with green denoting improvement and red signaling diminished consistency. In this example, class C has migrated away from classes A and B (green lines from center of C to centers of A and B), but the latter two have come closer together (red line between centers of A and B). Likewise, the consistency of classes A and B has increased (green dashed circles) while the consistency of class C has decreased (red dashed circle).
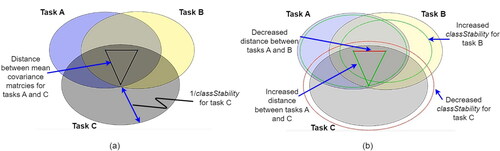
An important aspect of the feedback interface was to communicate changes relative to the beginning of a block of trials. Therefore, as new trials were completed, the task circles drawn at the beginning of the block remained visible and static, as in . To indicate changes in the distance between task covariance matrices during a block, the lines between the circle centers were redrawn and color-coded to indicate increasing (green) or decreasing (red) distance between means. The length of the redrawn line indicated the new distance between task means.
To communicate consistency changes, dashed circles represented the stability of trials within a block. A green dashed circle concentric with, but smaller than the task circle (i.e. lower variability) denoted an increase in consistency, while a red dashed concentric circle, larger than the task circle, signified a decrease in consistency (i.e. higher variability). The radius of the dashed circle reflected the magnitude of the change. An example visualization within a block is shown in . At the conclusion of a block, the user could utilize the feedback to evaluate their within-block performance relative to their prior performance. When a new block began, the visualization would be reset with the updated metric values and redrawn to resemble .
2.2.2. Classifier-based feedback
As a point of comparison, a classifier-based feedback interface () presented trial-by-trial label predictions and the actual task performed (top pane of ). Relative performance change was communicated via confusion matrices and classification accuracies for the current block (middle pane) and the session’s k − 1 previous blocks (bottom pane). We presented classifier feedback in this form rather than the bar or arrow approach [Citation5,Citation6] commonly used within the Graz BCI protocol because our investigation was exclusively focused on whether participants had the ability to infer changes in performance in the kth block of trials relative to performance in the k-1 previous blocks using only the feedback interface. The arrow or bar feedback of the Graz BCI only indicates the current prediction of the classifier, leaving users to implicitly infer performance trajectory as they perform the motor imagery tasks. The classifier-based feedback interface () we used allowed our participants to directly compare classifier statistics between the current (kth) and previous blocks to infer performance changes.
Figure 3. Classifier-based feedback interface. The interface was split into three horizontal panes. The top pane displayed the label of the most recent trial performed and its predicted class. The middle pane contained the confusion matrix for the current block. Matrix values were updated after each trial. In the bottom pane, the confusion matrix for the session prior to the current block was shown. This confusion matrix was static for the length of the video and afforded contrast between current and previous performance.
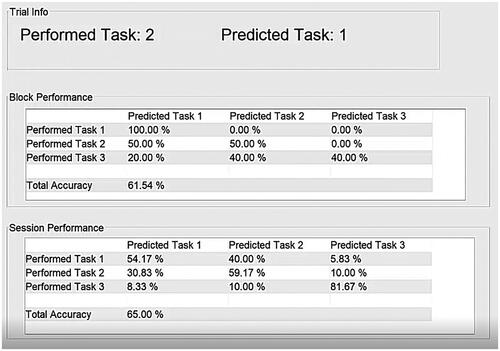
In this study, classifier feedback was derived from RMDM classifiers. These classifiers were initially trained with 45 trials per class and then retrained at the end of each block incorporating the most recent trials into the training data.
2.2.3. Participants
Eight typically developed adult participants (four female, aged 19–30 years) were recruited. None of these participants had previous experience with BCIs. All participants had normal or corrected-to-normal vision to view and read the feedback provided during the session. All study protocols were approved by the Holland Bloorview Kids Rehabilitation Hospital (REB number: 0287) and the University of Toronto (REB number: 00039652) research ethics boards. Each participant provided documented informed consent prior to participation. Due to the COVID-19 pandemic and associated local public health guidelines, all participant interaction was conducted remotely via online video conferencing.
2.2.4. EEG data and preprocessing
To evaluate the interpretability of the proposed feedback interface, we generated videos of both interfaces (visual and classifier-based) using EEG data from the: (i) BCI Competition IV-2a [Citation52], (ii) Motor Imagery [Citation53], and (iii) High Gamma Motor Execution [Citation54] datasets. Each dataset contains EEG data of multiple users performing different motor imagery or motor execution tasks. Note that the High Gamma Motor Execution dataset was included as the generated feedback is agnostic to the flavor of BCI motor task. The same preprocessing and artifact rejection was applied as in Section 2.1.3. Channels F3, Fz, F4, T3, C3, Cz, C4, T4, P3, Pz, and P4 were used for the Motor Imagery and High Gamma Motor Execution datasets while Fz, FC3, FC4, C5, C3, Cz, C4, C6, CP3, CP4, and Pz were used from the BCI Competition IV-2a dataset.
2.2.5. Feedback videos
The feedback videos were generated by simulating two and three-class BCI sessions using the above datasets. To select the feedback blocks to present to participants, two rules were used to represent expected classifier interpretation:
if the classifier’s recall (proportion of actual positives that are correctly predicted) for a block ≥ the sessional recall prior to the block, then classStability increases. Otherwise, classStability decreases.
if the classifier’s F1 score (harmonic mean of precision and recall) for a block ≥ the sessional F1 score prior to the block, then interClassDisp increases. Otherwise, interClassDisp decreases. Precision is the proportion of predicted positives that are actual positives.
In other words, trials for a particular class are considered to have become more consistent if in the most recent block, the classifier has improved upon its classification of those class-specific trials. Likewise, the distinguishability between classes is considered improved if in the most recent block, the classifier has become more sensitive and more precise. The blocks were selected such that only half of the measured interClassDisp/classStability metric changes aligned with the expected classifier interpretation. Further, blocks were selected such that the numbers of increases and decreases in each metric were balanced. Trials within the blocks were played in the same order as they were recorded.
2.2.6. Experimental protocol
To determine whether users could accurately discern changes in user performance based on Riemannian metric-derived feedback, we conducted a within-subjects, signal detection experiment [Citation55,Citation56]. Participants completed four experimental sessions, each approximately three hours in duration, on separate days. In each session, participants were shown simulated BCI feedback. In the first two sessions, participants were shown feedback for 80 blocks of a two-class BCI. Each block contained ten trials (five per class). In the third and fourth sessions, participants were shown feedback for 52 blocks of a three-class BCI. Half the participants viewed the classifier-based feedback () in sessions one and three, and the proposed visual feedback () in the second and fourth sessions. The remaining participants were presented with the complementary feedback system in each session (i.e. the visual feedback in session one, classifier feedback in session two, etc.). At the beginning of each session, participants were introduced to BCIs and the purpose of the study. The elements of the feedback interface for the session were explained to participants and their understanding was confirmed by their verbal recapitulation. Instructions were not provided about how to interpret user performance changes from the feedback.
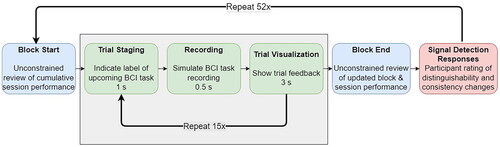
At the beginning of the video, participants were shown feedback depicting the performance of the BCI user up to the current block (e.g. the circles in or the sessional performance in ). Participants were allowed to scrutinize this information for an unconstrained amount of time before the video began (). For each trial, the interface foretold the class of the upcoming task (trial staging), followed by a simulated initiation of recording (during which participants just saw the word “recording”). Subsequently, the feedback for the trial was displayed for three seconds. This sequence of events was repeated for each trial. Upon completion of the block of trials, participants were allowed to review the block feedback for an unconstrained amount of time. The timing of the signal detection task for the three-class problem is summarized in .
Figure 4. Structure and timing of feedback signal detection task for a three-class problem (sessions 3 and 4). The structure for the two-class problem (sessions 1 and 2) was similar except that there were ten trial repetitions per block and eighty blocks.
At the conclusion of each video, participants were asked to assert on a 5-point scale from “almost certainly did not occur” to “almost certainly did occur”, whether they perceived (detected) increases or decreases in the distinguishability (interClassDisp) and consistency (classStability) of the task-related EEG relative to the beginning of the block. These ratings constituted the signal detection task responses. Increases and decreases of interClassDisp and classStability (i.e. 4 signal detection tasks in total) were considered as separate signals to mitigate misinterpretation. Responses were captured via REDCap [Citation57]. At the end of each session, participants completed a questionnaire that gauged their subjective perceptions of the feedback (). Upon completing the fourth session, participants indicated the feedback they preferred, offered more information, and was easier to use. For each question, a no preference option was also available.
Table 1. Descriptive quality and usability questionnaire. Questions D1–D6 were to assess the descriptive quality of the feedback system. U1-U4 assessed the usability of the system. Each question was rated on a 7-point Likert scale from strongly disagree to strongly agree.
2.2.7. Statistical analysis
Empirical receiver-operator characteristic (ROC) curves for each participant were generated from their signal detection task responses, with the four steps of the five-point scale acting as different classification thresholds [Citation55,Citation56]. For each signal detection task, area under the ROC curve (AUC) scores were computed for both feedback interfaces. Confidence intervals for the AUC values were computed using 1000 bootstrapped samples. Paired t-tests or Wilcoxon signed-rank tests were invoked as appropriate to detect differences in AUC scores between the two feedback interfaces as well as differences in participant survey responses.
3. Results
3.1. Association between user performance metrics and eventual BCI accuracy
The F-statistics and regression coefficient estimates for each classifier are given in . Variance inflation factors for each variable were below 2. In all cases, only the 95% confidence intervals for β1 excluded zero thereby identifying interClassDisp as the only significant explanatory independent variable. This finding was confirmed by a hierarchical regression analysis (backward step-down elimination). The regressed relationship between accuracy and inter-class dispersion is portrayed in for both classifiers. These nonlinear plots suggest that larger classifier performance gains are achieved for increases in the metric when the means of the class covariance matrices are closer together, i.e. for small values of interClassDisp. Further analysis revealed an unexpected negative correlation between interClassDisp and classStability (Kendall’s τB = −0.375, p = 0.0004), suggesting a potential interaction between the measures.
Figure 5. Classification accuracy vs. interClassDisp for RMDM (left) and CSP-rLDA (right) classifiers. Computed regression lines are superimposed in black. Blue points denote participants whose classification accuracies exceeded the upper bound of chance estimated via the cumulative binomial distribution [Citation58]; red points denote participants whose accuracy was below this threshold.
![Figure 5. Classification accuracy vs. interClassDisp for RMDM (left) and CSP-rLDA (right) classifiers. Computed regression lines are superimposed in black. Blue points denote participants whose classification accuracies exceeded the upper bound of chance estimated via the cumulative binomial distribution [Citation58]; red points denote participants whose accuracy was below this threshold.](/cms/asset/1246cb9e-269f-4eb3-8ad3-e5fb9de613bd/tbac_a_2366193_f0005_c.jpg)
Table 2. Regression of classifier accuracy to user evaluation metrics. Coefficients are tabulated with 95% confidence intervals (CI). Model fit metrics R2 and root-mean-squared error (RMSE) are also reported.
3.2. User interpretation of feedback
3.2.1. Signal detection performance
None of the participants detected interClassDisp increases in the three-class session when given classifier feedback as the 95% confidence intervals for the AUC scores did not exceed chance level. In contrast, all participants detected interClassDisp increases using visual feedback, i.e. confidence intervals uniformly approached the maximum value of 1.0 (). AUC results for the remaining detection tasks exhibited a similar dichotomy between the two types of feedback and thus are not explicitly shown here.
Figure 6. Participant AUC scores for detecting increases (left column) and decreases (right column) of the interClassDisp (top row) and classStability (bottom row) metrics during the three-class sessions with the classifier and visual feedback. AUC scores between classifier and visual feedback for interClassDisp and classStability were compared using paired t-tests and paired wilcoxon signed-rank tests, respectively; * p < 0.05, *** p < 0.001.
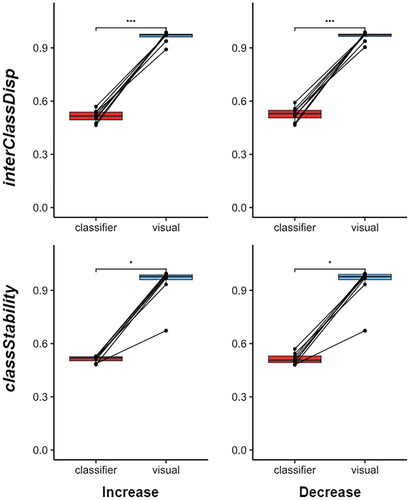
For the two-class scenario, AUC scores for the visual feedback system significantly exceeded those of the classifier feedback system for the detection of both increases (t(7) = 13.931, p < 0.0001) and decreases (t(7) = 12.900, p < 0.0001) in the difference between classes (interClassDisp). Similarly, in the three-class scenario, AUC scores for visual feedback significantly surpassed those of classifier feedback, for both the detection of increases (t(7) = 21.913, p < 0.0001) and decreases (t(7) = 20.190, p < 0.0001) in the interClassDisp metric. Likewise, participants’ detection of changes in classStability significantly differed between classifier and visual feedback in terms of AUC scores (paired Wilcoxon signed-rank test; p < 0.05, N = 8). The Wilcoxon test was invoked as AUC scores violated normality (Shapiro–Wilk; p < 0.004).
3.2.2. Survey results
In the two-class scenario, participants only perceived that the depiction of task consistency (question D2 in ) differed between feedback systems (paired Wilcoxon signed-rank; p < 0.05). However, in the three-class scenario, users generally believed that the visual feedback more clearly communicated changes in the metrics and was easier to interpret (paired Wilcoxon signed-rank; p < 0.05 for all questions except U2 and U3 which related to the quantity of information). As participants were not informed about the correctness of their interpretations, their survey responses were independent of their actual ability to detect metric changes. All participants indicated a preference for the visual feedback system, citing greater ease of use. In end-of-survey comments, the predominant opinion among participants was that the three-class session with classifier feedback was the most difficult.
4. Discussion
This study evaluated the usefulness of Riemannian metric-based visual feedback for communicating BCI user performance, with the ultimate goal of supporting training of the unskilled user. Such feedback is critical typically in the early stages of BCI development where users, especially initially poor performers, require descriptive guidance as they explore various approaches to performing the mental tasks.
4.1. Association between Riemannian metrics and classifier accuracy
confirmed that inter-class dispersion (interClassDisp) Riemannian metric values estimated from the initial trials of BCI development were in fact significantly associated with eventual BCI classification accuracies. This positive relationship may be attributable to the robustness of the Riemannian mean to spurious trial-by-trial EEG noise [Citation46,Citation49,Citation59]. As such, each mean covariance matrix likely represented the EEG features that persisted across trials of a given mental task and thus, the distance between two mean covariance matrices reflected the feature discernibility between the corresponding tasks. The nonlinearity of the classifier accuracy-interClassDisp relationship is intuitive; classification performance gains are steepest as data distributions initially separate, i.e. become differentiated from overlapping noise.
The classStability metric did not exhibit an association with classifier accuracy, likely because Riemannian distances within-class (i.e. distance between trial-by-trial covariance matrices and distance between a trial covariance and its same-class mean covariance matrix) were generally larger than those between-class by an order of magnitude. Consequently, classStability was likely dominated by uncontrolled neural activity. An adjusted intra-class dispersion measure, for example, by normalizing by inter-trial variance may mitigate the influence of random variations.
4.2. Higher classStability metric for poor performers
The observed negative correlation between classStability and interClassDisp was unexpected. Users who were unable to produce robust ERDs may have had artificially inflated classStability values simply because their EEG recordings during motor imagery did not deviate from baseline activity. In other words, intertrial variation may have been limited due to the inability to consciously modulate sensorimotor rhythms, a well-documented phenomenon [Citation3–6,Citation8]. In fact, to specifically screen for such users, Lotte and Jeunet [Citation7] proposed additional Riemannian geometry metrics (not evaluated here) for assessing signal deviation from baseline resting state EEG. Additional physiological measures, such as the SMRpredictor [Citation8,Citation60], PPfactor [Citation61], laterality index, and cortical activation strength [Citation62], have been shown to approximate user ability to suppress sensorimotor rhythms. Therefore, a more suitable metric for assessing trial consistency may be one that rewards the repeatability of trials while depending inversely on the task related deviation of brain activity from the basal state.
These results, in combination with the positive correlation between the interClassDisp metric and future classification accuracy, suggest that an effective training strategy for early stages of user training would be to encourage users to explore task strategies that result in increasing the interClassDisp metric value. Users should primarily focus on identifying task approaches that allow them to consciously modulate their neural activity and produce different patterns for each control task. Once this is achieved, then the focus of practice could shift towards improving intratask consistency and the classStability metric.
4.3. Favorable interpretation and usability of visual feedback
The Riemannian metric-based visual feedback proved more effective in communicating changes in user performance than did classifier feedback. The subjective preference for the “easier to understand” and “more efficient” visual feedback, is perhaps unsurprising given that classifier feedback has been criticized for being challenging to interpret and, at times, misleading [Citation5,Citation6]. Indeed, the participants’ interpretation of classifier feedback highlighted its pitfalls, namely, that it lacks sensitivity to user performance changes [Citation7,Citation30,Citation31] and does not facilitate reliable user interpretation [Citation5,Citation6]. In contrast, Riemannian metric-based visual feedback seemed to provide users with interpretable information. Representative visuals are known to improve human ability and motivation to understand mathematical concepts [Citation63,Citation64].
Arguably, attending to the many aspects of the visual feedback may increase a user’s cognitive load. However, this is offset by the ease of interpretation and the reduction in split attention. Conventional trial-by-trial classifier feedback typically only comprises classifier output for the most recent trial. Users must therefore invoke working memory to mentally reconcile historical and current feedback, a cognitively demanding requirement that may reduce learning capacity [Citation65,Citation66]. The visual feedback, on the contrary, affords trend information, that is, the evolution of interClassDisp and classStability, into a single image, allowing the user to focus exclusively on the present.
Survey comments from participants who viewed the Riemannian metric-based visual feedback first and the classifier second believed (incorrectly) that the latter was presenting the same information numerically as the former. Their simultaneous confidence and misinterpretation accentuate the need to provide users with careful instructions for interpreting feedback [Citation5].
4.4. Communicating the magnitude of performance changes
Classifier feedback did not capture the magnitude of user performance changes. With only 10 or 15 trials per block, the classifier results were coarse and sensitive to the outcome of a small number of trials. While increasing the number of trials per block would likely improve the ability of classifier accuracy-based metrics to reflect changes in performance, procedural learning studies suggest that near immediate feedback is required to promote task learning and long-term skill retention [Citation67–70]. Further, in online BCI training with trial-by-trial feedback, users may alter their mental strategy within blocks using only a few trials to assess each approach [Citation30]. The visual feedback was less likely to be misinterpreted due to random effects because it directly presented the magnitude of the change in the continuous metric rather than relying on inference from the proportions of class labels.
4.5. Limitations and future work
We uniformly admitted frequencies from 8-30 Hz, encompassing mu and beta rhythms typically suppressed during motor imagery. However, Lotte and Jeunet [Citation7] found that some users exhibited improvement in some metrics simultaneous with degradation in other metrics within different, narrow sub-bands. Thus, future research may consider personalized sub-bands.
The Riemannian distance increases with the number of channels [Citation7] and can eventually become numerically unstable for large covariance matrices [Citation46]. This precludes comparisons of classification performance with different numbers of electrodes. A quantification of metric stability with varying montages may be worthwhile.
Our metrics did not incorporate neurophysiological (e.g. resting state signal power [Citation60,Citation61,Citation71], entropy [Citation72], laterality index [Citation62]) or psychological (e.g. mood, fatigue, and frustration [Citation73–80]) factors known to correlate with and potentially impact BCI performance. Further development of user performance metrics ought to consider such factors to contextualize the user training experience. Some participants complained that the small magnitude of changes (encoded as the length of the line between circle centers and the dashed circle) was a source of uncertainty in interpreting the visual feedback and that they relied instead upon the color of the line or dashed circle. As the absolute numerical values of the metrics have limited meaning in isolation [Citation7,Citation46], the interface could be improved by adding performance targets, which would fulfill the “where am I going?” requirement of effective feedback [Citation81].
5. Conclusion
We evaluated Riemannian geometry-based user performance metrics and a corresponding novel visual feedback interface for user learning during BCI development. The inter-class dispersion metric (interClassDisp) emerged as having a strong association with future classification accuracy, thereby suggesting that this metric is a good candidate for guiding user training in the early stages of BCI development. Using the proposed visual feedback, BCI-naive participants were able to correctly interpret changes in the performance metrics in a simulated BCI training session with higher accuracy than with classifier-based feedback. Such feedback could guide users to quickly identify effective mental task approaches during the early exploratory phases of learning. Together, our findings suggest that visual feedback of user performance by way of Riemannian geometry metrics may facilitate BCI-user training. Future research ought to evaluate this feedback scheme during actual BCI user learning.
Disclosure statement
No potential conflict of interest was reported by the author(s).
Additional information
Funding
Notes on contributors
Nicolas Ivanov
Nicolas Ivanov received a B.A.Sc. degree in electrical engineering from the University of British Columbia in 2018 and a M.A.Sc. degree in biomedical engineering from the University of Toronto in 2020. He is currently a PhD candidate at the University of Toronto. His research focuses on user-performance assessment and user-training protocols for brain-computer interfaces, particularly for children with disabilities.
Tom Chau
Tom Chau is a Professor in the Institute of Biomedical Engineering and Distinguished Senior Scientist at Holland Bloorview Kids Rehabilitation Hospital. He holds the Raymond G. Chang Foundation Chair in Access Innovations. His research focuses on the investigation of novel access pathways to facilitate communication for children and youth with severe physical impairments. He has published over 220 refereed articles, trained 100 graduate students, and holds numerous patents, many of which have been licensed to industry. Chau’s lab has developed numerous access innovations that are being used by children and youth, locally and abroad, including: The Virtual Music Instrument, a computer vision-based software tool that allows children of all abilities to play music and a vocal fold vibration device that enables communication by humming. His lab has created a variety of brain-computer interfaces (BCIs) that facilitate communication and control through mental activities. These innovations helped to establish the first pediatric BCI clinic in the world. His lab has been featured in national and international media. His contributions to science, engineering and the quality of life of children and youth with disabilities have been recognized with various awards, including the da Vinci Award (USA), the Cathleen Lyle Murray Award (USA), Canada’s Top 40 Under 40, Dr. Jonas Salk Award, Meritorious Service Cross, the Order of Ontario and the Governor General’s Innovation Award.
References
- Wolpaw JR, Birbaumer N, McFarland DJ, et al. Brain-computer interfaces for communication and control. Clin Neurophysiol. 2002;113(6):767–791. doi: 10.1016/s1388-2457(02)00057-3.
- Neuper C, Müller GR, Kübler A, et al. Clinical application of an EEG-based brain-computer interface: a case study in a patient with severe motor impairment. Clin Neurophysiol. 2003; 114(3):399–409.
- Vidaurre C, Blankertz B. Towards a cure for BCI illiteracy. Brain Topogr. 2010; 23(2):194–198. doi: 10.1007/s10548-009-0121-6.
- Vidaurre C, Sannelli C, Müller KR, et al. Co-adaptive calibration to improve BCI efficiency. J Neural Eng. 2011;8(2):025009.
- Lotte F, Larrue F, Mühl C. Flaws in current human training protocols for spontaneous brain-computer interfaces: lessons learned from instructional design. Front Human Neurosci. 2013; 7:568.
- Jeunet C, Jahanpour E, Lotte F. Why standard brain-computer interface (BCI) training protocols should be changed: an experimental study. J of Neural Eng. 2016;13(3):036024.
- Lotte F, Jeunet C. Defining and quantifying users’ mental imagery-based BCI skills: a first step. J of Neural Eng. 2018; 15(4):046030.
- Sannelli C, Vidaurre C, Müller KR, et al. A large scale screening study with a SMR-based BCI: categorization of BCI users and differences in their SMR activity. PLoS One. 2019; 14(1):e0207351. doi: 10.1371/journal.pone.0207351.
- Luo T, Zhou C, Chao F. Exploring spatial-frequency-sequential relationships for motor imagery classification with recurrent neural network. BMC Bioinform. 2018; 19(1):344.
- Lawhern VJ, Solon AJ, Waytowich NR, et al. EEGNet: a compact convolutional neural network for EEG-based brain-computer interfaces. J Neural Eng. 2018; 15(5):056013.
- Sakhavi S, Guan C, Yan S. Learning temporal information for brain-computer interface using convolutional neural networks. IEEE Trans Neural Netw Learn Syst. 2018; 29(11):5619–5629.
- Li Y, Zhang XR, Zhang B, et al. A channel-projection mixed-scale convolutional neural network for motor imagery EEG decoding. IEEE Trans Neural Syst Rehabil Eng. 2019;27(6):1170–1180.
- Zich C, Debener S, Kranczioch C, et al. Real-time EEG feedback during simultaneous EEG-fMRI identifies the cortical signature of motor imagery. Neuroimage. 2015;114:438–447. doi: 10.1016/j.neuroimage.2015.04.020.
- Jeunet C, N’Kaoua B, Lotte F. Advances in user-training for mental-imagery-based BCI control: psychological and cognitive factors and their neural correlates. In: Coyle D, editor. Progress in brain research. Amsterdam: Elsevier; 2016. p. 3–35. pdoi: 10.1016/bs.pbr.2016.04.002.
- Birbaumer N, Ghanayim N, Hinterberger T, et al. A spelling device for the paralysed. Nature. 1999;398(6725):297–298. doi: 10.1038/18581.
- Wolpaw J, McFarland D, Vaughan T. Brain-computer interface research at the Wadsworth Center. IEEE Trans Rehabil Eng. 2000; 8(2):222–226.
- Kondo T, Saeki M, Hayashi Y, et al. Effect of instructive visual stimuli on neurofeedback training for motor imagery-based brain-computer interface. Human Mov Sci. 2015; 43:239–249.
- Ono T, Tomita Y, Inose M, et al. Multimodal sensory feedback associated with motor attempts alters BOLD responses to paralyzed hand movement in chronic stroke patients. Brain Topogr. 2015; 28(2):340–351. doi: 10.1007/s10548-014-0382-6.
- Ono Y, Wada K, Kurata M, et al. Enhancement of motor-imagery ability via combined action observation and motor-imagery training with proprioceptive neurofeedback. Neuropsychologia. 2018;114:134–142. doi: 10.1016/j.neuropsychologia.2018.04.016.
- Pfurtscheller G, Neuper C. Motor imagery and direct brain-computer communication. Proc IEEE. 2001;89(7):1123–1134. doi: 10.1109/5.939829.
- Blankertz B, Dornhege G, Krauledat M, et al. The Berlin brain-computer interface: EEG-based communication without subject training. IEEE Trans Neural Syst Rehabil Eng. 2006; 14(2):147–152.
- Kober SE, Witte M, Ninaus M, et al. Learning to modulate one’s own brain activity: the effect of spontaneous mental strategies. Front Human Neurosci. 2013; 7:695.
- Hiremath SV, Chen W, Wang W, et al. Brain computer interface learning for systems based on electrocorticography and intracortical microelectrode arrays. Front Integrative Neurosci. 2015; Jun;9:40.
- Casimo K, Weaver KE, Wander J, et al. BCI use and its relation to adaptation in cortical networks. IEEE Trans Neural Syst Rehabil Eng. 2017; 25(10):1697–1704.
- Eichenbaum H. Learning and memory. New York (NY): W. W. Norton & Co; 2008. 1st ed.
- Fitts PM, Posner MI. Human performance. Belmont (CA): Brooks/Cole; 1967.
- Anderson JR. Acquisition of cognitive skill. Psychol Rev. 1982; 89(4):369–406.
- Vidaurre C, Kawanabe M, von Bünau P, et al. Toward unsupervised adaptation of LDA for brain-computer interfaces. IEEE Trans Biomed Eng. 2011; 58(3):587–597.
- Friedrich EVC, Neuper C, Scherer R. Whatever works: a systematic user-centered training protocol to optimize brain-computer interfacing individually. PLoS One. 2013; 8(9):e76214. doi: 10.1371/journal.pone.0076214.
- Nguyen CH, Karavas GK, Artemiadis P. Adaptive multi-degree of freedom brain computer interface using online feedback: towards novel methods and metrics of mutual adaptation between humans and machines for BCI. PLoS One. 2019; 14(3):e0212620. doi: 10.1371/journal.pone.0212620.
- Ivanov N, Chau T. Riemannian geometry-based metrics to measure and reinforce user performance changes during brain-computer interface user training. Front Comput Neurosci. 2023;17:1108889.
- Müller JS, Vidaurre C, Schreuder M, et al. A mathematical model for the two-learners problem. J of Neural Eng. 2017;14(3):036005.
- Scherer R, Schwarz A, Müller-Putz GR, et al. Game-based BCI training: interactive design for individuals with cerebral palsy. 2015 IEEE International Conference on Systems, Man, and Cybernetics; 2015 Oct 9-12. Hong Kong, China. New York (NY): IEEE; 2015. 3175–3180.
- Perdikis S, Tonin L, Saeedi S, et al. The cybathlon BCI race: successful longitudinal mutual learning with two tetraplegic users. PLoS Biol. 2018; 16(5):e2003787. doi: 10.1371/journal.pbio.2003787.
- da Silva-Sauer L, Valero-Aguayo L, Velasco-Alvarez F, et al. A shaping procedure to modulate two cognitive tasks to improve a sensorimotor rhythm-based brain-computer interface system. Span J Psychol. 2018; 21: e 44.
- Benaroch C, Sadatnejad K, Roc A, et al. Long-term BCI training of a tetraplegic user: adaptive Riemannian classifiers and user training. Front Human Neurosci. 2021; Mar15:635653.
- Neuper C, Scherer R, Wriessnegger S, et al. Motor imagery and action observation: modulation of sensorimotor brain rhythms during mental control of a brain-computer interface. Clin Neurophysiol. 2009; 120(2):239–247.
- Alimardani M, Nishio S, Ishiguro H. Effect of biased feedback on motor imagery learning in BCI teleoperation system. Front Syst Neurosci. 2014; 8:52.
- Škola F, Liarokapis F. Embodied VR environment facilitates motor imagery brain-computer interface training. Comput & Graph. 2018; 75:59–71.
- Zapała D, Francuz P, Zapała E, et al. The impact of different visual feedbacks in user training on motor imagery control in BCI. J of Appl Psychophysiol Biofeedback. 2018;43:23–35.
- Hwang HJ, Kwon K, Im CH. Neurofeedback-based motor imagery training for brain-computer interface (BCI). J of Neurosci Methods. 2009; 179(1):150–156.
- Ono T, Kimura A, Ushiba J. Daily training with realistic visual feedback improves reproducibility of event-related desynchronisation following hand motor imagery. Clin Neurophysiol. 2013; 124(9):1779–1786. doi: 10.1016/j.clinph.2013.03.006.
- Faller J, Vidaurre C, Solis-Escalante T, et al. Autocalibration and recurrent adaptation: towards a plug and play online ERD-BCI. IEEE Trans Neural Syst Rehabil Eng. 2012; 20(3):313–319.
- Duan X, Xie S, Xie X, et al. An online data visualization feedback protocol for motor imagery-based BCI training. Front in Human Neurosci. 2021; 15:625983.
- Mladenović J. Standardization of protocol design for user training in EEG-based brain-computer interface. J of Neural Eng. 2021;18(1):011003.
- Congedo M, Barachant A, Bhatia R. Riemannian geometry for EEG-based brain-computer interfaces; a primer and a review. Brain-Computer Interfaces. 2017;4(3):155–174. doi: 10.1080/2326263X.2017.1297192.
- Cho H, Ahn M, Ahn S, et al. EEG datasets for motor imagery brain-computer interface. Gigascience. 2017;6(7):1–8. doi: 10.1093/gigascience/gix034.
- Barthélemy Q, Mayaud L, Ojeda D, et al. The Riemannian potato field: a tool for online signal quality index of EEG. IEEE Trans Neural Syst Rehabil Eng. 2019;27(2):244–255.
- Barachant A, Bonnet S, Congedo M, et al. Multiclass brain-computer interface classification by Riemannian geometry. IEEE Trans Biomed Eng. 2011;59(4):920–928.
- Blankertz B, Tomioka R, Lemm S, et al. Optimizing spatial filters for robust EEG single-trial analysis. IEEE Signal Process Mag. 2007;25(1):41–56.
- Ledoit O, Wolf M. A well-conditioned estimator for large-dimensional covariance matrices. J Multivar Anal. 2004;88(2):365–411.
- Tangermann M, Müller KR, Aertsen A, et al. Review of the BCI competition IV. Front Neurosci. 2012; 6:21084.
- Kaya M, Binli MK, Ozbay E, et al. A large electroencephalographic motor imagery dataset for electroencephalographic brain computer interfaces. Sci Data. 2018; 5(1):180211. doi: 10.1038/sdata.2018.211.
- Schirrmeister RT, Springenberg JT, Fiederer LDJ, et al. Deep learning with convolutional neural networks for EEG decoding and visualization. Human Brain Mapp. 2017;38(11):5391–5420.
- Swets JA. Signal detection theory and ROC analysis in psychology and diagnostics: collected papers. New York (NY): Psychology Press; 2014.
- Stanislaw H, Todorov N. Calculation of signal detection theory measures. Behav Res Methods, Instrum, Comput. 1999;31(1):137–149.
- Harris PA, Taylor R, Minor BL, et al. The REDCap consortium: building an international community of software platform partners. J Biomed Inform. 2019;95:103208.
- Müller-Putz G, Scherer R, Brunner C, et al. Better than random? A closer look on BCI results. Int J of Bioelectromagn. 2008;10(1):52–55.
- Yger F, Berar M, Lotte F. Riemannian approaches in brain-computer interfaces: a review. IEEE Trans on Neural Syst and Rehabil Eng. 2016;25(10):1753–1762.
- Blankertz B, Sannelli C, Halder S, et al. Neurophysiological predictor of SMR-based BCI performance. Neuroimage. 2010;51(4):1303–1309. doi: 10.1016/j.neuroimage.2010.03.022.
- Ahn M, Cho H, Ahn S, et al. High theta and low alpha powers may be indicative of BCI-illiteracy in motor imagery. PLoS One. 2013;8(11):e80886. doi: 10.1371/journal.pone.0080886.
- Shu X, Chen S, Yao L, et al. Fast recognition of BCI-inefficient users using physiological features from EEG signals: a screening study of stroke patients. Front in Neurosci. 2018; 12:307371.
- Boaler J. Mathematical mindsets: unleashing students’ potential through creative math, inspiring messages and innovative teaching. San Francisco (CA): John Wiley & Sons; 2015.
- Daly I, Bourgaize J, Vernitski A. Mathematical mindsets increase student motivation: Evidence from the EEG. Trends Neurosci Educ. 2019;15:18–28.
- Tarmizi RA, Sweller J. Guidance during mathematical problem solving. J of Educ Psychol. 1988;80(4):424–436.
- Paas F, van Merriënboer JJ. Cognitive-load theory: methods to manage working memory load in the learning of complex tasks. Curr Dir Psychol Sci. 2020; 29(4):394–398.
- Abe M, Schambra H, Wassermann EM, et al. Reward improves long-term retention of a motor memory through induction of offline memory gains. Curr Biol. 2011; 21(7):557–562.
- Galea JM, Mallia E, Rothwell J, et al. The dissociable effects of punishment and reward on motor learning. Nature Neurosci. 2015;18(4):597–602.
- Widmer M, Ziegler N, Held J, et al. Rewarding feedback promotes motor skill consolidation via striatal activity. Progress in brain research. Amsterdam: Elsevier; 2016. p. 303–323. doi: 10.1016/bs.pbr.2016.05.006.
- Perrin E, Venance L. Bridging the gap between striatal plasticity and learning. Curr Opin in Neurobiol. 2019; 54:104–112.
- Ahn M, Ahn S, Hong JH, et al. Gamma band activity associated with BCI performance: simultaneous MEG/EEG study. Front in Human Neurosci. 2013; 7:848.
- Zhang R, Xu P, Chen R, et al. Predicting inter-session performance of SMR-based brain-computer interface using the spectral entropy of resting-state EEG. Brain Topogr. 2015; 28(5):680–690. doi: 10.1007/s10548-015-0429-3.
- Burde W, Blankertz B. Is the locus of reinforcement a predictor of brain-computer interface performance?. In: Müller-Putz GR, Brunner C, Leeb R, Scherer R, Schlögl A, Wriessnegger S, Pfurtscheller G, editors. Proceedings of Third International Brain-Computer Interface Workshop and Training Course; 2006 Sep 21-24. Graz, Austria. Graz: Technischen Universität Graz; 2006. 76–77.
- Hammer EM, Halder S, Blankertz B, et al. Psychological predictors of SMR-BCI performance. Biol Psychol. 2012; Jan89(1):80–86.
- Witte M, Kober S, Ninaus M, et al. Control beliefs can predict the ability to up-regulate sensorimotor rhythm during neurofeedback training. Front Human Neurosci. 2013; 7:478.
- Ahn M, Jun SC. Performance variation in motor imagery brain-computer interface: a brief review. J Neurosci Methods. 2015; 243:103–110.
- Myrden A, Chau T. Effects of user mental-state on EEG-BCI performance. Front Human Neurosci. 2015; 9:308.
- Kleih SC, Kübler A. Psychological factors influencing brain-computer interface (BCI) performance. 2015 IEEE International Conference on Systems, Man, and Cybernetics; 2015 Oct 9-12. Hong Kong, China. New York (NY): IEEE; 2015. p. 3192–3196.
- Ahn M, Cho H, Ahn S, et al. User’s self-prediction of performance in motor imagery brain-computer interface. Front in Human Neurosci. 2018;12:59.
- Rimbert S, Gayraud N, Bougrain L, et al. Can a subjective questionnaire be used as brain-computer interface performance predictor? Front in Human Neurosci. 2019; 12:529.
- Hattie J, Timperley H. The power of feedback. Rev Educ Res. 2007;77(1):81–112.