
 ?Mathematical formulae have been encoded as MathML and are displayed in this HTML version using MathJax in order to improve their display. Uncheck the box to turn MathJax off. This feature requires Javascript. Click on a formula to zoom.
Abstract
This paper applies economic concepts from measuring income inequality to an exercise in assessing spatial inequality in cancer service access in regional areas. We propose a mathematical model for accessing chemotherapy among local government areas (LGAs). Our model incorporates a distance factor. With a simulation we report results for a single inequality measure: the Lorenz curve is depicted for our illustrative data. We develop this approach in order to move incrementally towards its application to actual data and real-world health service regions. We seek to develop the exercises that can lead policy makers to relevant policy information on the most useful data collections to be collected and modeling for cancer service access in regional areas. Inequality
Keywords:
1. Introduction
Over the past few decades, we have seen continuous improvement in cancer survival rates through new and improved cancer treatments, and improved quality of care for complex procedures. This provides a strong argument in policy debate to support the centralisation of complex cancer treatment and care. On one hand, centralised care helps improve quality of care, but on the other hand, centralised care would increase spatial inequalities in patient access (Huguet, Citation2020). In a study across 478 Statistical Local Areas (SLAs) in Queensland, spatial inequality was found to lead to worse premature deaths due to non-diagnostic cases (Cramb et al., Citation2012).
Access to treatment is an interesting topic in cancer services research (Zhang & Kanbur, Citation2005). Cancer treatment often involves three major types of therapy: surgery, chemotherapy and radiotherapy. Each type of therapy can present a different accessibility issue in regional areas as different travel patterns may be needed in order to utilise cancer therapy. “Accessibility” is on the minds of cancer service users and providers as service users can experience spatial or geographic inequalities (Gordon-Dseagu, Citation2008).
There is established literature in economics on measuring inequality, although the variable that is mostly the subject of inequality measurement is income (Amiel & Cowell, Citation1999; Cowell, Citation2011). People with cancer can experience economic inequalities in cancer treatment beyond income inequality. For cancer treatment inequality, some of the relevant questions for measuring inequality can change from those asked about income inequality (Williams & Doessel, Citation2006). This shift in research focus is in part because many countries have health insurance schemes now and they ease burdens borne by cancer service users and providers from the price/s paid and received for cancer services. Another type of inequality burden that cancer service users can experience is physically accessing services for cancer treatment (Gordon-Dseagu, Citation2008).
This paper applies some ideas from measuring inequalities in economics to assessing spatial inequalities in cancer service utilisation. Some of the inequality measures often applied, such as depicting a Lorenz curve or calculating a Gini coefficient or Atkinson Measure (Chan et al., Citation2019) are relevant measures initially, but we wish to focus on the variable that we seek to measure, viz. utilisation/cancer incidence. In cancer service accessibility, there is a need for a particular commodity that is a service, and services may not be delivered to shops and supermarkets where they can be bought, as is the case when people purchase goods like bread, apples, shoes, cars, etc., all of which are final products. Services can often be different from goods: people in need of a service need to travel to the point of service production. With cancer treatment, the geographic distribution of cancer service production locations may not perfectly correspond to the geographic pattern of cancer incidence. Thus, spatial inequalities in service access may develop.
In the case of cancer in regional areas, the level of service utilisation in an area relative to the cancer incidence for that area may be a phenomenon warranting better measurement. Data on incidence exist, and there are also publicly available data on service utilisation in regional areas. These are hospital separation data. With existing data, we examine how these data can inform policy, and ask what other data may need to be collected and which variables need to be measured and modelled to inform policy makers usefully. The ultimate purpose is that policy makers are better informed about the problem of spatial inequality in cancer service access in regional areas.
The aim of our paper is to develop an exploratory model of spatial inequality in access to cancer services using the measure/s that we investigate, which are developed from available data. The measure of cancer service access used here is the ratio of separation/incidence and we seek to explore this measure for a single health service region in Victoria, Australia.
In this exploratory study, we measure spatial inequality in accessing chemotherapy only, as the initial exercise with the purpose of guiding further studies. Future work can model the data publicly available for all three main cancer therapies by health service regions, viz. chemotherapy, radiotherapy, and surgery.
The Victorian Department of Health and Human Services delineates five rural health service regions for the State of Victoria: Hume, Gippsland, Barwon South Western, Loddon Mallee and Grampians. These five regions exist in addition to the metropolitan health service areas. Each of these regions is composed of several Local Government Areas (LGAs). We develop our modelling and simulation tools on illustrative data for a hypothetical health service region having 13 LGAs. The initial exercise here will not incorporate data on the important distinction that exists within the institutional framework of the Australian health system. viz. between publicly- and privately-funded hospital services and where these services are located. This distinction affects the prices paid and received in regard to health service utilisation in Australia and, in turn, the spatial distribution of cancer service accessibility; however, for the hypothetical exercise here, modelling data on that distinction is not vital.
2. Modelling spatial inequality in access to cancer services
The “separation” is a measure of service utilisation. A separation from hospital for chemotherapy occurs when a patient leaves a hospital. One patient having a course of chemotherapy may be involved in several separations. The following data are collected and publicly available for chemotherapy: (1) Incidence (number of new cases) of all cancers in each LGA in a year. (2) Number of same day separations for chemotherapy for the year generated by patients in the LGA. (3) Number of patients from each LGA who used chemotherapy during the year.
2.1. Chemotherapy service utilisation data
The core of this paper borrows ideas from research in inequality. Cowell states that three features of the model must be defined (Cowell, Citation2011):
The unit of analysis such as a single person, the nuclear or the extended family.
The attribute to be measured such as income, wealth, land-ownership, voting strength or, as in this case, access to cancer treatment.
A method of representation or aggregation of the allocation of the attribute among the persons in a given population.
The unit of analysis in this study is a person diagnosed with cancer needing chemotherapy, but the available data are grouped at LGA level. The attribute subject to the inequality being measured is spatial access to chemotherapy. The method for representing this inequality is to be a Lorenz curve only. Reporting results for only one or two measures of economic inequality is insufficient for policy information affecting economic welfare (Williams & Doessel, Citation2006); however, given these are initial results, the visual impact of the Lorenz affords a useful representation, in the space available, of the inequality under study. To explain our method, we first define the following variables:
: Utilisation of cancer services
: Number of LGAs
: LGA index,
: Incidence count at
: Target (normal) separation count at
: Actual separation count at
: Actual separation-to-incidence ratio at
Ideally any cancer patient who requires treatments should have no trouble accessing the required services. Under such ideal circumstance, it is reasonable to assume that the average number of separations required per new incidence is an upper bound value for any LGA if no over service is provided. Therefore, where
is a constant multiplier. In reality, the utilisation of cancer services can be affected by many factors, such as cost, travel distance and time, and available modes of transport. These negative factors simply decrease the actual separation-to-incidence ratio as some patients would have difficulty in accessing services. To include this effect in the model, the actual separation count,
, at an LGA is formulated as
where
is the distance from
to its nearest hospital; and
is a function to model the distance effect. For our study, the function
chosen is shown in Figure .
As a measure of utilisation, the actual separation-to-incidence ratio, , can be determined as
. In reality, chemotherapy is not necessarily prescribed for every cancer. The separation-to-incidence ratio,
, indicates that for every single cancer incidence, there will be
one day chemotherapy separation on average. We do not assume that all cancer incidence is treated with chemotherapy. In practice, if both the
and
data values are available, they can be used directly in the calculation of
, without the need of using
. Once we have the
value for each
, the next step is to calculate the coordinates of the Lorenz curve. The calculations are given as follows:
Cumulative proportion of LGAs with utilisation less than
, is given as
Cumulative proportion of utilisation for LGAs with utilisation less than
, is given as
Lorenz curve for
, is given as
In the next section, a simulation example will be provided to illustrate the method.
3. A simulation example
This section presents an example designed based on data that are available in the category of same day chemotherapy. The full set of hypothetical data is provided in Table . Thirteen LGAs (A to M) are located linearly with only one hospital in the middle (LGA G) that provides same day chemotherapy service to the people in all LGAs. The population of the LGAs ranges from 10 thousand to over 6 million people, Figure . These populations are typical for a regional city and a very large city. Based on the data available from the AIHW (Australian Institute of Health and Welfare, Citation2018), the following assumptions are made:
Figure 1. Hypothetical simulation data.
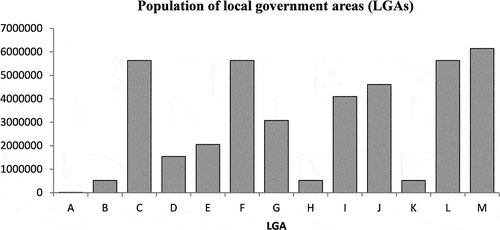
Table 1. Hypothetical simulation data
incidence rate is 529.1 per 100,000 people for all cancers in each LGA.
the facility located in G has sufficient resources to treat all the patients.
the estimated ratio of separation to incidence, C, is set to a value of 0.6.
the chemotherapy service is 100% accessible if the patient is located within a distance of 150 km, equivalent to a travel distance of 300 km for each treatment. The accessibility reduces as the patients are farther away from the facility. Distance is used in a loose sense to include all factors that affect accessibility.
The function of the distance factor that impacts the utilisation of chemotherapy is shown in Figure . By using EquationEq. (1)(1)
(1) and (Equation2
(2)
(2) ), the coordinates
and
used for plotting the Lorenz curve are given in Table . The Lorenz curve showing the distribution of utilisation of chemotherapy among the 13 LGAs is shown in Figure . The 45° line represents the ideal perfect equality that all LGAs receive the same level of one day chemotherapy service.
Figure 2. Distance factor.
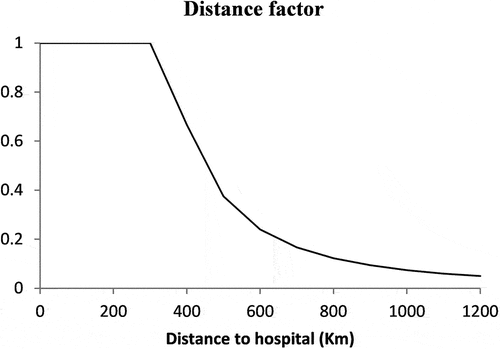
Figure 3. Lorenz curve for the 13 LGAs (A-M).
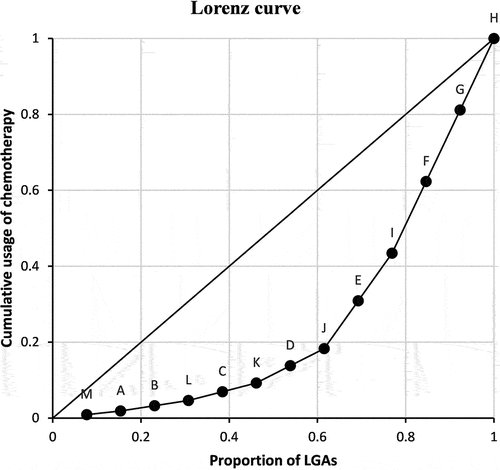
Table 2. Data for plotting the Lorenz curve
4. Results and discussion
The example demonstrates how inequality in utilisation of health services is modelled and how the Lorenz curve is constructed from the hypothetical data, which is designed in a way that comparisons can be easily made to verify if the proposed method accurately reflects the service utilisation for the LGAs.
Three large LGAs {L, C, F} are assigned the same population size of 5631, but a different travel distance of 1000, 800, and 200, respectively. On the Lorenz curve, these three equal-sized LGAs are ranked in ascending order, reflecting travelling distance to the hospital from high to low, and therefore, utilisation from low to high.
Three very small LGAs {B, K, H} are assigned the same population size of 521, but a different travel distance of 1000, 800, and 200, respectively. On the Lorenz curve, these three equal-sized LGAs show a similar ascending order, reflecting similar accessibility and utilisation from low to high. A comparison of the two scenarios (large and small LGAs) confirms that the Lorenz curve correctly reflects better spatial accessibility (shorter travel distance) results in higher service utilisation, regardless of population size. The Lorenz curve also demonstrates that the service utilisation is not equally distributed among the 13 LGAs.
To further confirm the validity of the proposed method, we make comparisons of two LGAs, one large and one small, equal distanced from the hospital in G. These large and small pairs include {A, M}, {B, L}, {D, J}, and {E, I}. On the Lorenz curve, these pairs are ranked in the same order, located side by side on the Lorenz curve, reflecting that they have the same accessibility and utilisation. In summary, the above observations have shown that the Lorenz curve is a valid measure to visually display spatial inequality among LGAs.
5. Conclusion
In our approach, accessibility and utilisation are measured and related to the travel distance and separation-to-incidence ratio, respectively. Data of separation numbers and incidence rates can be obtained easily in most hospitals. It is practical to use the separation-to-incidence ratio as a basis for measuring inequality in health service accessibility.
The simulation model can be developed further and applied to compare current access of cancer services, or to provide insights for policy makers in future planning by evaluating solutions with alternative or additional facilities.
Disclosure statement
No potential conflict of interest was reported by the author(s).
Additional information
Funding
Related Research Data
References
- Amiel, Y., & Cowell, F. A. (1999). Thinking about inequality: Personal judgments and income distributions. Cambridge University Press.
- Australian Institute of Health and Welfare (2018), ACIM (Australian cancer incidence and mortality) books [monograph on the internet]. AIHW. http://www.aihw.gov.au/cancer/. Accessed 27 October 2018
- Chan, K. C., Lenard, C. T., Mills, T. M., & Williams, R. F. G. (2019). Measuring inequality in society. Communications in Statistics - Theory and Method, 48(1), 88–8. https://doi.org/10.1080/03610926.2018.1501486
- Cowell, F. A. (2011). Measuring Inequality. Oxford University Press.
- Cramb, S. M., Mengersen, K. L., Turrell, G., & Baade, P. D. (2012). Spatial inequalities in colorectal and breast cancer survival: Premature deaths and associated factors. Health & Place, 18(6), 1412–1421. https://doi.org/10.1016/j.healthplace.2012.07.006
- Gordon-Dseagu, V. (2008). Cancer and health inequalities: An introduction to current evidence. Cancer Research UK.
- Huguet, M. (2020). Centralization of care in high volume hospitals and inequalities in access to care. Social Science & Medicine, 260, 113177. https://doi.org/10.1016/j.socscimed.2020.113177
- Williams, R. F. G., & Doessel, D. P. (2006). Measuring inequality: Tools and an illustration. International Journal for Equity in Health, 5(5). https://doi.org/10.1186/1475-9276-5-5
- Zhang, X., & Kanbur, R. (2005). Spatial inequality in education and health care in China. China Economic Review, 16(2), 189–204. https://doi.org/10.1016/j.chieco.2005.02.002