
Abstract
Health and safety issues have always been a major problem and concern in the construction industry. Although substantial improvements in construction safety have achieved in the past decades, the industry lags other industries on safety. Therefore, this research is to explore the worker’s behaviour about safety performance, mainly focusing on worker’s competence mediated by safety orientation on safety performance. A questionnaire survey was used for this study validated by the experts. In all, 600 respondents were randomly selected from government and private construction industries and yielded a response rate of 430 (71.6%). Additionally, correlational analysis and structural equation modeling (SEM) were used to examine the research hypotheses. The finding showed that worker’s competence has a significant impact on safety performance. Indeed, safety orientation mediated the relationship between worker competence and safety performance. Thus, this study carries values to the Sustainable Development Goals (SDG) such as goal 3 (SDG 3) that tries to enhance the good health & well-being of the societies and workplace through the investigation of the effective factors on the safety performance of the construction industry. Ultimately, the findings of this study contribute to the achievement of Sustainable Development Goal 8 (SDG 8) through encouraging the entrepreneurship as are effective measures to eradicate or decrease forced labour, slavery, and incompetent worker at the workplace (focusing on behavioural aspects). In this regard, the goal is to achieve full and productive employment and decent work, for all women and men by 2030.
1. Introduction
Safety at work is a complex phenomenon, and the subject of safety attitudes and safety performance in the construction industry is even more complicated. The risk of a fatality in the construction industry is five times more likely than in a manufacturing-based industry (Nguyen et al., Citation2022). Further, the risk of an injury is two and a half times higher. Throughout the world, the business environment within which construction sectors operate continues to change quickly (Masila, 2016). Indeed, the organisations failing to adapt and respond to the complexity of the new environment tend to experience survival problems.” Likewise, as stated by Higiro, Mbabazi, and Kibachia (2015), with increasing higher users’ requirements, increasing the amount of construction, environmental awareness, and limited resources on one side, and increased competition for the construction business marketplace on the other side, contractors should be capable of continuously improving their safety performance. Despite having sophisticated safety and health regulations in many countries, high rates of accident and fatality still persist. The consequences of work-related injury and illness go beyond employeesin fact, these are extended to their families, businesses, and economy in general. It is discovered that, even, in some developed countries, construction industry is still considered as one of the most dangerous industries in terms of the accident rate. For instance, “in 2017, over 73,000 non-fatal injuries were reported in the United States of America’s construction industry (Hatami, Khanjani, Alavinia, & Ravandi, 2017). In addition, in New Zealand, over 12% of non-fatal injuries (155,566 injuries) have occurred in the construction industry between 2003 and 2018, while only 7.8% of workers were working in the construction industry during that specific period (Ghodrati, Yiu, Wilkinson, & Shahbazpour, 2018). The same scenario can be seen for the construction industry in Iran. Data showed from 2009 to 2018, there were 9625 human-life losses due to occupational accidents. According to Iran Social Security Statistics (ISSS), approximately 37% of all industrial accidents (including fatalities and lost time accidents) occur in the construction industry (Amiri, Ardeshir, & Zarandi, 2014; Ghanbari, Ashtarian, & Yarmohammadi, 2017). In addition, the Labour Relations Department at the Ministry of Labour reported 1518 construction accidents between 2009 and 2018 that 16% of these accidents led to death and 70% led to injury and damages. Indeed, although less than 12% of Iranian workers are active in constructions, the severity of injuries is very high. Therefore, it is important to have a national strategic plan to improve safety at workplace and to reduce injury and fatality in the construction industry.
To precisely measure safety performance, it is important to consider all aspects of safety behaviors rather than only looking at mere instances in which specific behaviors would result in an accident or cause an injury. For instance, it can be more beneficial for policymakers and practitioners to investigate the factors that can affect employees’ orientation toward safety. It is important to note that accusing employees of being the main cause of accidents at workplace without investigating all psychological and behavioral angles provides an imperfect information on safety performance. It is very important to find out why some workers tend to have unsafe behavior in the workplace? Additionally, what factors can affect the orientation of the worker towards safety. Knowing all these answers gives the management the necessary ability to understand and predict worker behavior when they face risky conditions. Unfortunately, this topic has been ignored in construction industry. It cannot be ignored that an unqualified worker can make many disasters in the workplace that impose massive costs on management, society, or even government. Furthermore, emphasizing the behavioral and psychological aspects of the safety can open a new window to the personnel selection, those who are qualified enough to perform the job. To precisely measure safety performance, it is important to consider all aspects of safety behaviors rather than only looking at mere instances in which specific behaviors would result in an accident or cause an injury. There is a lack of research on occupational accidents in the construction industry, especially in factors influencing safety performance in Iran. These factors are vital to be discovered as they would help to reduce the rate of the accident. Thus, this study has been conducted to fill this gap.
Additionally, for years, safety scholars have discussed the gaps and issues among the key factors affecting safety performance. These issues can be related to the managerial, organisational, or individual levels. According to Priyadarshani et al. (2013), the impact of the socio-economic and technical factors can be linked to the level of site safety performance. The authors further contend that safety performance is also associated with hiring qualified workers and appointing a trained safety representative. A successful construction project not only depends on the quality of the building, the timeline or costs but also on whether or not it achieves set safety performance goals. In this regard, previous safety literature has paid particular attention to the lack of a qualified workforce in the construction industry. Managers who have realised the importance of safety performance in increasing organisational productivity have specific endeavours to implement the appropriate personnel selection system, which helps hire competent workers (Moon et al., Citation2018).
On the other hand, the need for study in the area of safety orientation stems from the fact that this concept is defined as the inclination to act safely at the workplace as demonstrated through worker behavior. A worker with high safety orientation would use required safety equipment, follow established safety rules, read and/or listen to safety warnings, and avoid on-the-job accidents. As such, if an individual has shown a tendency to act safely in the past, it can be inferred that they will likely behave safely in the future. Effectively, safety orientation operates on the basic hiring principle that past behavior is the best predictor of future behaviour. Examination of the factors that can affect safety orientation and furthermore the effect of this factor on safety performance is a neglected subject especially in Iran’s safety literature. This study has filled in the gap in safety orientation and development. There are numerous studies conducted on the role of safety orientation at workplace. Some of the safety studies only have examined the effects of organizational factors on safety, and some others have preferred to explore the root cause of the accident in managerial level. There is a common point among these previous studies that is lack of attention to the orientation of workers toward safety performance. In most research works, there is a missing link between independent variables and safety performance. These works do not reflect the behavioural aspects of safety performance. Literatures have proposed some significant factors that effect safety in managerial or organizational level, but the way they can improve the inclination of the worker towards safety was not clarified. The main purpose of this study is to develop an integrated framework that can be used as an effective tool to predict the worker unsafe behavior and improve safety performance at construction industry in Iran.
2. Literature review
2.1. Worker’s competence and safety performance
Competence can be seen as the ability of an individual to do a job properly. A competency is a set of defined behaviours that provide a structured guide enabling the identification, evaluation, and development of the behaviours in individual workers (Sant, 2016). Workers’ adequate skill, knowledge, and ability to works, especially toward risks and dangers in their work, may diminish accidents. The competencies can be enhanced through training and appropriate workers’ selection. Especially concerning establishing the personnel selection procedure, the researcher has tried to focus and investigate worker competence among Iran’s construction industry. Based on reviewing the safety literature, there is a strong belief that the lack of systematic personnel selection is one of the significant weaknesses in the construction industry. Several types of research were conducted to show the role of competency in safety performance. For instance, Osei-Asibey et al. (Citation2021) have stated that accidents tend to be associated with the lack of competency, knowledge, and skills of the workers to perform safety act in the workplace. Likewise, Selleck et al. (Citation2022) described that accidents can occur due to a lack of competence or site knowledge by individuals; therefore, the infrastructure contractors must take the lead in addressing this issue. Furthermore, Safiena and Goh (Citation2022) have claimed that one of the major causes of the accident is related to the incompetence of the worker, and they have also specified that most developing countries faced analogous problems on the way of advancement and lack of Competency. Similarly, McAleenan and Oloke (Citation2015) reported that competent workers with adequate skill and experience have less stress, and they are less prone to hazards than the inexperienced ones. Notwithstanding, some researchers argue that there is no relationship between worker competency and safety performance; This is because they contend that managers should pay more attention to organisational factors (e.g., management commitment toward safety) to control accident instead of focusing on individual aspects of safety.
The research hypothesis in this study is as below:
H1: There is a significant relationship between worker competence and safety performance.
2.2. Safety orientations and safety performance
The majority of occupational health and safety literature has shown that safety orientation plays a vital role to improve safety at work sites. For instance, Drew (Citation2014) believes that safety orientation refers to how employees learn organisational rules, policies, and procedures. Additionally, Marfa (Citation2016) described safety orientation as an individual’s inclination to act safely at work and the degree to which they value safety. Safety orientation determines workers’ safety motivation by gathering information about their past behaviours. For example, an individual with high safety motivation is likely to follow established safety rules and policies, use required safety equipment, listen to safety warnings, and take appropriate measures to avoid accidents (Samanta & Gochhayat, Citation2021). Similarly, Havold and Nesset (Citation2009) define safety orientation as “Results of the cultural, organisational and contextual factors that create attitudes and behaviour that in turn influence occupational perception of the importance of health and safety developing confidence in the efficacy of preventative measures to make the behaviour needed to avoid accidents leading to an ongoing health and safety improvement.
Some safety pioneers such as Hinze et al. (Citation2013) explained that safety orientation is one of the five high-impact zero accident techniques that can affect safety performance; in fact, the company’s positive attitudes to safety and its safety precautions are directly related to accident reduction rate. Previous studies in the field of safety and health clearly show why safety orientation is important in controlling worker safety behavior and safety performance. Actually, safety orientation can be one of the essential elements that psychologically can affect worker safety behaviour at the workplace (Awolusi & Hainen, Citation2019). Similarly, Awolusi and Marks (Citation2016) Expressed the importance of safety orientation in reducing the probability of an incident at the workplace; the study has reported safety orientation increases the safety performance five times more than other factors such as safety incentive. Safety policymakers should pay special attention to the degree of safety orientation of workers in the construction sector because of the strong and positive link between these two criteria. This is one of the key weakness that the bulk of the building sectors in developing countries are dealing with. Over the years, researchers have identified numerous human factors that lead to accidents in the workplace; however, a minimal agreement exists among psychologists and safety practitioners on the easiest ways of identifying workers’ attitude and orientation toward safety performance. Indeed, health and safety specialists’ opinion is that understanding human attitudes and behaviour are the most essential factor in getting suitable plans adopted and maintained.
In many instances, employees might be trained on safety, but do not properly avoid hazards because organizations might not attempt enough to increase the worker inclination or orientation to follow the safety rules. In this regard, management must try to shape the attitude of the worker towards safety; in fact, the workers who have enough orientation towards safety are qualified to carry out the defined job and ultimately can increase safety at their workplace. Admittedly, safety orientation is especially crucial for personnel selection because it provides a first line of defense against recruiting unsafe workers (Shultz, Citation2022). Finally, safety orientation is one of the high-impact strategies that is intended to assist owners and contractors in achieving the goal of zero incidents (Gillman & Pillay, Citation2017). Although, in consistent with other researches that have revealed the role of safety orientation to reduce occupational accidents, some scholars such as Haslinda et al. (Citation2016) believe that there is no significant connection between safety orientation and improving safety performance.
The research hypotheses in this section are as below:
H2: There is a significant relationship between safety orientation and safety performance
H3: Safety orientation mediates the relationship between worker competence and safety performance
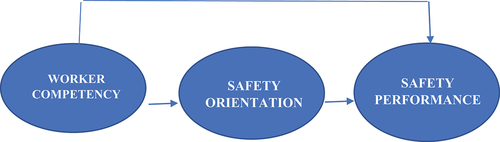
Finally, Figure provides the details on the associated variables and highlights models that become the foundation for the conceptual framework of this research. In fact, this figure illustrates the expected relationship between variables. It defines the relevant objectives for this research process and maps out how they come together to draw coherent conclusions.
Figure 1. Conceptual framework: factors and components affecting safety performance.
3. Methods
This study employs the quantitative methodology in seeking the answers to the research questions. Since this study attempts to measure a phenomenon that is not directly observable, then using a survey questionnaire is deemed an appropriate way to capture findings from a large population at one time. In this study, the researcher adopts several questionnaires in developing the instrument to draw the opinions of workers and their views on the issues related to safety in the construction industry. To measure the worker’s competence, this study adapted the items from Idrees et al. (Citation2017), Andel (Citation2015), Fang et al. (Citation2004), and Sawacha et al. (Citation1999). This study also considers safety orientation as a possible mediator to assist these factors in the relationship between the independent and dependent variables. To measure the safety orientation factors, the study adopted five items from Havold and Nesset (Citation2009) and (Drew, Citation2014) that help to give a clear picture of worker safety orientation.
Finally, the researcher adopted the items from Mathieu and Taylor (Citation2006) that emphasised the unreported accident rate for measuring safety performance. This is one of the safety indicators that employers and even policymakers recently neglected during the safety performance evaluation process. Thus, researchers adapted six items from Mathieu and Taylor (Citation2006) to measure safety performance. These items will be assessed according to a five-point Likert-type scale ranging from 1 (very high) to 5 (very low). In the next step, 600 respondents were randomly selected from government and private construction industries and yielded a response rate of 430 (71.6% response rate).
To ensure the accuracy of the findings, the researcher has decided to use the random sampling technique and cluster sampling technique. Based on the cluster sampling technique, the researcher initially considered all the construction activities in 31 provinces of Iran. Then, the researcher uses simple random sampling technique to randomly select three provinces (clusters) out of these 31 provinces. The three provinces are Khorasan Razavi, Isfahan, and Tehran. Based on these three provinces, the researcher then selects three major cities in these provinces. The three cities are Mashhad, Isfahan, and Tehran. Although construction work is being done by several construction companies/industries, this study selected only those active and officially licensed by the Iran Construction Engineering Organization (IRCEO) and Ministry of Road and Urban Design (MRUD). Thus, through the simple random sampling method, the researcher chooses 30 companies in these three cities.
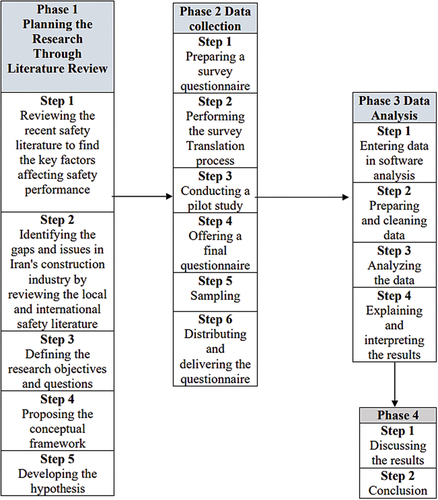
Structural equation modelling (SEM) is a multivariate statistical approach to test theories regarding hypothesized causal relationships between variables (Gillman & Pillay, Citation2017) and represents a melding of factor analysis and path analysis into one inclusive statistical methodology (Kaplan, 2008). SEM is a regression model with observed and latent variables; the structural model specifies the causal relations of the constructs to one another based on the hypotheses (Anderson and Gerbing, 1988). Thus, the measurement model is CFA, whereas the structural model is a multiple regression or a path analysis. Thus, based on the given procedure, the researcher, firstly, specified the model to be tested and determined if it was theoretically possible “to derive a unique estimate of every model parameter.” Second, the researcher did a preliminary screening of the data to rule out multicollinearity (redundancy between measurements) and to assure if the data were normally distributed. Third, the researcher evaluated model fit “to determine how adequately the model accounts for the data. Consequently, the model is specified and the revised model’s “goodness of fit” with the data is tested again. Figure demonstrates the phases involved in this study.
3.1. Instrument translation
According to McGorry (2000), this study for accurate cultural and linguistic revision of a survey combined two methods, which are a backward and forward translation. There were at least two bilingual individuals who participate independently in the translation process. The steps to this translation process include the version in the original language (English) translated by a first translator into the target language (Farsi). A second independent translator took the results from the previous step and independently translated the instrument back to the original language (English). The researcher compared both versions for any inconsistencies, mistranslations, meaning, cultural gaps, and/or lost words or phrases and checked with translators for inconsistencies. For the final step, this study used the forward translation method. In this stage, the edited and final version of the survey with the original language (English) translated by two bilingual translators. Based on McGorry (2000) guideline, one translator was aware of the concepts that the questionnaire intends to measure, to provide a translation that more closely resembles the original instrument. Likewise, a native translator, who was unaware of the objective of the questionnaire, produced the second translation so that subtle differences in the original questionnaire may be detected. A research design will only be considered appropriate if it satisfies the desired approaches which are essential in seeking for findings. A research design will only be considered appropriate if it satisfies the desired approaches which are essential in seeking for findings. Figure demonstrates the phases involved in this study.
Figure 2. The process of research design.
4. Results
4.1. Respondents’ demographics information
This section (Table ) presents the respondents who participated in this study and their demographic information such as level of education, age, job title, company location, company structure, and work experience. The details are:
Table 1. Respondents’ demographics information
4.2. The sub-variable of worker factors (worker’s competence)
In this part, overall means and standard deviations evaluated from sub-scales and items in the three scales are presented; Sekaran (2009) defines the mean as the average that offers a general picture of the data without overwhelming the researcher with each of the observations in the data set. It is only the average of various responses pertaining to a scale (Parasuraman et al., 2006).
Table demonstrates overall means and standard deviations for competence. Thus, the “Having adequate knowledge and awareness to use personal protective equipment” as shown in the above table has the highest mean score and standard deviation, respectively. In construct “Having personal accountability” has the lowest mean score and slandered division. On the other hand, for the safety performance as a dependent variable, the highest mean is “Number of unreported accident because you believe “the paperwork and process for filing workers’ compensation claims are complicated”, while the lowest mean is “Number of the accident that was not reported due to fear of losing the job or other management punishment”; moreover, as confirmed based on Table , the highest and lowest standard deviation is for “Number of the accident/injury that was not reported due to lack of suitable health insurance to cover the problem” and “Number of the accident that was not reported due to fear of losing the job or other management punishment”, respectively.
Table 2. Descriptive statistics on items of safety performance
The last item was safety orientation as a mediator between IV and DV variables (Table ). The researcher has explored how safety orientation can increase safety performance in the construction industry.
Table 3. Descriptive statistics on items of safety orientation (mediator)
Table has illustrated that item “Proper safety training course for the new worker before start working” has the highest mean score (3.1521) and the lowest SD (1.19433). So, there is a proper safety-training course for the new employees before they start working, in contrast, based on the respondents’ answers, item “SORI2” has the lowest mean score (3.0619). This implies that workers prefer to observe safety rules when doing work.
4.3. Construct reliability of research
Reliability is established when repeated applications of the same method to the same object yield the same result every time. The reliability of an instrument is the degree of consistency with which it measures the attributes it is supposed to be measuring and can be determined by assessing its internal consistency (Polit & Beck, 2004). McMillan and Schumacher (1984) stated that a coefficient alpha of 0.90 implies a highly reliable instrument; nevertheless, coefficients ranging from 0.70 to 0.90 are acceptable for most instruments. Cronbach’s alpha‖, identified as the coefficient of reliability, shows the degree of internal consistency for a set of items (or variables), assuming that they assess a one-dimensional latent construct.
On the other hand, Split half could be one of the most compatible methods to test survey reliability; this method randomly splits the data set into two and conducts correlation testing. A score for each respondent is calculated based on each half of the scale (Field, Citation2009). The split-half method assesses the internal consistency of a test, such as questionnaires. It measures the extent to which all parts of the test contribute equally to what is being measured. Comparing the results of one-half of a test with the results from the other half does this. To determine the construct reliability, the study utilised Cronbach’s coefficient alpha through computing internal consistency as well as split-half items through Spearman-Brown’s coefficient alpha. Table shows the internal consistency test of each variable in the pilot-test and total population scales.
Table 4. Internal consistency test of each main construct
As mentioned before, besides applying the internal consistency method, the researcher will be using the split-half method to measure the reliability of the study. This technique is one of the oldest methods to calculate the correlation between scores on two halves of the test and estimate the correlation through the Spearman-Brown coefficient (Webb, 2006).
In Table the entire variable demonstrates acceptable reliability; the results are in the range of between 0.838 and 0.957, which consider a high rate; consequently, the outcome of Cronbach’s α shows that the results are highly reliable.
The normal range of corrected correlation coefficient (2 r/r + 1) is between 0.0 and 1.0. Table presents all the corrected correlation coefficient values that are between 0.0 and 1.0. Thus, the correlation of two halves and the Spearman-Brown coefficient is significantly higher than the acceptance criteria.
Table 5. Split-half test each main construct in population
4.4. First-order model of worker competence
The first-order confirmatory factor model was assessed to evaluate the existence of the hypothesised aspects of worker factors. Figure shows the first confirmatory measurement model for worker factors. This model indicates three observed sub-variables (construct) including competency, psychological factors, and historical factors. Measurement model validity depends on goodness-of-fit for the measurement model (Hair et al., 2006). Goodness-of-fit (GOF) shows how well the specified model reproduces the covariance matrix among the indicator items. The model fit compares the theory to reality as represented by the data. If an investigator’s theory were perfect, the estimated covariance matrix and the actual observed covariance matrix would be the same.
Therefore, the estimated covariance matrix is compared mathematically to the actual observed covariance matrix to provide an estimate of model fit. The closer the values of these two matrices are to each other, the better model is said to fit (Hair, 2010). The researcher calculated these estimates using the maximum likelihood estimation procedure, one of the several methods available to researchers through the AMOS program (Meyers et al., 2005). Maximum likelihood efforts to estimate the values of the parameters would result in the highest likelihood of the actual data matching with the proposed model. A model reporting the χ2 value and degrees of freedom, the Comparative Fit Index (CFI), and the Root Mean Square Error of Approximation (RMSEA) will often provide enough unique information to assess a model (Hair, 2010).
Chi-square is a statistic measure of difference utilised to compare the observed and estimated covariance matrices. Only one evaluates that has a direct statistical test as to its significance and forms the basis for many other goodness-of-fit measures (Hair, 2010). The chi-square test is too powerful. As sample size increases, power increases, and the chi-square test can return a statistically significant outcome even when the model fits the data reasonably well (Meyers et al., 2005).
CFI also assesses fit relative to other models as the name implies (Hair et al., 2006). The CFI is normed so that values range between 0 and 1, with higher values indicating better fit. The RMSEA is the average of the residuals among the observed ( correlation/covariance from the sample and the expected model estimated for the population (Meyers et al., 2005). Lower RMSEA values show better fit (Hair, 2010). The possible range of GFI values is 0 to 1, with higher values indicating a better fit. In the past, GFI values greater than .90 typically were considered good (Hair et al., 2006).
Figure 3. First-order factor on the worker competence.
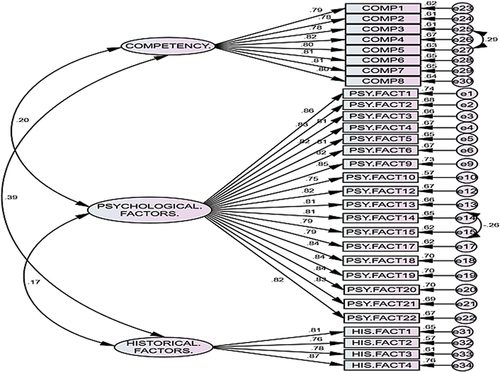
This figure demonstrates the estimated items for worker competence using data drawn from the total sample (n = 388). According to Hair et al. (2006) as prescribed in the SEM procedure, all measured factors have been allowed to load on only one construct. Moreover, the error terms are not allowed to correlate with any other measured variable.
In addition, Table shows that the CFA model of the worker factor construct yielded high goodness-of-fit indices. Hence, Table illustrates an evaluation of fit indices that shows fitness for the variable of worker factor model to the data in these indices: χ2/df = 1.284, GFI = .922; AGFI = .909; IFI = .988; NFI = .948; CFI = .988; and RMSEA = .033. Consequently, the results show that all indicators have achieved the required threshold and it means the high goodness-of-fit for this model.
Table 6. GFI for worker competence
4.5. First-order model of safety performance
A confirmatory measurement model has been applied to determine the goodness-of-fit for all items that measure safety performance as a dependent variable. Figure demonstrates the first confirmatory measurement model for safety performance characteristics.
Figure 4. First-order factor on overall safety performance.
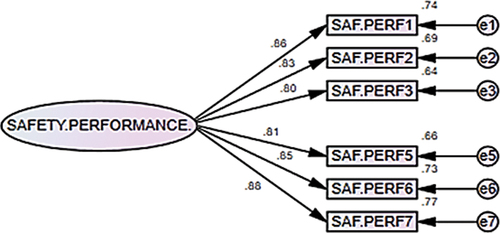
Figure demonstrates the first-order factor on the items for safety performance (n = 388). In addition, based on the above Figure these results indicate that the parameters are free from offending thresholds, ranging from 0.66 to 0.88. Likewise, as shown in Table , the factor loading is substantially significant with χ2/df = 0.540, CFI = 1.000; GFI = 0.996; AGFI = 0.990; NFI = 0.997; IFI = 1.002; and RMSEA = .000. The results declare that all indicators have met the required onset, and it means that this model has high goodness-of-fit.
Table 7. GFI for items of safety performance
4.6. First-order model on safety orientation (mediator)
Figure shows the first confirmatory measurement model for safety orientation as a mediator. This figure proves the first-order factor on five items that measure safety orientation. The first-order confirmatory factor model was assessed to evaluate the existence of the hypothesised aspects of safety orientation.
Figure 5. First-order factor on safety orientation.
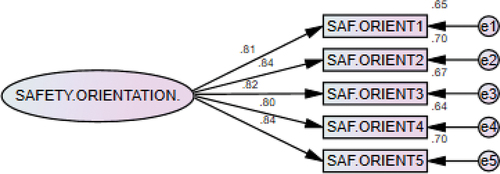
Figure demonstrates the estimated five items of safety orientation using data drawn from the total sample (n = 388). Table shows an evaluation of fit indices that indicates fitness for items of safety orientation model to the data in these indices: χ2/df = 1.518, GFI = 0.992; AGFI = 0.977; IFI = 0.998; NFI = .994; CFI = 0.998; and RMSEA = 0.037. The outcomes state that all indicators have met the required threshold, which means that a high goodness-of-fit for this model is achieved.
Table 8. GFI for items of safety orientation
5. The relationship between worker competence and safety performance
This research hypothesised that the competency of worker has a significant and positive influence on safety performance. In this regard, a hypothesis must be considered to evaluate the first hypothesis “H1: There is a significant and positive relationship between workers factors and safety performance”. Moreover, the sub-hypotheses are organised as follows:
Thus, this study tried to investigate and measure the relationships between competence as independent variables and safety performance as the dependent variable in the following section. Measuring the relationship between independent variables and the dependent variable will verify and support one of the objectives of this study: “Measure the impact of these factors on safety performance”.
5.1. The influence of competency on safety performance
Figure shows the influence of Competency on Safety Performance in the construction industry. This figure demonstrates the standardised regression coefficient between Competency and Safety Performance is statistically significant (λ = 0.35, p < 0.05) and has a positive relationship. Multiple squared correlations explain only approximately 12% of the total variance of competency to safety performance. This indicates that competency has contributed 12% in improving Safety Performance.
Figure 6. The influence of competency on safety performance.
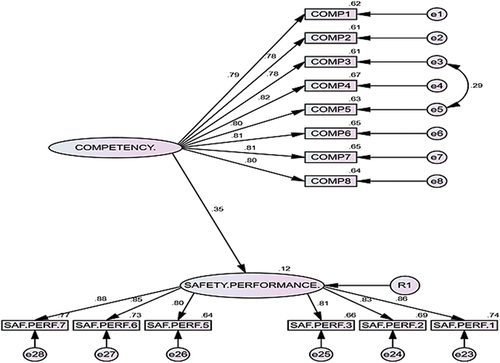
On the other hand, Table shows an estimation of fit indices, which demonstrated a strong fit in determining the effect of competence on safety performance to the data in seven indices: χ2/df = 1.177, CFI = 0.997; GFI = 0.968; AGFI = 0.955; NFI = 0.978; IFI = 0.997; and RMSEA = 0.021.
Table 9. GFI for model of competency on safety performance
The results have confirmed that competency is significantly and positively related to safety performance. Consequently, the first sub-hypothesis, “H1A: There is a significant relationship between competency and safety performance at Iranian construction industry”, is accepted.
6. The influence of competency on safety orientation
Figure displays the influence of competency on safety orientation in the construction industry. This figure illustrates the standardised regression coefficient between competency and safety orientation that is statistically significant (λ = 0.37, p < 0.05) and has a positive relationship. The multiple squared correlation value was approximately 13% of the total variance presented by competency in a safety orientation.
Figure 7. The influence of competency on safety orientation.
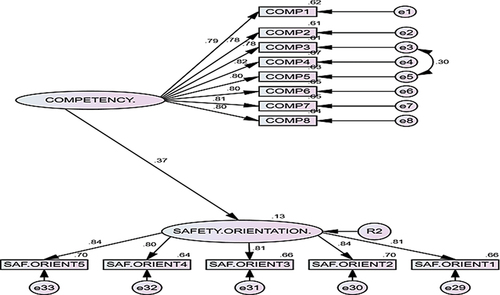
Table shows an estimation of fit indices, which demonstrates a strong fit in examining the effect of competency on safety orientation to the data in seven indices: χ2/df = 1.527, CFI = 0.990; GFI = 0.963; AGFI = 0.946; NFI = 0.973; IFI = 0.990; and RMSEA = 0.037.
Table 10. GFI for model of competency on safety orientation
The results have confirmed that competency is significantly and positively related to safety orientation. Consequently, the first sub-hypothesis, “H1A: There is a significant relationship between competency and safety orientation at Iranian construction industry”, is accepted.
7. The relationship between safety orientation and safety performance
In this part, this study hypothesised that safety orientation has a significant and positive influence on safety performance. In this regard, this study has evaluated the relationship between the mediator and dependent variable.
7.1. The influence of safety orientation on safety performance
Figure shows the influence of safety orientation on safety performance. This figure demonstrates that the standardised regression coefficient between safety orientation and safety performance is statistically significant (λ = 0.59, p < 0.05) and has a positive relationship. In terms of the multiple squared correlation value, approximately 35% of the total variance is presented by safety orientation in safety performance. This means that safety orientation has 35% contributed to increasing safety performance.
Figure 8. The influence of safety orientation on safety performance.
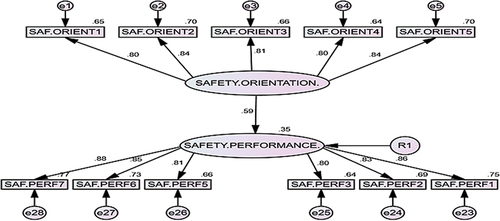
Finally, Table reveals an estimation of fit indices, which demonstrated a strong fit in determining the effect of Safety Orientation on Safety Performance to the data in seven indices: χ2/df = 0.933, CFI = 1.000; GFI = .982; AGFI = .972; NFI = .987; IFI = 1.001; and RMSEA = 0.000.
Table 11. GFI for model of safety orientation on safety performance
The findings confirmed that Safety Orientation is associated significantly and positively with Safety Performance. Therefore, the last hypothesis, “H7: There is a significant relationship between Safety Orientation and Safety Performance”, is accepted.
8. The mediation test of safety orientation
Since the causal effect of an independent variable on a dependent variable is transmitted by a mediator the indirect or mediation effect will occur. In other words, a variable is distinguished as a mediator ‘to the extent that it accounts for the relation between the predictor and the criterion (Baron & Kenny, Citation1986). MacKinnon, Lockwood, Hoffman, West, and Sheets (2002) proposed that if the path between the predictor variable and mediator variable and the path between mediator variable and criterion variable is significant, the mediation inferences are justified. The fourth objective of this study was to examine the mediating role of safety orientation between independent variables (worker factors, environmental factors, and organisational factors) and safety performance. There are several approaches to examine the mediation tests including (i) The causal steps approach (Baron & Kenny, Citation1986), (ii) The normal theory approach (Sobel test), (iii) Bootstrap and Monte Carlo methods (Arbuckle & Wothke, Citation1999). Based on recent arguments, this study took a step further to test the mediation effect of safety orientation in the relationship between the independent variables including worker factors, environmental factors, and organisational factors. The dependent variable is safety performance. According to MacKinnon et al. (Citation2004) and A. A. Hayes and Scharkow (Citation2013), the normal theory approach has some limitations compared to bootstrap and Monte Carlo methods. In addition, several studies suggested utilizing the Bootstrap as the best method in determining indirect effect (Bollen & Stine, Citation1990; A. F. Hayes, Citation2009; Shrout & Bolger, Citation2002). There are some causes to confirm the bootstrapping method for employing: (i) provide a general way to examine significance and confidence intervals in a wide variety of situations and (ii) does not need many assumptions, and as such makes the result more accurate (MacKinnon, Citation2008).
Hence, to examine the significance level of each mediating effect for those hypotheses, which could be investigated, the bootstrapping method with 2000 bootstrap re-sampling and bias-corrected confidence intervals was applied (Cheung & Lau, Citation2007; A. F. A. F. Hayes & Preacher, Citation2008; Saidon, Citation2012). To measure the mediation effect of each hypothesised path, the direct effect, indirect effect, and total effect were determined. The direct effect is the degree to which a change in the predictor variable is directly related to the criterion variable without going through the mediator variable. The indirect effect is presented as the degree to which a change in the predictor variable produces a change in the criterion variable through the mediator variable. The total effect is considered the degree to which a change in the predictor variable is relevant to the criterion variable. The submission of indirect and direct effects equals total effects. According to Mathieu and Taylor (Citation2006), for specifying the degree of the mediation (full or partial mediation), if both the direct and indirect effects are significant, this infers a partial mediation. Moreover, if the total effect and indirect effect are significant but the direct effect is non-significant, this manifests a full mediation. Table demonstrates the total effect, indirect effect, and direct effect of the degree of mediation of the hypothesised paths.
Based on Table , safety orientation has a partially mediation role between worker competence and safety performance. Thus, the hypothesised relationships are tested in this study. Table indicates the summarised results of hypothesised model.
Table 12. Degree of mediation
Table 13. Summarised results of hypothesized model
9. Assessment of the hypothesised causal relationship model by SEM
In statistics, path analysis is used to explain the directed dependencies among a set of variables. Typically, path models consist of independent and dependent variables depicted graphically by boxes or rectangles. Variables that are independent variables, and not dependent variables, are called “exogenous”. Graphically, these exogenous variable boxes lie at outside edges of the model and have only single-headed arrows exiting from them. No single-headed arrows point at exogenous variables. Variables that are solely dependent variables, or independent and dependent variables, are termed “endogenous”. Graphically, endogenous variables have at least one single-headed arrow pointing at them. Generally, exogenous variables are those forming factors (factor analysis) or predictors in a regression (multiple regression). Thus, in this section, Figure shows three measured variables in this path analysis: one exogenous variable as worker competence, and two endogenous variables involved as safety orientation and safety performance. To distinguish the status of the identification of path analysis, the number of observations and parameters is needed and should be calculated.
Figure 9. Hypothesised total model.
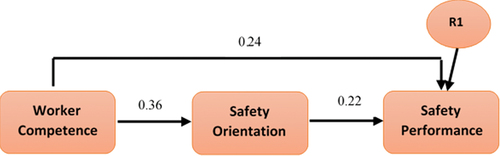
The overall hypothesised model demonstrates interrelationships among worker competence, safety orientation, and safety performance. Worker competence has a positive and significant influence on safety orientation with regression coefficients (λ = 0.36, p < 0.05). Therefore, the hypothesised model with worker competence and safety orientation with a positive relationship can be accepted as a convincible model.
In addition, there is another set of interrelationships demonstrated by Figure among worker competence and safety performance. Worker competence positively influences safety performance, respectively, with regression coefficients (λ = 0.24, p < 0.05). Therefore, the hypothesised model with a positive and significant relationship between worker competence and safety performance can be accepted as a convincible model.
10. Conclusion
Based on the findings, the human factors are critical factors to improve safety performance in the Iran construction industry. The outcome illustrates the standardized regression coefficient between competency and safety orientation that is statistically significant (λ = 0.37, p < 0.05) and has a positive relationship. Consequently, the findings of this study have proved that the relationship between competency and safety performance is significant and positive. Therefore, the third hypothesis “There is significant and positive relationship between competence and Safety Performance” is supported. The current study reminds this fact to managers that factors such as competence and orientation should be taken into their consideration both before and after hiring the workers. Thus, it can give a road map to managers to employ the most qualified workers (through an effective personnel selection mechanism) or hold the training course to increase the worker’s capabilities in order to improve company safety performance. Consequently, establishment of a systematic personnel selection system that contributes to hire the qualified work, can be a significant key in managers’ hand. The successful personnel selection and onboarding of an employee supports organizations in providing suitable and effective workers that can help in injury reduction. Several studies support the outcomes of this study (Edwin et al., Citation2021; Salihu et al., Citation2020).
On the other hand, based on the result, the standardized regression coefficient between safety orientation and safety performance is statistically significant (λ = 0.59, p < 0.05) and has a positive relationship. Therefore, another hypothesis “There is significant and positive relationship between safety orientation and safety performance” is accepted. Some researchers such as Mahmoud et al. (Citation2020) supported the outcome of this research, they have mentioned that workers’ tendency to follow safety rules was one of the most effective factors to reduce the rate of accidents. It shows that management needs to establish some policy to increase safety orientation or hired competent workers through personnel selection system.
The results also showed some problems regarding workers’ competence that the construction industry is involved with. The outcomes illustrated that workers in the construction industry did not have adequate knowledge on how to use personal protection equipment. The appropriate use of PPE is the most promising means to prevent construction injury. Indeed, if a worker is aware of the risk of not using PPE, has adequate knowledge on how to use PPE for a particular task, and works in an environment where management supports the use of PPE. The likelihood of an individual using PPE is high and can directly improve the safety performance. In contrast, if a worker does not have access to appropriate PPE, not aware of the health benefit of using PPE, or does not have proper knowledge on how to use PPE, then the likelihood of appropriate PPE use is low and it leads to poor safety performance in the construction industry. As a solution, management should focus on safety training and education. Safety training can improve worker safety behaviour and safety performance at the workplace.
The results also included some strengths in the worker competence. The results have demonstrated that workers in Iranian construction industry have enough personal accountability, and they are fully responsible for the processes, decisions, actions, and results. Another major strength detected from this research was that workers attempt to encourage co-workers to be safe; encouraging co-workers to be safe is one factor that can directly enhance safety performance. Kao (Citation2015) indicated that every worker should achieve their organization’s safety goals by encouraging a colleague to obey safety policy and act safely at the workplace. Furthermore, the results revealed that workers manage stress effectively; this might be because of having adequate Stress Management Training (SMT). It can help worker/employee to learn to improve their appraisal and coping skills. Thus, all strengths mentioned above should be maintained by management to control and reduce the accident rate.
As author mentioned before, this study used unreported accident rate as indicator to measure safety performance. For instance, one of the major weaknesses was the worker’s unwillingness to report safety problems to supervisors. As shown in the previous part, work-related accidents and injuries are often not recorded for several reasons mentioned above. Apart from the personal reasons, it is clear that other organisational reasons such as lack of adequate reporting system can also affect worker’s accident reporting. This is the responsibility of management to provide a practical training course and implement a proper Accident Reporting System at the workplace. While other countries already have implemented an effective system to monitor every single accident at the workplace, most developing countries are still suffering from non-reliable accident records. The researcher recommended some key solutions such as increasing the reliability of training by providing more precise definitions of the incident, designating staff to record incident and education, simplifying reporting, feedback, and reassurance to staff about the nature and purpose of the incident in such a system.
10.1. Mediation role of safety orientation
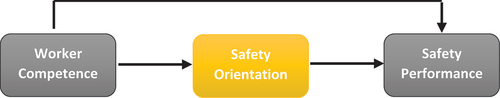
One of the objectives of this research is to examine safety orientation as a possible mediator on the relationship between independent factor (worker competence) and safety performance in the Iranian construction industries. This research indicated that safety orientation has a partial mediation role to “worker competence” and “safety performance”. Indeed, partial mediation will happen when the mediating variable is only responsible for the relationship between independent and dependent variables. If the mediating variable is eliminated, there will be a slight relationship between the independent and dependent variables; it won’t be as strong. This means “worker competence” directly influences safety performance and indirectly impacts safety performance through safety orientation as a mediator. This implies that safety orientation can be a crucial factor in improving safety performance in construction industries.
The proposed mediation model can be a powerful (Figure ) tool for managers and policymakers to enhance company safety performance. Glendon et al. (Citation2016), theorised that the existence of influential mediation variable, especially the intervention variables that facilitate worker safety behaviour can be seen as a vital element among the factors affecting safety performance; they stated that this element could apply as an intervention in managerial and individual level for two purposes: firstly, to explain the mechanism or process that underlies an observed relationship, and secondly, to optimise the relationship between the independent variable and outcomes variable.
Figure 10. The path model (final model) under partial mediation of safety orientation.
Reviewing safety literature acknowledged that an employee may have been adequately trained but does not correctly avoid job hazards because the organisation has not attempted to increase the worker inclination or orientation to follow the safety rules. Indeed, when the companies employ the worker, those who have enough skill, knowledge, and more importantly are positively oriented to follow safety rules, automatically improved safety performance.
This research has also shown that Iran’s construction industry has been challenged with some difficulty. The outcomes show that workers are not satisfied with safety activities and safety rules. It can be due to a lack of manager’s attention toward the worker’s safety compliance. Panuwatwanich et al. (Citation2017), in their research, pointed out that special awareness of management to safety such as safety incentives has a psychological influence on worker safety perception. This process can shape workers’ attitudes to safety and help the companies build their safety basis.
As an immediate solution, assigning the budget for a behaviour-based incentive can effectively increase their worker’s attitude or orientation towards safety. When workers find out managers respect and reward their safety compliance, they prefer to follow and obey company safety rules. Furthermore, the government can also oblige the construction managers to allocate a safety budget for implementing the safety orientation course or hire the qualified worker with a high level of safety attitude and compliance. According to Zahoor, Chan, Gao, and Utama (2017) that believed that regarding accident reduction policies, the government is responsible for monitoring how construction industries allocate safety budget to improve safety performance.
Establishing a systematic personnel selection system contributing to hiring qualified workers can be a significant key in the manager’s hand. Employee selection is one of the most influential Human Resource Management (HRM) processes in organisations; The successful personnel selection and onboarding of an employee supports organisations in providing suitable and effective workers that can help in injury reduction (Nikolaou, Foti, Zeigler-Hill, & Shackelford, 2018; Pourmazaherian, Baqutayan, & Idrus, 2018).
11. Research contribution
11.1. Theoretical contributions
This study has filled in the gap in safety orientation and development. As mentioned earlier, there are several studies conducted on the role of safety orientation at workplace. Some of the safety studies only have investigated the effects of organizational factors on safety, and some others have preferred to explore the root cause of the accident in managerial level. Previous accident causation theories were suffering some weakness affected its application. For instance, although Heinrich’s Domino theory was one of the most understandable and the clearest theories defining accident processes, it was suffering some weakness affected its application. The theory was revised because of emphasizing blame on individuals very much, not considering the fault of management and organization. Even, some behavioural theories such as skinner’s theory focused on the positive and negative consequences to motivate the behaviour. The principle of this theory is the fact that people usually do what they do because of the consequences they expect to get for doing it. As Dale Carnegie (1936) put it, “Every act you have ever done since the day you were born was performed because you wanted something”. B. F. Skinner’s concern for people’s feelings and attitudes is only reflected in his antipathy toward the use of punishment (or negative consequences) to motivate behaviour. Likewise, some current theories such as symptoms versus causes have tried to explore the root cause of the accident but do not necessarily focus on behavioural aspects of safety performance.
There is a common point among these theories that is lack of attention to the orientation of employees toward safety performance. In the majority of research works, there is a missing link between independent variables and safety performance. These works do not consider the behavioural aspects of safety performance. Literatures have proposed some key factors that influence safety in managerial or organizational level, but the way they can increase the inclination of the worker towards safety was not explained. It is important to understand that each theory of causes of accidents does not explain every accident, only a portion of the accident or causes of accident is explained. The most that can be said is that all of these theories are incomplete as evidenced by the number of published works for each theory.
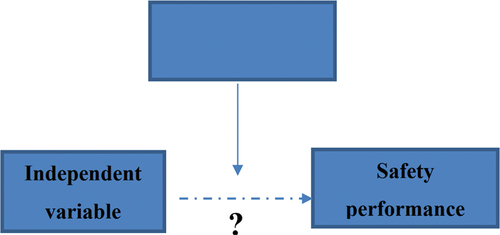
Therefore, the researcher has decided to focus more on the behavioural aspects of safety that have been neglected. Figure shows the missing link between independent variable and safety performance as one of the significant gaps in previous literatures. This study would like to demonstrate that policymakers should care more about orientation and tendency of employees to follow safety rules, they should realize that a great level of safety orientation at workplace can enhance safety performance. Therefore, this research has filled in the existing gap in safety literatures in the context of Iran. In fact, adding this factor in existing OSH model and exploring its impacts on the safety performance in construction industries will help to create a better understanding of human behaviours and causes of unsafe behaviours at workplace.
Figure 11. Missing link between independent variable and safety performance.
11.2. Practical contribution
As practical contributions, this study helps to provide a wider perspective on important factors affecting safety performance in Iran’s construction industry by examining the current status of most important factors affecting safety performance and analysing the role of safety orientation in construction safety improvement in three big provinces of Iran.
On the other hand, recognition and investigation of behavioural aspects of safety and some psychological factors such as competence and safety orientation contribute the researchers to pay more thought to these angles and provide two worthwhile road maps. First, the current study has highlighted the importance of personnel selection and hiring qualified workers in safety development. Finally, this research in conformity with Human Resource Development (HRD) strongly supports increasing competence and worker safety orientation by implementing the training and safety orientation course.
Thus, the outcomes of this empirical investigation will broaden the study field in HRD, mainly for the construction workers especially in developing countries, and provide further insights regarding the importance of human resource and safety development. The behavioural outcomes of this study establish a comprehensive approach toward why some workers are inclined to obey the safety rules and the factors that affect this. This is precisely what most occupational health and safety frameworks need to consider, especially in developing countries. The proposed model emphasised the empowerment of Human Resource (HR) in construction. Hence, practical implications of the outcomes can help the companies to achieve and implement the safety goals.
Finally, this study carries values to the Sustainable Development Goals (SDG) such as goal 3 (SDG 3) that tries to enhance the good health & well-being of the societies and workplace through the investigation of the effective factors on the safety performance of the construction industry. Ultimately, the findings of this study contribute to the achievement of Sustainable Development Goal 8 (SDG 8) through encouraging the entrepreneurship as effective measures to eradicate or decrease forced labour, slavery and incompetent worker at the workplace (focusing on behavioural aspects). In this regard, the goal is to achieve full and productive employment and decent work, for all women and men by 2030.
12. Limitation of the study
This study has some limitations. First, the cultural factors might cause discrepancy findings. This research directly uses some commonly applied western theoretical frameworks, constructs, and models, originally developed mainly by the US, UK, and Australia, that might not fit in the Iranian context. Efforts have been made to adapt the instruments through establishing content validity within the Iranian context. However, the results may still not fully detect the cultural nuances among Iranian workers.
Secondly, the narrow geographical concentrated sampling prevents the generalization of the findings to a broader Iranian context. The 600 samples for this study were only within the central and northeast provinces. These regions are one of the most developed economic areas, and the selected three cities are the cities that have heavy industries and constructions in Iran. Therefore, the findings might be generalized only to other regions with similar characteristics, mainly in the northern areas of Iran. In fact, Iran’s socioeconomic development varies substantially from developed regions (roughly central and north of Iran) to less developed regions (roughly south of Iran), and the underdeveloped region (roughly western of Iran). Therefore, workers and management in different regions might have different perceptions about safety and factors affecting safety performance. The results could also differ in numerous geographic locations, which may be culturally distinct. The working conditions of the location, as well as local policies and strategies of a specific employer, could present alternative perspectives that are not taken into account in this research. Thirdly, the researcher collected the data during the economic sanctions that were imposed by the US. Thus, respondents’ perceptions about safety factors and financial issues might not be valid today, whereas these might play a significant role in safety performance. Finally, during the data collection, particularly some HR department and some governmental sectors were not supportive to provide accurate and consistent data. There were many obstacles that the researcher had to overcome in gathering some critical data such as a number of the accidents and fatalities.
13. Recommendations for future research
This study has several recommendations. First, the implementation of the proposed model needs collaborative efforts among universities, private sectors, government companies, as well as other stakeholders to enhance safety at workplace. Second, in studies that are conducted on small scale and in small regions, a mixed methodology could potentially help researchers to develop more defined models especially in the private sector that is quite difficult for researchers to obtain the required data. Third, future studies should investigate the insurance issues and their effect on safety. There are several issues that the construction industry is facing. For instance, majority of employers often do not insure workers or the insurance coverage is not sufficient enough to cover employees or workers’ loss or companies’ loss. Insurance issues are a wide area that needs special attention in Iran. Fourth, there is a need to investigate the available mechanisms for a post-accident response. Future researches can focus on post-accident responses such as immediate medical attention or psychiatric counselling after the occurrence of an accident.
Disclosure statement
No potential conflict of interest was reported by the author(s).
Additional information
Funding
References
- Andel, S. A. (2015). Personality as a predictor of occupational safety: does it really matter? https://scholar.google.com/scholar?hl=en&as_sdt=0%2C5&q=Andel%2C+S.+A.+%282015%29.+Personality+as+a+predictor+of+occupational+safety%3A+does+it+really+matter%3F&btnG=
- Arbuckle, J. L., & Wothke, W. (1999). Amos 4.0 user’s guide: Marketing Department. SPSS Incorporated.
- Awolusi, I. G., & Hainen, A. M. (2019). Framework for monitoring and measuring construction safety performance. Paper presented at the 55th Annual Associated Schools of Construction International Conference.
- Awolusi, I. G., & Marks, E. D. (2016). Safety activity analysis framework to evaluate safety performance in construction. Journal of Construction Engineering and Management, 143(3), 05016022. https://doi.org/10.1061/(ASCE)CO.1943-7862.0001265
- Bagozzi, R. P., & Yi, Y. (1988). On the evaluation of structural equation models. Journal of the Academy of Marketing Science, 16(1), 74–25. https://doi.org/10.1007/BF02723327
- Baron, R. M., & Kenny, D. A. (1986). The moderator–mediator variable distinction in social psychological research: Conceptual, strategic, and statistical considerations. Journal of Personality and Social Psychology, 51(6), 1173. https://doi.org/10.1037/0022-3514.51.6.1173
- Bollen, K. A., & Stine, R. (1990). Direct and indirect effects: Classical and bootstrap estimates of variability. Sociological Methodology, 20(1), 15–140. https://doi.org/10.2307/271084
- Cheung, G. W., & Lau, R. S. (2007). Testing mediation and suppression effects of latent variables: Bootstrapping with structural equation models. Organizational Research Methods.
- Chinda, T., & Mohamed, S. (2008). Structural equation model of construction safety culture. Engineering, Construction and Architectural Management, 15(2), 114–131. https://doi.org/10.1108/09699980810852655
- Doloi, H., Iyer, K., & Sawhney, A. (2011). Structural equation model for assessing impacts of contractor’s performance on project success. International Journal of Project Management, 29(6), 687–695. https://doi.org/10.1016/j.ijproman.2010.05.007
- Drew, E. N. (2014). Personnel selection, safety performance, and job performance: are safe workers better workers? https://doi.org/10.25148/etd.FI14040884
- Edwin, K. W., Nilsen, M., & Albrechtsen, E. (2021). Why is the construction industry killing more workers than the offshore petroleum industry in occupational accidents? Sustainability, 13(14), 7592. https://doi.org/10.3390/su13147592
- Fang, D., Huang, X., & Hinze, J. (2004). Benchmarking studies on construction safety management in China. Journal of Construction Engineering and Management, 130(3), 424–432. https://doi.org/10.1061/(ASCE)0733-9364(2004)130:3(424)
- Field, A. (2009). Discovering statistics using SPSS. Sage publications.
- Gillman, M., & Pillay, M. (2017). An integrative literature review: What are the barriers that stop organisations from learning the lessons highlighted in serious incident investigations? Paper presented at the International Conference on Applied Human Factors and Ergonomics. https://doi.org/10.1007/978-3-319-60525-8_63
- Glendon, A. I., Clarke, S., & McKenna, E. (2016). Human Safety and Risk Management. CRC Press.
- Haslinda, A., Saharudin, S., Roslan, N. H., & Mohamed, R. (2016). Safety training, company policy and communication for effective accident management. International Journal of Academic Research Business Social Science, 6(9), 141.
- Havold, J. I., & Nesset, E. (2009). From safety culture to safety orientation: Validation and simplification of a safety orientation scale using a sample of seafarers working for Norwegian ship owners. Safety Science, 47(3), 305–326. https://doi.org/10.1016/j.ssci.2008.05.002
- Hayes, A. F. (2009). Beyond Baron and Kenny: Statistical mediation analysis in the new millennium. Communication Monographs, 76(4), 408–420. https://doi.org/10.1080/03637750903310360
- Hayes, A. F., & Preacher, K. J. (2008). Asymptotic and resampling strategies for assessing and comparing indirect effects in multiple mediator models. Behavior Research Methods, 40(3), 879–891. https://doi.org/10.3758/BRM.40.3.879
- Hayes, A., & Scharkow, M. 2013. The relative trustworthiness of popular inferential approaches to testing indirect effects in statistical mediation analysis: does method really matter. Psychological Sci, 24(10), 1918–1927. accepted for publication. https://doi.org/10.1177/0956797613480187.
- Hinze, J., Hallowell, M., & Baud, K. (2013). Construction-safety best practices and relationships to safety performance. Journal of Construction Engineering and Management, 139(10), 04013006. https://doi.org/10.1061/(ASCE)CO.1943-7862.0000751
- Idrees, M., Hafeez, M., & Kim, J.-Y. (2017). Workers’ age and the impact of psychological factors on the perception of safety at construction sites. Sustainability, 9(5), 745. https://doi.org/10.3390/su9050745
- Kao, K.-Y. (2015). Linking Safety Knowledge to Safety Performance: A Moderated Mediation Model of Safety Priority, Supervisor Feedback, and Supervisors’ Safety Attitudes https://uh-ir.tdl.org/bitstream/handle/10657/1148/KAO-DISSERTATION-2015.pdf;sequence=1.
- MacKinnon, D. P. (2008). Mediation analysis. The Encyclopedia of Clinical Psychology.
- MacKinnon, D. P., Lockwood, C. M., & Williams, J. (2004). Confidence limits for the indirect effect: Distribution of the product and resampling methods. Multivariate Behavioral Research, 39(1), 99–128. https://doi.org/10.1207/s15327906mbr3901_4
- Mahmoud, A. S., Ahmad, M. H., Yatim, Y. M., & Dodo, Y. A. (2020). Key performance indicators (KPIS) to promote building developers safety performance in the construction industry. Journal of Industrial Engineering and Management, 13(2), 371–401. https://doi.org/10.3926/jiem.3099
- Marfa, P. P. (2016). Safety Fundamentals and Best Practices in Construction Industry. Xlibris AU.
- Mathieu, J. E., & Taylor, S. R. (2006). Clarifying conditions and decision points for mediational type inferences in organizational behavior. Journal of Organizational Behavior, 27(8), 1031–1056. https://doi.org/10.1002/job.406
- McAleenan, C., & Oloke, D. (2015). ICE manual of health and safety in construction. ICE Publishing. https://doi.org/10.1680/icemhsc.60104.0000
- Moon, A. C., Abd-Karim, S. B., & Danuri, M. S. M. (2018). THE NEED FOR A COMPETENCIES’ASSESSMENT FRAMEWORK FOR THE MALAYSIAN CONSTRUCTION PROJECT MANAGERS. Journal of Surveying, Construction and Property, 9(1), 57–74. https://doi.org/10.22452/jscp.vol9no1.6
- Nguyen, V. V., Le, V. S., Louda, P., Szczypiński, M. M., Ercoli, R., Růžek, V., … Pacyniak, T. (2022). Low-Density Geopolymer Composites for the Construction Industry. Polymers, 14(2), 304. https://doi.org/10.3390/polym14020304
- Oke, A. E., Ogunsami, D. R., & Ogunlana, S. (2012). Establishing a common ground for the use of structural equation modelling for construction related research studies. Australasian Journal of Construction Economics and Building, 12(3), 89–94. https://doi.org/10.5130/AJCEB.v12i3.2658
- Osei-Asibey, D., Ayarkwa, J., Acheampong, A., Adinyira, E., & Amoah, P. (2021). Framework for Improving Construction Health and Safety on Ghanaian Construction Sites. Journal of Building Construction and Planning Research, 9(2), 115–137. https://doi.org/10.4236/jbcpr.2021.92009
- Panuwatwanich, K., Al-Haadir, S., & Stewart, R. A. (2017). Influence of safety motivation and climate on safety behaviour and outcomes: Evidence from the Saudi Arabian construction industry. International Journal of Occupational Safety and Ergonomics, 23(1), 60–75. https://doi.org/10.1080/10803548.2016.1235424
- Safiena, S., & Goh, Y. M. (2022). A hazard identification digital simulation game developed based on the extended authentic learning framework. Journal of Engineering Education, 111(3), 642–664. https://doi.org/10.1002/jee.20459
- Saidon, I. M. (2012). Moral disengagement in manufacturing: A Malaysian study of antecedents and outcomes. Curtin University.
- Salihu, A., Aliyu, S., & Abubakar, M. (2020). An evaluation of safety risk factors during installation and dismantling of tower cranes in construction sites. Nigerian Journal of Technology, 39(4), 992–1000. https://doi.org/10.4314/njt.v39i4.4
- Samanta, S., & Gochhayat, J. (2021). Critique on occupational safety and health in construction sector: An Indian perspective. Materials Today: Proceedings.
- Sawacha, E., Naoum, S., & Fong, D. (1999). Factors affecting safety performance on construction sites. International Journal of Project Management, 17(5), 309–315. https://doi.org/10.1016/S0263-7863(98)00042-8
- Selleck, R., Hassall, M., & Cattani, M. (2022). Determining the reliability of critical controls in construction projects. Safety, 8(3), 64. https://doi.org/10.3390/safety8030064
- Shrout, P. E., & Bolger, N. (2002). Mediation in experimental and nonexperimental studies: New procedures and recommendations. Psychological Methods, 7(4), 422. https://doi.org/10.1037/1082-989X.7.4.422
- Shultz, M. (2022). The effects of stress on employee tendency to participate in safety under three cognitive biases. Iowa State University.
- Singh, R. (2009). Does my structural model represent the real phenomenon?: A review of the appropriate use of Structural Equation Modelling (SEM) model fit indices. The Marketing Review, 9(3), 199–212. https://doi.org/10.1362/146934709X467767