
 ?Mathematical formulae have been encoded as MathML and are displayed in this HTML version using MathJax in order to improve their display. Uncheck the box to turn MathJax off. This feature requires Javascript. Click on a formula to zoom.
Abstract
Background: Lung cancer is the leading cause of cancer related deaths. In Kansas, where coal-fired power plants account for 34% of power, we investigated whether hosting counties had higher age-adjusted lung cancer incidence rates. We also examined demographics, poverty levels, percentage of smokers, and environmental conditions using spatial analysis.
Methods: Data from the Kansas Health Matters, and the Behavioral Risk Factor Surveillance System (2010–2014) for 105 counties in Kansas were analyzed. Multiple Linear Regression (MLR) assessed associations between risk factors and age-adjusted lung cancer incidence rates while Geographically Weighted Regression (GWR) examined regional risk factors.
Results: Moran’s I test confirmed spatial autocorrelation in age-adjusted lung cancer incidence rates (p < 0.0003). MLR identified percentage of smokers, population size, and proportion of elderly population as significant predictors of age-adjusted lung cancer incidence rates (p < 0.05). GWR showed positive associations between percentage of smokers and age-adjusted lung cancer incidence rates in majority of counties.
Conclusion: Proximity to a coal-fired power plant was not a significant predictor of age-adjusted lung cancer incidence rates. Instead, percentage of smokers was a consistent global and regional risk factor. Regional lung cancer outcomes in Kansas are influenced by wind patterns and elderly population.
Introduction
Lung cancer symptoms usually occur when the cancer is in an advanced stage and thus chemotherapy may not be effective [Citation1]. The survival rate for lung cancer patients is at 25.4% which is low compared to other cancer types. The main reason being the late diagnosis of lung cancer compared to other cancers, such as breast cancer [Citation2]. Lung cancer is considered a leading cause of cancer related death across the globe among both men and women [Citation3]. In 2020, Lung and Bronchus cancer held the grim distinction of being the third-leading cause of cancer-related deaths in the United States, with a mortality rate of 31.8 per 100,000 people (95% CI 31.7, 31.9 per 100,000 people). Additionally, it ranked as the third most common cancer in terms of new cases, with an incidence rate of 47.1 per 100,000 people (95% CI 46.9, 47.3 per 100,000 people), highlighting its significant impact on public health. In 2020, Kansas faced a notable lung cancer burden with an age-adjusted incidence rate of 52.5 per 100,000 people (95% CI 51.4, 53.6 per 100,000). This surpassed the national average, underscoring the significant impact of lung cancer in the state with 1,892 reported cancer cases [Citation4].
There are many risk factors associated with lung cancer development. Cigarette smoking is an established cause of lung cancer, with other significant risk factors including age, radon exposure, environmental pollution, occupational factors, gender, race, and pre-existing lung conditions [Citation3]. Conclusively established as the leading cause of lung cancer in both men and women, cigarette smoking accounts for almost 85% of all lung cancer cases, making it the primary contributor to this fatal disease [Citation5–8]. The association between the socio-economic status and lung cancer occurrence is well documented and there is a significant association between income, education, and economic status with the lung cancer risk [Citation9,Citation10]. The results indicate that the individuals in lower socioeconomic position (SEP) categories exhibits higher risks compared to those in the highest SEP level. In high Human Development Index (HDI) countries, lung cancer is one of the most common causes of cancer deaths indicating a significant geographical variation in lung cancer mortality rate [Citation11].
Various factors contribute to lung cancer, stemming from exposure to environmental hazards like asbestos, metals (such as chromium, cadmium, and arsenic), certain chemicals, radiation, coal smoke, and indoor emissions from fuel burning [Citation12,Citation13]. Noteworthy risk factors include firsthand smoking, exposure to toxic gases like radon, and exposure to environmental pollution, as highlighted by Schabath [Citation14] and Bernatsky et al. [Citation15]. With two major factors being air pollution and smoking, there is a large research focus is on understanding how pollution is spread geographically and how pollution levels influence cancer incidence [Citation16–18]. There is clear evidence that polycyclic aromatic hydrocarbons (PAHs), which are primarily emitted from traffic exhausts and fuel combustion, increase the risk of lung cancer [Citation19,Citation20]. Also, air pollution in the form of PAHs is positively geographically correlated with coal-fired power plants [Citation21,Citation22]. Therefore, the workers and individuals located near power plants are being exposed to PAH pollutants at a higher rate than others. A study has shown that coal-fired power plant workers have an increased cancer risk due to airborne PAH inhalation and dermal contact [Citation23]. Also, it is well known that people living near power plants suffer from higher rates of premature mortality, respiratory diseases, lung cancer, cardiovascular disease, poorer child health, and higher infant mortality [Citation24]. On a related note, coal-fired power plants often pollute adjacent counties and counties where they are located. This is due to legislation that incentivizes placing power plants on county/state borders to minimize the monetary liability of intrastate pollution [Citation25].
Within this conceptual framework, it is critical to understand how coal-fired power plants impact lung cancer incident rates across Kansas [Citation26]. The state of Kansas contains 105 counties, which are spread across 82,278 mi², and a state population of 2.93 million. The state of Kansas contains less air pollution than other highly populated states in the Midwestern United States [Citation27]. Coal-fired power plants are present in many different counties across Kansas and contribute 34% of the overall power generation across Kansas [Citation28]. To relate those power plants with county lung cancer rates requires using a spatial statistical tool [Citation29].
The literature has explored and discussed the geographical variation in lung cancer incidence and mortality, along with the associated risk factors by applying spatial analysis methodologies. A 1973–2013 study in China [Citation30] revealed the spatial pattern of lung cancer mortality, differing from Western countries. It identified a positive association between lung cancer mortality and urbanized areas with increased industrial development. Studies across diverse geographical locations in different time spans consistently indicate a significant positive association between Particulate Matter 2.5 (PM2.5) and lung cancer mortality. This suggests that areas characterized by elevated environmental pollution face an increased risk of lung cancer. [Citation31–34].
Our primary research aim was to conduct a spatial analysis to determine whether counties with coal-fired power plants exhibited a higher age-adjusted incidence of lung cancer compared to those without, using regression methodologies. Additionally, we explored the association between lung cancer age-adjusted incidence rates in 100,000 people in Kansas from 2010 to 2014 and various risk factors, such as smoking behavior, population demographics, and poverty level, also employing regression methodologies. The outcomes of this analysis have implications for resource allocation in healthcare, the necessity of legislation to protect the health of residents in these areas, and the intersection of socioeconomic factors with illness associated with coal-fired power plants.
Materials and methods
Data source
For this analysis, we utilized the dataset of age-adjusted lung cancer incidence rates per 100,000 people in Kansas, spanning five years (2010–2014). The data was obtained from the Kansas Health Matters (KHM) webpage, administered by the Kansas Department of Health and Environment (KDHE) [Citation35]. Age-adjusted incidence rates per 100,000 are calculated to allow fair comparisons of lung cancer incidence rates between populations with different age distributions [Citation36]. The dataset provides age-adjusted lung cancer incidence rates only for counties with 20 cases or more. In Kansas, there are 105 counties; however, our dataset only included 99 counties, with 6 counties censored for age-adjusted lung cancer incidence rates. For the 6 missing counties, age-adjusted lung cancer incidence rates were estimated using the K-Nearest Neighbors (KNN) algorithm, incorporating latitude and longitude to add a spatial feature to the estimation process [Citation37].
Additionally, the study incorporates various variables reflecting demographic, behavioral, and economic aspects in Kansas. These include the 2012 population (midpoint of the study period), the percentage of individuals aged 55 to 79 representing the demographic profile, and indicators such that percentage of people below the poverty level and the urban index as economic indicators in Kansas. In this study, we considered the percentage of individuals aged between 55 and 79. This age range was chosen in accordance with the recommendation from the U.S. Preventive Services Task Force (USPSTF), which advises annual lung cancer screening for adults with a history of smoking within this demographic [Citation38]. The urban index variable is a continuous variable that takes values between 0 and 1, where a value toward 1 implies greater urbanization. The percentage of smokers in Kansas serves as a behavioral indicator variable, which was presented as the proportion of Kansas adults aged 18 years and older who smokeThe data source for the percentage of smokers, poverty level, age distribution was taken from the Kansas Behavioral Risk Factor Surveillance System (BRFSS) annual reports from 2010–2014 published by KDHE [Citation39]. Urban index was taken from the Organize and Prioritize Trends to Inform KU Cancer Center (OPTIK) application [Citation40].
Kansas residents experience typical Midwest weather, with four major seasons. A general description of the Midwest climate would be a humid continental climate, where temperatures vary drastically from summer to winter and appreciable precipitation occurs year-round. Since there are no big mountains blocking it, the wind moves around freely in Kansas [Citation41]. To account for the movement of air pollutants across geographical areas due to wind effects, data on wind speed () and wind direction (
) from the north side were obtained from the Kansas Mesonet [Citation42]. These data were represented as vectors in the Cartesian coordinate system. Using trigonometric functions, the circular wind data were decomposed into northward and eastward wind effects in Kansas [Citation43]. The north-side and east-side wind speeds, represented by
and
respectively. Additional information about wind decomposition is provided in Supplementary Materials S1.
The air contamination in Kansas state can be caused by the byproducts of coal-fired power plants. We utilized the minn_2020_Power_Plants dataset from ArcGIS online, derived from the Energy Information Administration (EIA), to determine the distance to coal-fired power plants. The dataset includes information on power plants, specifying their primary fuel source (i.e. coal, hydroelectric, wind petroleum, biomass, solar, batteries, geothermal, and other sources to generate electricity), location, names, utility details, geographical coordinates, and the generated energy amount. Focusing on our study goals, we narrowed down the dataset to include only coal-fired plants in Kansas. The analysis includes the distances, measured in miles, from the five identified coal-fired power plants to the counties as an explanatory variable.
Method
The analysis involved several steps. Initially, we created a layer in ArcGIS focusing on lung cancer incident rates. Subsequently, using the National power plant dataset, we identified and added a new layer for coal-fired power plants in Kansas, pinpointing the five plants in the state. Employing a spatial join, we combined these layers to explore areas affected by the dispersion of smoke from these power plants. Then the Buffer tool in ArcGIS was employed to generate a 25-mile radius around each coal-fired power plant. This visualization helps depict the area potentially affected by the emissions from power plants. The 25-mile radius around the coal-fired power plants is considered based on several critical factors outlined in research by [Citation44–46].
In our spatial analysis, we primarily utilized two regression models: the Multiple Linear Regression (MLR) and Geographically Weighted Regression (GWR) models. The Geographically Weighted Regression (GWR) method, introduced by Brunsdon et al. [Citation47] is a frequently employed spatial tool for modeling lung cancer incidence and mortality, particularly in cases where the spatial data shows non-stationarity [Citation48–50]. These models were applied to assess the relationship between lung cancer age-adjusted incidence rates per 100,000 in Kansas and associated risk factors. The following sections provide brief explanations of these two regression methodologies.
Multiple linear regression
The Multiple Linear Regression (MLR) model is employed to establish a linear relationship between the lung cancer age-adjusted incidence rate per 100,000 population in Kansas and a set of predictor variables. It's important to note that the linear regression model is global and does not consider the spatial distribution of the data. To incorporate spatial aspects into the MLR, this study introduces the distance to the nearest coal-fired power plant as an additional explanatory variable. The formulation of the proposed multiple linear regression model is as follows:
(1)
(1) where
be the observed value for the kth predictor variable for the ith spatial location and
be the parameter of
. Here,
be the random error term of the ith spatial location. It is assumed to follow a normal distribution with zero mean and constant variance
such that
. Here,
and
, where p is the number of predictor variables in the MLR model. The ordinary least square estimates for the parameter vector
is
and it is expressed as follows:
where
and
.
Model selection, guided by the Akaike Information Criterion (AIC) and Adjusted R2 values, identifies the best-fit model. Subsequently, a residual analysis is conducted to assess whether the fitted model satisfies the model assumptions, including the Jarque-Bera (JB) test for normality. The Global Moran’s I statistic examines spatial autocorrelation in the residuals, while hotspot analysis visualizes spatial clusters of predictions. Testing for spatial randomness and using Koenker's Studentized Breusch–Pagan (KB) test checks if model factors consistently influence the dependent variable, both geographically and in data values. Ensuring model stationarity, meaning consistency in geographical and data space, helps detect and address potential issues like heteroskedasticity.
Geographically weighted regression
The multiple linear regression (MLR) process, expressed by Equation Equation1(1)
(1) , is a comprehensive model predicting lung cancer age-adjusted incidence rates and other predictor variables. The MLR model's reliability depends on adhering to key assumptions like stationarity, homoscedasticity, and spatial randomness of regression errors. Non-stationarity in spatial data challenges conventional regression models, making Geographically Weighted Regression (GWR) a suitable alternative. The GWR accommodates regional variations by incorporating neighboring features and establishing unique equations. The GWR formula is provided below.
(2)
(2) where
be the observed value for the kth predictor variable for the ith spatial location and
be the parameter of
. Here,
be the random error term of the ith spatial location. It is assumed to follow a normal distribution with zero mean and constant variance
such that
. Here,
and
where p is the number of predictor variables in the GWR model. According to equation Equation2
(2)
(2) , in GWR each location has its regression model. The parameter set
of the ith location is estimated as:
where,
,
and
be the n-by n weight matrix with weight
defined as:
. Here,
is the geographical distance between the ith and jth spatial positions, and
is the bandwidth parameter which controls the decay of spatial correlation.
Results
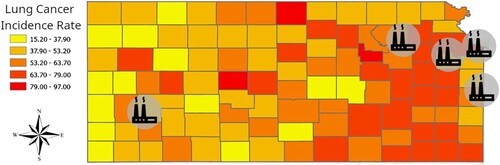
It can be seen from Figure that lung cancer age-adjusted incidence rates were high towards the east and southeast sides of Kansas State. Further, Moran’s I spatial autocorrelation test result (M = 0.2561, p-value < 0.0003) concludes with 95% confidence that there exists a spatial autocorrelation in the lung cancer age-adjusted incidence rate per 100,000 people for the state of Kansas, during the five-year study period. Furthermore, the analysis of lung cancer age-adjusted incidence rate alongside the locations of coal-fired power plants reveals that counties without such plants and those with a single coal-fired power plant showed similar lung cancer incident rates. However, counties within the 25-mile radius of influence of the two coal-fired power plants exhibited a slightly higher lung cancer incident rate compared to counties unaffected by the emission radius.
Figure 1. Lung cancer incident rate per 100,000 people for the state of Kansas, five-year period 2010–2014.
The counties in the state of Kansas are divided into two groups based on their nearest distance to the coal-fired power plant. There are 19 counties where the minimum distance to the nearest power plant is less than a 25-mile radius, while there are 86 counties outside the 25-mile radius from the coal-fired power plants. According to Figure , the median lung cancer age-adjusted incidence rate within a 25-mile radius is slightly higher than that of the counties outside the 25-mile radius. The two-sample t-test indicates (t = 1.8754, p-value = 0.0690), with 95% confidence, that there is no significant difference between the mean lung cancer age-adjusted incidence rates per 100,000 people in these two geographical areas during the period of 2010–2014. This implies that lung cancer age-adjusted incidence rates do not change significantly based on their proximity to the coal-fired power plant.
Figure 2. Boxplot representing the relationship between Coal-Fired Power Plants and Lung Cancer Incident rate per 100,000.
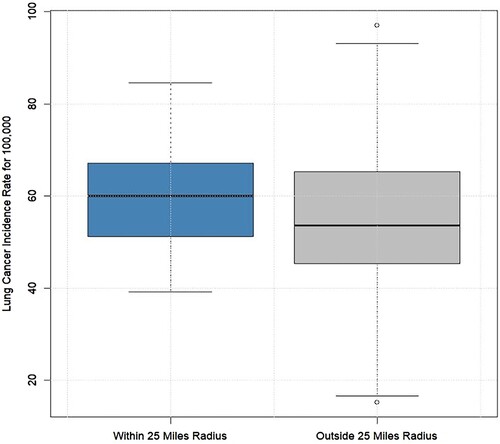
Figure illustrates the correlation between the lung cancer age-adjusted incidence rate per 100,000 individuals and the predictor variables examined in this study. The data indicate positive correlations with the percentage of smokers, the northward wind speed, the percentage of the population below the poverty line, the urban index, and the logarithmic value of the population of counties in Kansas in the year 2012. The logarithmic value of the population of counties was used to reduce skewness of the population density distribution. Conversely, negative correlations are observed with variables such as the percentage of the population aged 55 to 79, the eastward wind speed, and the distance to the nearest coal-fired power plant. The histogram indicates that the lung cancer age-adjusted incidence rate for 100,000 people approximately follows a normal distribution.
Figure 3. Correlation between variables.
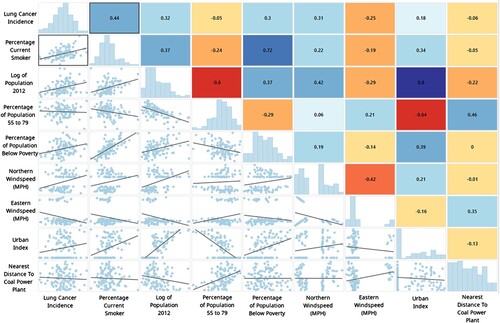
In practical terms, counties with a higher percentage of smokers and a greater percentage of poverty tend to exhibit higher lung cancer incidence rates due to the positive association between these factors and lung cancer incidence rate. Urban counties in Kansas tend to have higher lung cancer incidence rates due to the positive correlation between the urban index and lung cancer incidence rates. Similarly, counties farther away from coal-fired power plants exhibit lower lung cancer incidence rates, as shown in Figure .
Multiple linear regression analysis
The multiple linear regression models aimed to predict the lung cancer age-adjusted incidence rates per 100,000 in Kansas State, utilizing various predictor variables. Table presents a summary of the findings from the selected regression models. The results suggest, with a 95% confidence level, that the proportion of smokers remains a significant factor, positively associated with the lung cancer age-adjusted incidence rate, while holding other factors constant. Therefore, a higher proportion of smokers can indicate a higher lung cancer age-adjusted incidence rate in the population.
Table 1. Multiple Linear Regression Models, Study on Lung Cancer Age-Adjusted Incidence Rates in Kansas 2010–2014.
Except for Model 3, all other models indicate that the logarithmic value of the population in 2012 is also significant at a 5% significance level and is positively associated with lung cancer age-adjusted incidence rates. Model 3 provides intriguing insights into how wind effects are associated with lung cancer age-adjusted incidence. With a 95% confidence level, the high-speed winds in the north side is positively associated with elevated lung cancer age-adjusted incidence rates during the study period, while other factors remained unchanged.
Considering both the AIC and adjusted R-squared values, Model 4 was selected as the most suitable model. It's important to note that the study spanned from 2010 to 2014, and these conclusions are drawn based on the data collected during that period. The selected model is formulated as follows:
(3)
(3) where,
and
are the predictor variables which represent the proportion of smokers, the logarithm of the population in the year 2012, the percentage of the population between the ages of 55 and 79, and the wind effect on the East for the ith county respectively. Further,
represents the estimated lung cancer age-adjusted incidence rates per 100,000 individuals in the ith county in Kansas, where
The residual analysis was performed based on the residuals calculated by Model 4. The global Moran’s I test for spatial autocorrelation (M = 0.0304, p-value = 0.5872) indicates that residuals are scattered randomly. The predictor variables in Model 4 exhibit no multicollinearity, as indicated by Variance Inflation Factor (VIF) values below 7.5. The Jarque-Bera Statistic (JB = 3.9163, p-value = 0.1411) suggests that the residuals are normally distributed, and the KB test concludes, with 95% confidence, that (KB = 5.8395, p-value = 0.2115) there is not enough evidence to indicate the heteroscedasticity of the residuals. This indicates that the standardized residuals are independent, and normally distributed with constant variance means that the selected regression model satisfies the model assumption.
Geographically weighted regression analysis
One of the key advantages of the GWR model lies in its ability to leverage sub-sample information from neighboring counties to conduct local regression. This allows for the estimation of variable parameters in each county, facilitating spatial comparative analysis. The GWR model was employed to analyze the lung cancer age-adjusted incidence dataset spanning from 2010 to 2014. As described in Equation Equation2(2)
(2) , each predictor variable has 105 estimated coefficients, corresponding to the 105 spatial locations in Kansas. The model predictor variables for the GWR model were selected from the MLR model, as outlined in Equation Equation3
(3)
(3) . To facilitate comparison, Table outlines the results providing the mean, median, minimum, and maximum values of the estimated coefficients. Model comparison was conducted using AIC and Adjusted R2 values, revealing that the GWR model effectively explains the dataset. It is important to note that except for the two counties (Cheyenne County and Sherman County) the coefficient for the proportion of smokers is consistently positive for all counties. This suggests that an increase in the percentage of smokers is associated with a higher lung cancer age-adjusted incidence rate in the geographical area, assuming all other risk factors remain unchanged.
Table 2. Geographically Weighted Regression Model Estimation Results for Study on Lung Cancer Age-adjusted Incidence Rates in Kansas 2010–2014.
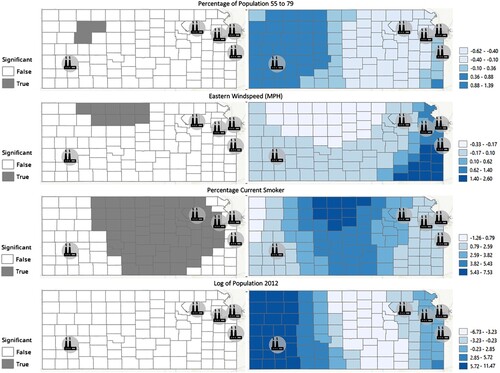
Figure illustrates the estimated coefficients and their significance at a 5% significant level based on the fitted GWR model. In our study of lung cancer age-adjusted incidence rate per 100,000 in Kansas, specific regional patterns emerged. The percentage of smokers exhibited significance in the north and south corridors, with higher coefficients compared to the east and west sides of Kansas. On the other hand, the local regression model in equation Equation3(3)
(3) suggests that the percentage of smokers is significant at a 5% significance level across the entire state. Interestingly, the logarithm of the population did not demonstrate significance at a 5% significance level; however, in the global regression model, it showed a significant coefficient. East wind speed is significant only for nine counties (Decatur County, Norton County, Phillips County, Smith County, Jewell County, Graham County, Rooks County, Osborne County, and Mitchell County) in Kansas, with negative coefficients implying that high wind toward the east side is negatively associated with lung cancer age-adjusted incidence in these counties. Practically speaking, this east wind moves pollutants from coal-fired power plants away from the counties. Additionally, the percentage of the population between the ages of 55 and 79 emerged as a significant factor in three counties (Sheridan County, Graham County, and Trego County), indicating that an increase in the percentage of the population in this age group corresponds to higher lung cancer age-adjusted incidence rates.
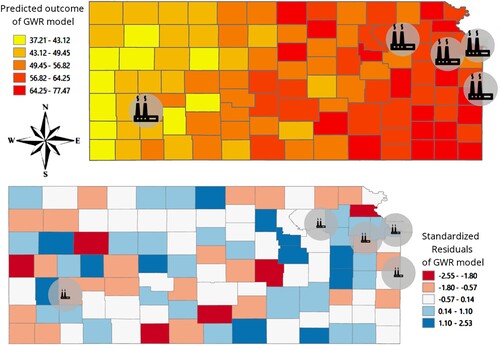
Figure 4. Geographical Weighted Regression model parameter estimations and significance of the parameters by the county.
Analyzing county-level age-adjusted incidence predictions with the GWR model presented in Figure highlights a concentration of higher estimated lung cancer age-adjusted incidence rates in southwestern Kansas and lower rates in northwestern Kansas. Notably, southwestern Kansas features only one coal-fired power plant. However, it's crucial to acknowledge that the sparse and small population in western Kansas might impact the model predictions. Furthermore, the standardized residuals for the GWR model indicate the absence of a significant cluster, validating that the fitted GWR model best explains the association between lung cancer age-adjusted incidence rates and risk factors, considering the spatial variations.
Figure 5. GWR prediction of lung cancer age-adjusted incidence rates per 100,000 and standardized residuals.
Discussion
Several studies suggest an association between lung cancer incidence rates and the use of coal-fired power plants for energy generation. Lin et al. [Citation51] noted that increasing coal capacity by 1 kW per person in a country is associated with a 59% higher risk of lung cancer in males and an 85% higher risk in females. Our analysis aimed to determine whether proximity to a coal-fired power plant was a significant predictor of lung cancer age-adjusted incidence rates per 100,000 population in Kansas while controlling for established demographic, behavioral, economic, and climatological risk factors such as age, smoking status, poverty, and wind effects. However, contrary to Li et al. [Citation51], our analysis indicates that there is no significant difference in lung cancer age-adjusted incidence rates, whether the county is situated in proximity to a coal-fired power plant or not. This difference may be due to the fact that they found an association between the lung cancer incidence rate and the energy generated from the coal-fired power plant, while our study considered proximity to the power plant. This suggests that the vicinity of the power plant was not significantly associated with lung cancer age-adjusted incidence when controlling for other major risk factors.
Smoking, age, poverty, and population are significant global risk factors associated positively with the lung cancer age-adjusted incidence rate based on the MLR model. According to the GWR model, the prevalence of smokers demonstrated a significant variation between the north and south corridors, with higher coefficients observed compared to the east and west sides of the state. Although the population did not exhibit significance in the local regression model, its significance in the global model suggests that the population size alone may be a primary determinant and becomes more nuanced when considering localized variations.
The impact of wind on lung cancer age-adjusted incidence rates was found to be significant only in the northern part of Kansas. The negative coefficient for eastward wind suggests that when winds blow to the west, pollutants generated from the coal-fired power plants are carried towards the northern counties in Kansas. This intriguing finding emphasizes the importance of including environmental factors in lung cancer related studies. Furthermore, the percentage of the population between the ages of 55–79 emerged as a significant factor in 3 counties, revealing an association between higher populations in this age group and increased lung cancer age-adjusted incidence rates.
Limitations
The strength of this study is that it has evaluated the environmental impact on a niche Midwest population around the most aggressive cancer type. However, this study has several limitations. The first limitation being, study could not use the gender as a strata variable. Estimation of incidence rates of the 6 missing counties using K-Nearest Neighbors comes at a cost of not being the true lung cancer incidence rates of these counties.
Conclusion
In conclusion, our comprehensive analysis aimed to discern the relationship between proximity to coal-fired power plants and lung cancer age-adjusted incidence rates in Kansas, considering various established risk factors. Contrary to our initial hypothesis, the results suggest that proximity to a coal-fired power plant is not a significant predictor of lung cancer age-adjusted incidence rates when controlling for major demographic, behavioral, economic, and climatological factors. Instead, our study highlights the impactful role of behavioral factors, particularly smoking, which emerged as a consistently significant global risk factor in association with higher lung cancer age-adjusted incidence rates. The findings related to wind speed and direction in certain counties further emphasize the relevance of environmental factors in influencing regional health outcomes, as pollutants carried by wind may contribute to lung cancer age-adjusted incidence. In Kansas, certain areas show a highlighted risk among the elderly population. While proximity to coal-fired power plants may not emerge as a significant predictor in this study, it is critical to acknowledge their potential impact on local air quality and their confounding effect on lung cancer outcomes. Future analyses should examine how local coal-fired power plants are affecting the health of workers, who are likely exposed to high levels of pollutants. Comparing their lung cancer incidence rates to those of the general population would provide valuable insights.
Competing interests
The authors report there are no competing interests to declare.
Disclosure statement
No potential conflict of interest was reported by the author(s).
Data availability statement
The data that support the findings of this study are available from the corresponding author, upon reasonable request.
Additional information
Funding
References
- Bernhardt EB, Jalal SI. Small cell lung cancer. In: Reckamp K, editor. Lung Cancer: Treatment and Research. Vol. 170. Cham: Springer; 2016. p. 301–322. doi:10.1007/978-3-319-40389-2_14
- Printz C. Lung cancer new leading cause of death for women in developed countries: Data reflects increased rates of smoking. Cancer. 2015;121(12):1911–1912. doi:10.1002/cncr.28995
- de Groot PM, Wu CC, Carter BW, et al. The epidemiology of lung cancer. Transl Lung Cancer Res. 2018;7(3):220–233. doi:10.21037/tlcr.2018.05.06
- U.S. Cancer Statistics Working Group. (2023). U.S. Cancer Statistics Data Visualizations Tool,: based on 2022 submission data (1999-2020). U.S. Department of Health and Human Services, Centers for Disease Control and Prevention and National Cancer Institute. https://www.cdc.gov/cancer/dataviz.
- Pinheiro P, Callahan K, Medina H, et al. Lung Cancer in never smokers: Distinct Population-based patterns by age,: sex, and race/ethnicity. Lung Cancer. 2022;174(1):50–56. doi:10.1016/j.lungcan.2022.10.009
- Minna JD, Roth JA, Gazdar AF. Focus on lung cancer. Cancer Cell. 2002;1(1):49–52. doi:10.1016/S1535-6108(02)00027-2
- Ruano-Ravina A, Figueiras A, Barros-Dios JM. Lung cancer and related risk factors: an update of the literature. Public Health. 2003;117(3):149–156. doi:10.1016/S0033-3506(02)00023-9
- Godtfredsen NS, Prescott E, Osler M. Effect of smoking reduction on lung cancer risk. JAMA. 2005;294(12):1505–1510. doi:10.1001/jama.294.12.1505
- Van Loon AJ, Goldbohm RA, van den Brandt PA. Lung cancer: Is there an association with socioeconomic status in The Netherlands? J Epidemiol Community Health. 1995;49(1):65–69. doi:10.1136/jech.49.1.65
- Sidorchuk A, Agardh EE, Aremu O, et al. Socioeconomic differences in lung cancer incidence: A systematic review and meta-analysis. Cancer Causes Control. 2009;20:459–471. doi:10.1007/s10552-009-9300-8
- Wong MCS, Lao XQ, Ho KF, et al. Incidence and mortality of lung cancer: Global trends and association with socioeconomic status. Sci Rep. 2017;7(1):14300. doi:10.1038/s41598-017-14513-7
- Loomis D, Grosse Y, Lauby-Secretan B, et al. The carcinogenicity of outdoor air pollution. Lancet Oncol 2013;14(13):1262–1263. doi:10.1016/s1470-2045(13)70487-x
- Jemal A, Center MM, DeSantis C, et al. Global patterns of cancer incidence and mortality rates and trends. Cancer Epidemiol Biomarkers Prev. 2010;19(8):1893–1907. doi:10.1158/1055-9965.EPI-10-0437
- Schabath MB, Cote ML. Cancer progress and priorities: Lung cancer. Cancer Epidemiol Biomarkers Prev. 2019;28(10):1563–1579. doi:10.1158/1055-9965.EPI-19-0221
- Bernatsky S, Ramsey-Goldman R, Petri M, et al. Smoking Is the Most Significant Modifiable Lung Cancer Risk Factor in Systemic Lupus Erythematosus. J Rheumatol. 2018 Mar;45(3):393–396. doi:10.3899/jrheum.170652
- Guo Y, Zeng H, Zheng R, … Williams G. The association between lung cancer incidence and ambient air pollution in China: A spatiotemporal analysis. Environ Res. 2016;144(Pt A):60–65. doi:10.1016/j.envres.2015.11.004
- Turner MC, Krewski D, Diver WR, … Gapstur SM. Ambient air pollution and cancer mortality in the Cancer Prevention Study II. Environ Health Perspect. 2017;125(8):087013. doi:10.1289/EHP1249
- Pope CA, Burnett RT, Thun MJ, et al. Lung cancer, cardiopulmonary mortality, and long-term exposure to fine particulate air pollution. JAMA. 2002;287(9):1132–1141. doi:10.1001/jama.287.9.1132
- Wang T, Xia Z, Wu M, … Yang H. Pollution characteristics, sources and lung cancer risk of atmospheric polycyclic aromatic hydrocarbons in a new urban district of Nanjing. China. J Environ Sci. 2017;55:118–128. doi:10.1016/j.jes.2016.06.025
- Koplitz SN, Jacob DJ, Sulprizio MP, et al. Burden of disease from rising coal-fired power plant emissions in Southeast Asia. Environ Sci Technol. 2017;51(3):1467–1476. doi:10.1021/acs.est.6b03731
- Grant WB. Air pollution in relation to U. S. cancer mortality rates: An ecological study; likely role of carbonaceous aerosols and polycyclic aromatic hydrocarbons. Anticancer Res. 2009;29(9):3537–3545.
- Amster E, Lew Levy C. Impact of coal-fired power plant emissions on children's health: A systematic review of the epidemiological literature. Int J Environ Res Public Health. 2019;16(11):2008. doi:10.3390/ijerph16112008
- Wang R, Liu G, Zhang J. Variations of emission characterization of PAHs emitted from different utility boilers of coal-fired power plants and risk assessment related to atmospheric PAHs. Sci Total Environ. 2015;538:180–190. doi:10.1016/j.scitotenv.2015.08.043
- Kravchenko J, Lyerly HK. The impact of coal-powered electrical plants and coal ash impoundments on the health of residential communities. N C Med J. 2018;79(5):289–300. doi:10.18043/ncm.79.5.289
- Morehouse J, Rubin E. (2021). Downwind and out: The strategic dispersion of power plants and their pollution. Available at SSRN: https://ssrn.com/abstract=3915247.
- Duke Health News. (2018, October 12). Despite studies, health effects of coal-burning power plants remain unknown. Retrieved 10 July 2023, from https://surgery.duke.edu/news/despite-studies-health-effects-coal-burning-power-plants-remain-unknown.
- Pearson CG. (2021, October). Kansas. Retrieved 10 July 2023, from https://www.britannica.com/place/Kansas.
- U.S. Energy Information Administration. (2022, June 16). U.S. Energy Information Administration - EIA - independent statistics and analysis: Kansas. Retrieved 10 July 2023, from https://www.eia.gov/state/analysis.php?sid=KS#57.
- ESRI 2011. (2022). ArcGIS Pro (Release 2.9.2). Retrieved 10 July 2023, from https://www.esri.com/en-us/arcgis/products/arcgis-pro/overview.
- Shen X, Wang L, Zhu L. Spatial analysis of regional factors and lung cancer mortality in China, 1973-2013. Cancer Epidemiol Biomarkers Prev. 2017;26(4):569–577. doi:10.1158/1055-9965.EPI-16-0922
- Cao Q, Rui G, Liang Y. Study on PM2.5 pollution and the mortality due to lung cancer in China based on geographic weighted regression model. BMC Public Health. 2018;18(1):925. doi:10.1186/s12889-018-5844-4
- Wang N, Mengersen K, Kimlin M, et al. Lung cancer and particulate pollution: a critical review of spatial and temporal analysis evidence. Environ Res. 2018;164:585–596. doi:10.1016/j.envres.2018.03.034
- Zhang H, Tripathi NK. Geospatial hot spot analysis of lung cancer patients correlated to fine particulate matter (PM2.5) and industrial wind in Eastern Thailand. J Clean Prod. 2018;170:407–424. doi:10.1016/j.jclepro.2017.09.185
- Vinikoor-Imler LC, Davis JA, Luben TJ. An ecologic analysis of county-level PM2.5 concentrations and lung cancer incidence and mortality. Int J Environ Res Public Health. 2011;8(6):1865–1871. doi:10.3390/ijerph8061865
- Kansas Health Matters. (2024). Lung and Bronchus Cancer Rate. Retrieved from https://www.kansashealthmatters.org/indicators/index/view?indicatorId=7569&localeTypeId=2&periodId=393
- Austin DW. (2000). Age-Adjusted Rate Definitions. Retrieved 10 July 2023, from https://health.mo.gov/data/mica/CDP_MICA/AARate.html.
- Olga T, Michael C, Gavin S, et al. Missing value estimation methods for DNA microarrays. Bioinformatics. 2001;17(6):520–525. doi:10.1093/bioinformatics/17.6.520
- U.S. Preventive Services Task Force. (2021). Lung Cancer: Screening. https://www.uspreventiveservicestaskforce.org/uspstf/recommendation/lung-cancer-screening.
- Centers for Disease Control and Prevention (CDC). Behavioral risk factor surveillance system survey data. Atlanta (Georgia): U.S. Department of Health and Human Services, Centers for Disease Control and Prevention; 2015.
- Cancer InFocus – KUMC. (2023). Sociodemographics Data of Total Population in Kansas. https://optik.shinyapps.io/CIF_KUMC/.
- EPA. (n.d.). Climate Impacts in the Great Plains. https://climatechange.chicago.gov/climate-impacts/climate-impacts-great-plains.
- Kansas Mesonet, (2017) Kansas Mesonet Historical Data. Retrieved 10 July 2023, from http://mesonet.k-state.edu/weather/historical.
- Ostrenga D. (2019). Derive Wind Speed and Direction with MERRA-2 Wind Components. Goddard Earth Sciences Data and Information Services Center. https://disc.gsfc.nasa.gov/information/data-in-action?title=Derive%20Wind%20Speed%20and%20Direction%20With%20MERRA-2%20Wind%20Components.
- Morehouse J, Rubin E. (2021). Downwind and out: The strategic dispersion of power plants and their pollution. Retrieved from SSRN: https://ssrn.com/abstract=3915247.
- Yang M, Bhatta RA, Chou SY, et al. The impact of prenatal exposure to power plant emissions on birth weight: Evidence from a Pennsylvania power plant located upwind of New Jersey. J Policy Anal Manage. 2017;36(3):557–583. doi:10.1002/pam.21989
- Jha A, Muller NZ. The local air pollution cost of coal storage and handling: Evidence from US power plants. J Environ Econ Manage. 2018;92:360–396. doi:10.1016/j.jeem.2018.09.005
- Brunsdon C, Fotheringham S, Charlton M. Geographically weighted regression. J R Stat Soc Series D. 1998;47(3):431–443.
- Al-Ahmadi K, Al-Zahrani A. Spatial autocorrelation of cancer incidence in Saudi Arabia. Int J Environ Res Public Health. 2013;10(12):7207–7228. doi:10.3390/ijerph10127207
- Cardoso D, Painho M, Roquette R. A geographically weighted regression approach to investigate air pollution effect on lung cancer: A case study in Portugal. Geospat Health. 2019;14:1. doi:10.4081/gh.2019.701
- Shao Y, Wang Y, Yu H, et al. Geographical variation in lung cancer risk associated with road traffics in Jiading District, Shanghai. Sci Total Environ. 2019;652:729–735. doi:10.1016/j.scitotenv.2018.10.266
- Lin CK, Lin RT, Chen T. A global perspective on coal-fired power plants and burden of lung cancer. Environ Health. 2019;18:9. doi:10.1186/s12940-019-0448-8