
 ?Mathematical formulae have been encoded as MathML and are displayed in this HTML version using MathJax in order to improve their display. Uncheck the box to turn MathJax off. This feature requires Javascript. Click on a formula to zoom.
ABSTRACT
Transforming alcoholysis products of PET to elastomers and hydrogels is a promising research field that contributes to slowing down the pace of global warming. The products transformed from plastics can be applied in various fields. For example, electrically conductive elastomers can be sensors and other circuit parts. However, the electrically conductive elastomers that have already been developed are mostly composite materials built up from more than one matter. This work aims to look for a way to transform waste PET plastic into copolymer electrically conductive elastomers. Thus, this kind of material is promising in the reutilization of PET plastics and the field of wearable devices. Specifically, the main method uses polycaprolactone diol (Mn = 530) to alcoholyse PET and LiTSFI to confer the elastomers with conductivity. The resulting product exhibited good electrical conductivity up to 7.051S/cm2, low thermal diffusivity down to 0.112 mm2/s, excellent thermal stability that can be stable up to 260°C, and moderate light transmittance.
1. Introduction
1.1. The status quo of PET plastic and the significance of recycling PET plastic
Polyethylene terephthalate (PET) is one of the most used plastic materials in the world. PET plastic features such advantages as good performance, high chemical stability, minimal thermal expansion, little moisture absorption, mechanical solid resistance, and hygienic properties. Due to its good performance characteristics, it is utilized widely in many different fields. PET plastic can be categorized into four ranks according to its application areas and shape: fibers, films, bottles, and monofilaments. Since plastics were invented, the most widely used ways of plastic waste management have been either combustion or landfill, as in .[Citation1]
Figure 1. Plastic waste management from 1960 to 2018 in the US[Citation1].
![Figure 1. Plastic waste management from 1960 to 2018 in the US[Citation1].](/cms/asset/14abf240-c2db-4477-8469-4bd78ab5ce56/tess_a_2362676_f0001_oc.jpg)
PET polyester resins cannot degrade naturally within 16 to 48 years because of their excellent chemical stability. So, landfills and incineration, the most common disposal methods for plastic waste, harm nature. As a result, the degrading and recycling of PET plastic has become a vital research field.[Citation2,Citation3] Except protecting the environment, recycling PET reduces the need for virgin plastic production, conserving valuable natural resources like crude oil, which is the primary raw material for PET production.
However, PET recycling faces several limitations and challenges. For one thing, PET containers may contain residues of food, beverages, or other substances, which can affect the quality of recycled PET (rPET) and limit its usability for certain applications. For another thing, the market demand for recycled PET products varies depending on factors such as consumer preferences, regulatory requirements, and economic incentives. Fluctuations in market demand can affect the viability and profitability of PET recycling operations.
1.2. PET recycle methods
To date, physical and chemical methods have dominated the PET recycling market, accounting for 80% and 20%, respectively. The recycled PET’s performance will decrease because of impurities, so they cannot be used as beverage bottles. The chemical methods of recycling PET often depolymerize PET polymers, and then the monomers are used to create new products. Hydrolysis and alcoholysis are the traditional chemical depolymerization methods.[Citation4–7] Hydrolysis reaction typically requires a high temperature and pressure, with a firm acidity or base condition. Therefore, a large energy consumption is needed, and a high degree of damage may occur to the instruments used in the hydrolysis process. In addition, the outcome of hydrolyzing PET is not pure enough. Terephthalic acid (TPA), the main product from hydrolyzing PET, is hard to purify from the hydrolysis product. In comparison, the reaction conditions of alcoholysis methods are far milder than those of hydrolysis methods. The product of PET alcoholysis is different based on different types of alcoholysis agents. Among all kinds of alcoholysis agents, ethylene glycol (EG) and methanol have stood out and been industrialized. However, chemical plastic recycling methods still need to be added to physical methods, which harm nature. As a result, research on degrading polymer resin materials is becoming more and more critical.
1.3. Polyurethane elastomer and electrically conductive elastomer
Polyurethane elastomer (PUE) has the favorable characteristics of transparency, resilience, abrasive resistance, corrosion resistance, and lightweight. Thus, PUE is applied widely in mechanical accessories and heavy industry equipment. PUE’s microscopic structure comprises rigid segments, mainly isocyanate groups, and soft segments, mostly polyol structures. The two segments are connected by chain extenders.[Citation8–12]
Electrically conductive elastomers have been applied to make soft mechanical and conductive materials featuring good electrical conductivity and flexibility. Compared to metallic materials, better flexibility allows electrically conductive elastomers to be used as conductive flexible materials as elements in some sensors. At present, most of the electrically conductive elastomers are composite materials, which are mixed with the elastomer by adsorption, coating, etc.[Citation13] The study of non-composite electrically conductive elastomers focuses on combining ionic liquids or alkali metal salts in copolymers to form stable structures.
2. Experiments and methods
2.1. Raw materials and reagents
Materials for alcoholizing PET: PET bottle flakes, polycaprolactone diol with Mn of 530 g•mol−1 (PCL-530, Aladdin Biochemical Technology), N-Methyl-2-pyrrolidone (NMP, Aladdin Biochemical Technology), anhydrous zinc acetate (Zn(OAc)2, Macklin Biochemical).
Materials for prepolymerization: alcoholysis products of PET using PCL (called PCL-PET, from the former step), hexamethylene diisocyanate (HDI, Macklin Biochemical), dibutyltin dilaurate (DBTDL, Aladdin Biochemical Technology), N, N-Dimethylformamide (DMF, Aladdin Biochemical Technology), lithium bistrifluoromethanesulphonylimide (LiTSFI, Macklin Biochemical).
Materials for polymerization: N, N-Dimethylformamide (DMF, Aladdin Biochemical Technology), 1,4-butanediol (BDO, Macklin Biochemical).
2.2. PET alcoholysis
Add PET bottle flakes, PCL-530, NMP, and anhydrous zinc acetate catalyst into a three-mouth flask and set the temperature of the magnetic heater to 180 ~ 185 °C, use mechanical stirring, connect the condenser tube and pass into the argon gas reaction for 3 hours. shows the reaction of PET alcoholysis. In this reaction, the molar ratio of PET repeating units to PCL-530 is 1:4, while the molar ratio of PET repeating units to anhydrous zinc acetate is 50:1.[Citation14] The product of the reaction is called PCL-PET, and no purification is required after the reaction.
Figure 2. PET alcoholysis process.
2.3. Preparation of electrically conductive elastomers
The preparation of electrically conductive elastomers typically needs three steps: pre-polymerization, polymerization, and drying. Secondly, set mechanical stirring, connect the condenser tube and pass it into the argon gas and react at room temperature for 0.5 h, then set the temperature of the magnetic heater to 55 ~ 65°C and react for 2.5 hours in an argon atmosphere. The outcome products of this reaction are prepolymers, which will turn into the hard and soft segments later in polymerization. The amount of LiTFSI added in the pre-polymerization step[Citation15] is determined by the n% mass of the sum of hard and soft segments. The final products are called n% LiTFSI electrically conductive elastomer (later abbreviated as n% LiTFSI in the figures) in .
Table 1. The naming of electrically conductive elastomers (based on the mass of LiTFSI).
The polymerization step starts after the pre-polymerization step is finished (). Dissolve the BDO chain extender (0.540 g) with 5 ml of solvent anhydrous DMF, add to the four-mouth flask in the former reaction, and react for 1 hour at 55 ~ 65°C in an argon atmosphere. In pre-polymerization and polymerization, the molar mass proportion among hard segment to soft segment to chain extender is nearly 2:1:1.
Figure 3. Prepolymerization and polymerization process of preparation of electrically conductive elastomers.
The final step to make the electrically conductive elastomer is to dry the solution obtained from the former steps to films. Afterward, the solution is deposited into a square polytetrafluoroethylene (PTFE) mold and is dried at room temperature for 18 h (). Then the electrically conductive elastomers are fabricated ().
Figure 4. (a) The electrically conductive elastomer product before drying; (b) The electrically conductive elastomer product after drying 18 hours.
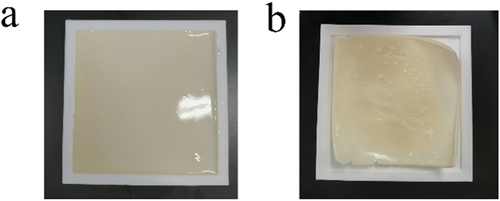
Figure 5. The structure of electrically conductive elastomers.
2.4. Characterization
Several analytical methods are used to characterize the electrically conductive elastomers. X-ray photoelectron spectroscopy (XPS) was measured on a Thermo Fisher ESCALAB 250Xi X-ray photoelectron spectrometer; Fourier Transform Infrared Spectroscopy (FT-IR) is performed on Thermo-Nicolet 380 FT-IR Spectrometer; CHN elemental analysis was measured on the Leco CHN828 hydrocarbon and nitrogen analyzer; Scanning electron microscopy (SEM) was measured on the FEI Nova NanoSEM 450; the Electrochemical Impedance Spectroscopy is performed on CHI660E Electrochemical Workstation; the thermal diffusivity is tested on LFA 467 HT Hyper Flash at atmosphere of air; Thermogravimetry Analysis (TA) is performed on STA 449 F3 Simultaneous Thermal Analyzer; The transmittance was measured on the Shimadzu UV3600 UV-Vis near-infrared spectrophotometer.
3. Results and discussion
3.1. The characterization of electrically conductive elastomers
3.1.1. X-ray photoelectron spectroscopy (XPS) characterization
The 20% LiTSFI sample was analyzed based on the XPS spectrum, with the X-ray source of Al Kα (1486.6 eV), spot size 650 μm, pass energy of 30 eV, and energy step size of 0.05 eV. The XPS spectrum of the 20% LiTSFI is shown in .
Figure 6. The survey scans the XPS spectrum of 20% LiTSFI conductive elastomer.
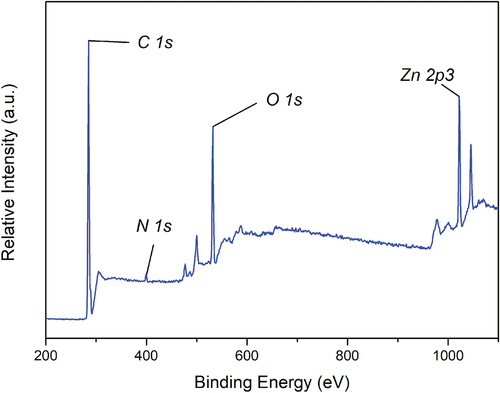
From , it can be found that the peaks corresponding to the binding energies of C1s, N1s, O1s, and Zn2p3 are found, among which C and O are mainly from PCL-PET, N are mainly from HDI, and Zn should be from anhydrous zinc acetate added to the alcoholysis reaction.
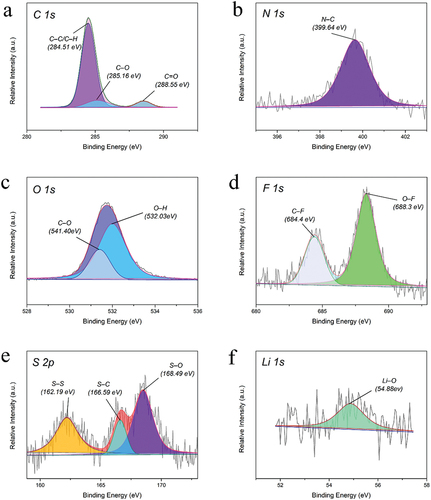
The six samples shown in are all 20% LiTSFI, and the other samples in the five groups are highly similar in the high-resolution XPS spectra of C1s, N1s, O1s, F1s, S2p, and Li1s, except for the 0% LiTSFI with no peak in the Li1s plot. In the C1s spectrum, the peaks at 284.51 eV, 285.16 eV, and 288.55 eV can be attributed to the C – C or C – H structure, C – O structure and C═O structure, respectively, where the C – H structure and C – O structure can explain the link between the soft and hard segments of the polyurethane; In N1s spectrum, the peak at 399.64 eV explains the N – C structure, indicating that the reaction between HDI and PCL-PET forms a hard segment in the polyurethane structure. In O1s spectrum, the 531.40 eV and 532.03 eV peaks illustrate the O – C structure and O – H, respectively. The F, S, and Li elements characterized in , are all from LiTSFI, and the peaks at 684.40 eV(C – F) and 688.30 eV(O – F) in the F1s spectrum, and 166.59 eV(S – C) and 168.49 eV(S – O) in the S2p spectrum indicate that the reaction between LiTSFI and PCL-PET is not simply soluble in polyurethane solution. It was proved that the product was a copolymer, not a composite material.
Figure 7. (a) The C1s region scan XPS of 20% LiTSFI conductive elastomer; (b) the N1s region scan XPS of 20% LiTSFI conductive elastomer; (c) the O1s region scan XPS of 20% LiTSFI conductive elastomer; (d) the F1s region scan XPS of 20% LiTSFI conductive elastomer; (e) the S2p region scan XPS of 20% LiTSFI conductive elastomer; (f) the Li1s region scan XPS of 20% LiTSFI conductive elastomer.
3.1.2. Fourier transform infrared spectroscopy (FT-IR) characterization
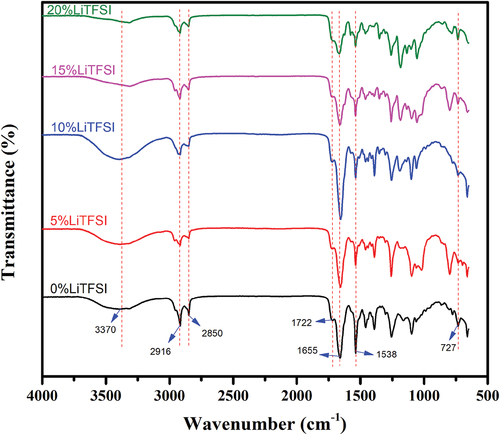
Five samples of electrically conductive elastomers characterized by FT-IR are shown in for their organic groups and structures. The five samples characterize remarkable similarity in their absorption peak. Thus, the mass of LiTFSI does not change the structures of elastomers considerably. The absorption peaking around 3370 cm−1 indicates the elastomers contain the functional groups of hydroxyls(– OH), which can explain the coordinate between hydroxyl groups and lithium cation (Li+). The absorption peaking at 2916 cm−1 and 2850 cm−1 is due to the symmetric and asymmetric vibrations of – CH2. The absorption peaking at 1722 cm−1 is attributed to the easter group connected with the benzene ring at carbon (ArCOOR). Therefore, the main p-phthalic structures from PET plastic are transformed into the structure in the electrically conductive elastomer samples. Amide structures, as expected, can also be seen in the spectroscopy. The absorption peaking at 1655 cm−1 indicates the associated C═O structures, while the absorption peaking at 1538 cm−1 indicates the bending vibration of N – H. The absorptions peaking at 1655 cm−1 and 1538 cm−1 are attributed to the secondary amide structure (RCONHR’). The absorptions peaking at 727 cm−1 are attributed to the secondary amide structure that combines the hard and soft segments to extend chains.
Figure 8. FT-IR spectroscopy of electrically conductive elastomers.
Without purification after the alcoholysis process, there are possible impurities in the product PCL-PET. Because of the reversibility of the transesterification reaction, the PCL-PET product from the alcoholysis process is not pure and the position of the ester group formed by the PET part and PCL part may change among the different oxygen positions on the PET part. However, the position of the ester group in PCL-PET will not significantly affect the basic polyurethane structure of the conductive elastomer and will not significantly affect the mechanism of the elastomer.
3.2. Elemental content analysis
This section analyzes the elemental content of the carbon, hydroxide, and oxygen content of conductive elastomers, and the results are shown in .
Table 2. Carbon, hydrogen, and nitrogen content of conductive elastomers of different masses of LiTSFI.
The longitudinal comparison of carbon, hydrogen, and nitrogen of the five samples finds that the deviation was slight. The carbon content is about 52.3%, the hydrogen content is about 7.7%, and the nitrogen content is about 7.1%, which indicate that the method of preparing conductive elastomers is relatively stable and can be repeated many times. The results are similar, indicating that the preparation method proposed in this study is effective.
3.3. Scanning electron microscopy (SEM) characterization
In this section, the surface structure of conductive elastomers is characterized and analyzed based on scanning electron microscopy (SEM) images, and the results of SEM are shown in . are SEM images of the conductive elastomer surface, measured by 200 times and 2000 times magnification at an accelerating voltage of 5.00 kV, respectively, and are the cross-section scanning electron microscopy images of a conductive elastomer, measured by 500 times and 2000 times magnification at an accelerating voltage of 5.00 kV, respectively.
Figure 9. The surface and cross-section SEM images of conductive elastomers.
The surface of the conductive elastomers conductive elastomers shows cracks which will influence the mechanism but will also provide pathways for electrical charge carriers. However, the roughness of the surface will negatively affect the electric conductivity because it provides more sites for electron scattering, which will increase the resistivity.
3.4. Electrical conductivity properties of electrically conductive elastomers
The conductive properties of the material were analyzed by electrochemical impedance spectroscopy (EIS). The resistance values of conductive elastomers can be easily found in the EIS. The conductivity (ρ) of a conductive elastomer is calculated according to the law of resistance, see EquationEquation 1(1)
(1) .
The conductivity of a conductive elastomer is shown in .
Figure 10. Conductivity rate of electrically conductive elastomers.
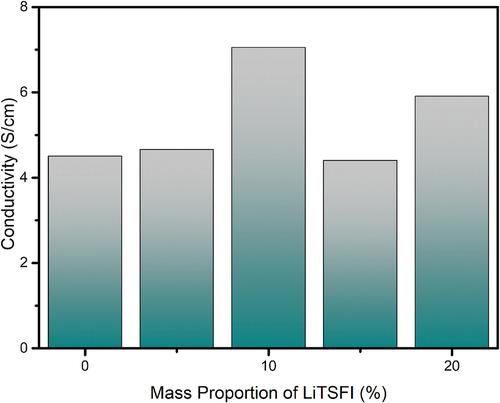
From , it is obvious that the electrically conductive elastomer in which the mass proportion of LiTSFI equals 10% has the best conductive ability of 7.051S/cm2. Most of the elastomers have a conductivity higher than the elastomer, except the elastomer, in which the mass proportion of LiTSFI equals 15%.
Except for the sample, here is the hypothesized reason. The conductivity rate of the elastomers is not equal on the same sample. The conductivity rate changes are not only caused by the mass proportion of LiTSFI, but also caused by the distribution of Li cation particles in the elastomers. Though the reaction temperatures are unified at the same, the LiTSFI itself also emits energy that may cause the temperature of the reaction system to flow within 20°C, which can cause the solidifying part of the solution and cause the Li cation particles and other conductive group structure to concentrate together.
3.5. Thermal diffusivity of electrically conductive elastomers
The thermal diffusivity of conductive elastomers is determined by the LFA 467 HT Hyper Flash device in an air atmosphere and at 25 °C according to the ASTM E 1461 international standard test method. The thermal diffusivity of conductive elastomers is shown in .
Figure 11. Thermal diffusivity of electrically conductive elastomers.
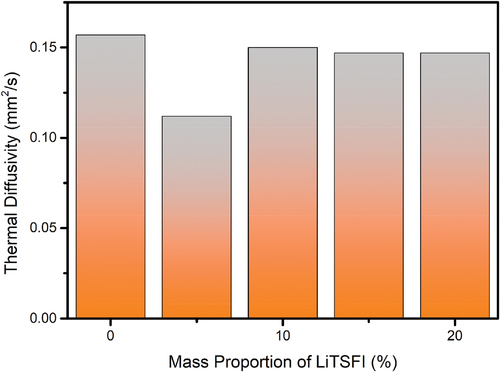
The thermal diffusivity of different types of elastomers does not have great differences. The electrically conductive elastomer in which the mass proportion of LiTSFI equals 0% has the highest rate of 0.157 mm2/s and the electrically conductive elastomer in which the mass proportion of LiTSFI equal to 5% has the lowest rate of 0.112 mm2/s. As a result, the electrically conductive elastomers have a quality of low thermal diffusivity and thus can be used as a kind of heat insulator.
3.6. Stability of the electrically conductive elastomers
The thermal stability of conductive elastomers is characterized based on thermogravimetric analysis (TG). The results of the thermogravimetric analysis are shown in .
Figure 12. Thermogravimetric analysis diagram of conductive elastomers.
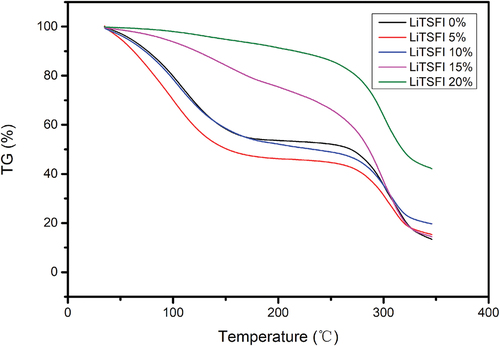
For the elastomers that contain lithium cation, the stabilities of the elastomers increase as the amount of lithium cation is contained. Compared to the elastomers without lithium, the elastomers in which the mass proportion of LiTFSI equals 5% and 10% are less stable. In comparison, the elastomers in which the mass proportion of LiTFSI equals 15% and 20% are significantly more durable. For the sample “LiTSFI 0%,” “LiTSFI 5%,” and “LiTSFI 10%,” there are steps after about 130°C and after about 260°C where the structure of the elastomers may change. For the samples “LiTSFI 15%” and “LiTSFI 20%,” there are only significant changes after 260°C, so their thermal stability, especially for the sample with a 20% mass proportion of LiTSFI, is better. According to the data, it is plausible to hypothesize that the lithium cations coordinated with the organic groups contribute to the increase in stability of the elastomers. Lithium ions can participate in crosslinking reactions within the elastomer matrix, promoting the formation of physical or chemical crosslinks between polymer chains. This crosslinking can enhance the mechanical strength, stiffness, and dimensional stability of the elastomer. As a result, the electrically conductive elastomers can operate as a mechanical part in limited temperature conditions.
3.7. Light transmittance
The transmittance analysis sample is the transmittance of 20% LiTSFI conductive elastomer at wavelengths from 390 nm to 1000 nm, as shown in .
Figure 13. Light transmittance of conductive elastomers.
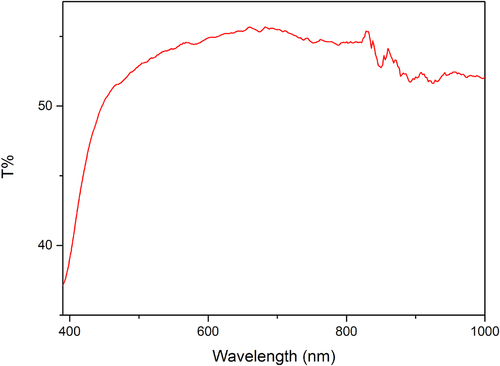
The light transmittance test determines the light transmittance of conductive elastomers in the visible to near-infrared light range. The light transmittance is poor in the range of violet and blue light, and the light transmittance to yellow, orange, and red light is about 60%. When the wavelength increases to the near-infrared range, the transmittance decreases significantly. Therefore, the conductive elastomers prepared by this method have moderate light transmittance in wavelength between 500 nm to 800 nm and poor light transmittance in the short wavelength light range.
From , it is obvious that the elastomer gradually turns yellow as time flows. This is because of the oxidation of the isocyanate group under the high temperature of the reaction, leading to the formation of yellow-colored compounds which can affect the light transmittance.
From these properties, it is possible that the conductive elastomers can be used in wearable technology enabling selective illumination and environmental sensing, and optoelectronic sensors because of the specific light transmittance (600-800 nm) for color sensing, spectroscopy, or optical communication.
4. Conclusion
In the process of synthesizing conductive elastomers, the most important thing is to avoid the effect of the heat emitted by LiTSFI on the conductivity of the material. In this study, PCL-PET was used to prepare conductive elastomers. The final product has the following advantages:
1. High electrical conductivity;
2. Low thermal diffusivity;
3. Excellent thermal stability;
4. Good light transmittance.
The method provided by this study expands the research field of PET plastic recycling. Compared to other research in the same field, this research combines the preparation of conductive elastomers with PET plastic and prepares a kind of non-composite elastomer while others are usually composite. It can help provide a new way and direction for new environmentally friendly materials obtained from plastics.
4.1. Prospect
The preparation of conductive elastomers from PET plastic is a new link in PET recycling and conductive elastomer preparation, which is significant for PET recycling and conductive elastomer preparation. From PET alcoholysis to copolymer-type conductive elastomers, waste plastics can be turned into materials that can be applied to electronic components, reducing pollution and turning waste into value. However, the conductive elastomer prepared in this study also has shortcomings because the elastomer hard chain converted from PET contains a benzene structure, so the elastomer has strong rigidity and poor flexibility, so it is not suitable for application as a conductive element that requires a flexible base.
In general, the conductive elastomer prepared from the alcoholization product of waste PET plastic has several excellent properties, such as excellent conductivity and thermal stability, which is a new development in the preparation of conductive elastomer and the recycling and reuse of PET plastics.
Acknowledgments
Thanks for the opportunity given by The Beijing Youth Top Talent Training Program; Thanks Professor Xingmei Lu from IPE (Institute of Process Engineering), CAS (Chinese Academy of Science) for her professional instructions and support from the beginning to the end of the project. The data of the thesis are all from my experiments carried out by myself, and the thesis is fully fulfilled on my own. I sincerely thank all the people who gave help and encouragement during the research.
Disclosure statement
No potential conflict of interest was reported by the author(s).
Additional information
Funding
References
- United States Environmental Protection Agency. (2023, April 23). Facts and Figures about Materials, Waste and Recycling Plastics: Material-Specific Data. Epa.gov. https://www.epa.gov/facts-and-figures-about-materials-waste-and-recycling/plastics-material-specific-data#PlasticsTableandGraph
- Zhu, Y.; Cao, C.; Chen, Q.; Luo, Y. Application of PET Alcoholysis Products in the Synthesis of Polyurethane Elastomers and Its Curing Kinetics. J Res. Sci. Eng. 2022, (3). DOI: 10.53469/JRSE.2022.04(03).03.
- Congrong, Z.; Linhong, A. Progress and Prospects of Polyethylene Terephthalate Recovery Technology. China Plastics. (10), 2001, DOI: 10.19491/j.1001-9278.2001.10.020
- Mei, Z.; Sijia, L.; Weifeng, X.; Huangjinbao, L. X.; Lei, W. Theoretical Study on the water/alcohol/ammonia Hydrolysis Mechanism of Ethylene Glycol Terephthalate Dimer. China Plastics. 2023, 1, 90–98. DOI: 10.19491/j.1001-9278.2023.01.014
- Jutao, L.; Jianzhong, Y. Methanol Alcoholysis Recovery Technology for Waste PET Polyester. Chemical Equipment Technology. 2022, (5), 5–10. DOI: 10.16759/j.cnki.1007-7251.2022.10.002.
- Guoxi, X.; Xinyan, X.; Chen, S. Study on the Alcoholysis Conditions of Waste Polyester. Environmental Science Research. 2004, (5), 38–40. DOI: 10.13198/j.res.2004.05.40/xigx.010.
- Chunxiu, L. Research Progress in Chemical Depolymerization of Waste Polyethylene Terephthalate and Its Product Application. Petrochemical Technology and Economics. 2023, (2), 58–62.
- Zhiyang, L.; Kun, J.; Zhenzhou, N.; Guanqun, Z.; Jiang, Q.; Xinxin, H.; Quan, L. Soft and Hard Crosslinked copolymer-based Ion Conductive Elastomers. Acta Polymerica Sinica. 2023, 54(9). DOI: 10.11777/j.issn1000-3304.2023.23062.
- Qunyang, L.; Hui, H.; Cheng, Z.; Xutong, L.; Yue, S. Research on Synthesis of Polyurethane Based on a New Chain Extender Obtained from Waste Polyethylene Terephthalate. J. Appl. Polym. Sci. 2022, (25). DOI: 10.1002/APP.52402.
- Yue, Y.; Fu Sheng, D.; Zi Chen, L. Highly Stretchable, Self-Healable, and Adhesive Polyurethane Elastomers Based on Boronic Ester Bonds. ACS Appl. Poly. 2020, (12). DOI: 10.1021/ACSAPM.0C00941.
- Jia, T.; Tian, H.; Liu, S.; Zhang, S.; Ning, N.; Yu, B.; Tian, M.; Tian, M.; Tian, M.; Tian, M. Erucamide/thermoplastic Polyurethane Blend with Low Coefficient of Friction, high Elasticity and Good Mechanical Properties for Intelligent Wearable Devices. Polym. Int. 2022, 71(9), 292–300. DOI: 10.1002/PI.6483.
- Zhongxing, S. Effect of Crosslinked Structure on Properties of Polyurethane Elastomers (Master’s Thesis, Qingdao University of Science and Technology, (2022). https://kns.cnki.net/KCMS/detail/detail.aspx?dbname=CMFD202301&filename=1022568953.nh).
- Shi, L.; Zhu, T.; Gao, G.; Ding, S.; Wei, W.; Liu, W.; Ding, S. Highly Stretchable and Transparent Ionic Conducting Elastomers. Nat. Commun. 2018, 9(1). DOI: 10.1038/s41467-018-05165-w.
- Liu, L.; Hao, P.; Zhang, R.; Zhang, Y.; Qing, Z.; Lu, X.; Yan, D.; Li, Y.; Shi, C. Preparation of High-performance Polyurethane Elastomers via Direct Use of Alcoholyzed Waste PET by High Molecular Weight Polyester Diols. J. Appl. Polym. Sci. 2023, 140(31). DOI: 10.1002/app.54238.
- Jun, G.; Jianzhong, L.; Qidu, R.; Sanbao, Y.; Xiaobing, Q.; Jian, C.; Kai, Z. Industrialization of Bis (Trifluoromethylsulfonyl) Imine Lithium, a Specialized Chemical for Lithium Batteries. September 15th, 2023, https://kns.cnki.net/KCMS/detail/detail.aspx?dbname=SNAD&filename=SNAD000001970830 (2022 July 11).