
 ?Mathematical formulae have been encoded as MathML and are displayed in this HTML version using MathJax in order to improve their display. Uncheck the box to turn MathJax off. This feature requires Javascript. Click on a formula to zoom.
ABSTRACT
The combination of efonidipine hydrochloride and telmisartan is used in the treatment of hypertension. Simultaneous estimation of both drugs in marketed formulation was carried out by using an accurate and precise isocratic RP – HPLC method. Symmetry® C18 (250 × 4.6 mm, 5 µm) column as a stationary phase and acetonitrile (ACN): 0.05 M Potassium dihydrogen phosphate buffer (75:25, v/v) as a mobile phase with a flow rate of 1 ml/min was used for the study. Detection was carried out at 251 nm. The developed method was found to be linear in the concentration range of 0.2 – 15 µg/ml for both drugs with correlation co-efficient of 0.998 for efonidipine and 0.996 for telmisartan. The proposed method was validated as per ICH Q 2 (R1) guideline. Forced degradation study was carried out to find out instrinsic stability of both the molecules. Efonidipine was found to be susceptible to base hydrolysis and oxidative stress degradation while telmisartan was stable in acid-base hydrolysis, oxidative stress, dry heat and photo stability testing conditions. Drug content in tablet dosage form is determined by proposed method where it exhibited good recovery which shows the applicability of method for analysis of combination of drugs.
1. Introduction
Efonidipine hydrochloride (EFD) is chemically 2- (N-benzylanilino) ethyl 5- (5, 5-dimethyl-2-oxo-1, 3, 2λ5-dioxaphosphinan-2-yl)-2, 6-dimethyl-4-(3-nitrophenyl)-1, 4-dihydropyridine-3-carboxylate (). Efonidipine is a dihydropyridine calcium channel blocker used to treat the hypertension and angina pectoris. It inhibits both L- and T-type calcium channels, thereby leading to vasodilation and decrease the automaticity of heart.[Citation1] Telmisartan (TEL) is chemically 2-[4-[[4-methyl-6-(1-methylbenzimidazol-2-yl)-2-propylbenzimidazol-1-yl] methyl] phenyl] benzoic acid (). Telmisartan is an angiotensisn-II subtype AT1 receptor antagonist which lowers the high blood pressure and prevents the heart strokes, heart attacks and kidney problems.[Citation2] EFD and TEL are used in treatment of hypertension. Combination of Efonidipine and Telmisartan is mainly used to treat hypertension as it provides effective control of blood pressure through synergistic mechanism, Efonidipine causes vasodilation of arterioles and Telmisartan counteracts the stimulation of RAAS (Renin- Angiotensin – Aldosterone System) and is used to reduce the incidence of peripheral edema.[Citation3]
Figure 1. Chemical structure of efonidipine hydrochloride.
Figure 2. Chemical structure of telmisartan.
Different methods like RP – HPLC, LC – MS/MS, LC – MS/NMR and UV spectroscopic methods have been developed for estimation of Efonidipine hydrochloride alone and its combination with other drug molecules,[Citation4–9] while UV – Visible Spectroscopy, HPTLC, UPLC, and RP – HPLC method have been developed for estimation of Telmisartan and its combination with other drugs.[Citation10–19] For the combination of Efonidipine hydrochloride with Telmisartan RP – HPLC[Citation20–23] and UV Spectroscopic methods[Citation24,Citation25] have been developed. Present study involves development of sensitive and stability indicating high performance liquid chromatographic estimation of EFD and TEL in combination from pharmaceutical dosage form.
2. Experimental
2.1. HPLC instrument
The HPLC instrument consising of Waters HPLC System with Symmetry® C18 (250 × 4.6 mm, 5 µm) column was used as stationary phase, Empower software and photodiode array detector was employed in the system.
2.2. Selection of analytical wavelength
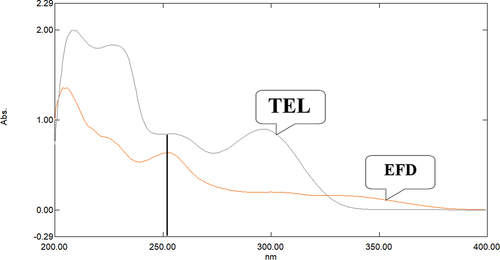
The solution of EFD and TEL was prepared in methanol individually at a concentration of 10 μg/ml and scanned in the wavelength range of 400-200 nm. Appreciable absorbance was shown at 251 nm analytical wavelength, which was selected based on overlay spectrum of EFD and TEL.
2.3. Optimized chromatographic condition
Symmetry® C18 (250 × 4.6 mm, 5 µm) column was used as stationary phase and acetonitrile (ACN): 0.05 M Potassium dihydrogen phosphate buffer (75:25 v/v) was used as mobile phase for isocratic separation of the compounds. Flow rate of the optimized chromatographic system was 1 ml/min and UV detection was carried out at 251 nm.
2.4. Preparation of standard stock solution
Weigh accurately 10 mg of both drugs and transfer it into two different volumetric flasks having capacity of 10 ml. Few ml of methanol (5 ml) are added to each flask and dissolve the content of drug into methanol, make up the volume up to the mark on the volumetric flask by using methanol to yield a concentration of 1000 µg/ml for both drugs. Pipette out 1 ml from the above stock solution to the two individual flask and transferred it into the another 10 ml volumetric flask, dilute the content of flask with methanol up to the mark for obtained working standard solution of 100 µg/ml of both drugs.
2.5. Preparation of calibration curve
From the above prepared stock solution, appropriate aliquots were taken in different 10 mL volumetric flasks and volume was made up to the mark with mobile phase to obtain final concentration of 0.2 – 15 µg/ml. Total six calibration curves were taken and retention time and peak area were noted. Graph was plotted between peak area and concentration and linear regression equation was computed.
2.6. Validation
Validation of developed RP-HPLC method was carried out as per International Council for Harmonization of Technical Requirements for Pharmaceuticals for Human Use (ICH) guideline (Reference). ICH Q2 R (1) guideline was used as the reference guideline for validating the developed RP-HPLC method.
2.6.1. Linearity
Linearity in the response of developed method was evaluated by determining the calibration curve at range of different concentration of 0.2 – 15 µg/ml for EFD and TEL both drugs. The calibration curve was established by plotting peak area versus concentration (n = 6) and straight line equation was founded.
2.6.2. Precision
2.6.2.1. Repeatability
Repeatability was carried out by terms of injection repeatability. Injection repeatability study was performed by using solution of EFD and TEL having concentration of 5 µg/ml. Injection of both drugs were applied to the system and peak area was determined. Using this peak area %RSD was measured for injection repeatability.
2.6.2.2. Intermediate precision
Intermediate precision was carried out by two methods; interday precision and intraday precision. Interday precision was carried out by analyzing the solution having lowest (0.2 µg/ml), middle (5 µg/ml) and highest (15 µg/ml) concentration of linear range used for calibration curve. Analysis of three different solvent carried out on three different successive days. Intraday precision was carried out by analyzing the solution having lowest (0.2 µg/ml), middle (5 µg/ml) and highest (15 µg/ml) concentration of linear range used for calibration curve. Analysis of three different solvent carried out for three times on same day. From analysis peak area was obtained. Mean of area and %RSD was calculated using peak area of all the concentration.
2.6.3. Trueness
The trueness of the method was determined by calculating recovery of EFD and TEL by method of standard addition at 0, 50, 100 and 150 % levels. Known amount of EFD and TEL (0 µg/ml, 2.5 µg/ml, 5 µg/ml and 7.5 µg/ml) were taken from the stock solution of 100 µg/ml of EFD and TEL and added to pre-quantified sample of EFD and TEL. Amount of both drugs EFD and TEL was estimated by measuring the peak area and back calculated concentrations were determined by putting that value to the straight line equation of calibration curve.
2.6.4. Validation of lower range limits
Validation of lower range limits was determined by LOD (Limit of Detection) and LOQ (Limit of Quantification). These two parameters were calculated from the standard deviation of range of linear response and slope of the response. LOD was calculated as 3.3 times to the ratio of standard deviation of response and slope of the calibration curve; while LOQ was calculated 10 times to the ratio of standard deviation of response and slope of the calibration curve.
Where, σ is the standard deviation of the response
S is the slope of the calibration curve.
2.6.5. Robustness
Robustness was carried out by bringing the deliberate changes in wavelength, mobile phase composition and saturation time. Analysis of solution having concentration (5 µg/ml) of both drugs was determined by bringing all the changes toward the condition individually. Effects of changes in conditions were examined by calculating the mean area, mean Rt and %RSD from obtained Rt and peak area from the analysis.
2.6.6. Specificity
Synthetic mixture was prepared using Efonidipine hydrochloride (200 mg), Telmisartan (200 mg), microcrystalline cellulose (1 g), Pregelatised Starch (200 mg), Lactose (900 mg), Sodium carboxymethyl starch {CMS-Na (60 mg)}, Magnesium Stearate (40 mg) and 95% ethanol. It was appropriately diluted and analyzed by optimized condition.
2.7. Force degradation study
For finding intrinsic stability of drugs the force degradation study was carried out where individual API and mixture of both API were subjected to different stress conditions. The working solution of 10 µg/ml of both drugs (EFD and TEL) was used for the forced degradation study. Different stress conditions, i.e. acid hydrolysis, base hydrolysis, oxidation, thermal stability and photo stability, were carried out.
2.7.1. Acid hydrolysis
Aliquot (2.5 ml) of the EFD solution (100 µg/ml) was taken in to 25 ml volumetric flask, add 2.5 ml of 0.1 M HCl solution. The resultant solution was heated at 70° C for four hours. Solution was allowed to cool at room temperature, and neutralize by adding 2.5 ml of 0.1 M NaOH solution. Volume was made upto the mark with solution of mobile phase. From the above solution injection was applied to the system. Repeat the same procedure for another drug TEL. Aliquot (2.5 ml) of EFD solution (100 µg/ml) and TEL solution (100 µg/ml) was taken in to 25 ml volumetric flask and the procedure was followed as above for carrying out study of the mixture.
2.7.2. Alkali hydrolysis
2.7.2.1. Condition 1
Aliquot (2.5 ml) of the EFD solution (100 µg/ml) was taken in to 25 ml volumetric flask, add 2.5 ml of 0.1 M NaOH solution. The resultant solution was heated at 70° C for two hours. Solution was allowed to cool at room temperature, and neutralize by adding 2.5 ml of 0.1 M HCl solution. Volume was made upto the mark with solution of mobile phase. From the above solution injection was applied to the system. Repeat the same procedure for another drug TEL. Aliquot (2.5 ml) of EFD solution (100 µg/ml) and TEL solution (100 µg/ml) was taken in to 25 ml volumetric flask and the procedure was followed as above for carried out study of the mixture.
2.7.2.2. Condition 2
As the EFD was shown some degradant peak to above degradation condition, the same procedure was repeated for four hours, at 70° C.
2.7.3. Photo stability
Powder of EFD and TEL was exposed to the UV light for 24 hours and 10 mg of drug were taken into two different volumetric flasks (10 ml). Few ml of methanol was added to flask for dissolving powder and then volume was made with methanol up-to the mark. Pipette out 1 ml from the above stock solution (1000 µg/ml) and transfer it to another two volumetric flask of 10 ml, content was diluted with methanol for yields a standard solution (100 µg/ml). Another dilution of standard solution was carried out by using solution of mobile phase and resultant solution (10 µg/ml) was injected into the system.
Pipette out 1 ml of EFD (100 µg/ml) and TEL (100 µg/ml) solution and transferred in same flask, content was diluted with solution of mobile phase for yields a solution (10 µg/ml) of a mixture of drugs. From the above solution injection was applied to the system.
2.7.4. Oxidative stress degradation
Aliquot (2.5 ml) of the EFD solution (100 µg/ml) was taken in to 25 ml volumetric flask, add 2.5 ml of 3 % H2O2 solution. The resultant solution was heated at 70° C for twenty minutes. Solution was allowed to cool at room temperature, and volume was made upto the mark with solution of mobile phase. From the above solution injection was applied to the system. Repeat the same procedure for another drug TEL. Aliquot (2.5 ml) of EFD solution (100 µg/ml) and TEL solution (100 µg/ml) was taken in to 25 ml volumetric flask and the procedure was followed as above for carried out study of the mixture.
2.7.5. Thermal stability degradation
Powder of EFD and TEL was exposed to the dry heat for one hour at 70-80° C and 10 mg of drug powder were taken into two different volumetric flasks (10 ml). Few ml of methanol was added to flask for dissolving powder and then volume was made with methanol upto the mark. Pipette out 1 ml from the above stock solution (1000 µg/ml) and transfer it to another two volumetric flask of 10 ml, content was diluted with methanol for yields a standard solution (100 µg/ml). Another dilution of standard solution was carried out by using solution of mobile phase; resultant solution (10 µg/ml) was injected to the system. Repeat the same procedure for another drug TEL.
Pipette out 1 ml of EFD (100 µg/ml) and TEL (100 µg/ml) solution and transferred in same flask, content was diluted with solution of mobile phase for yields a solution (10 µg/ml) of a mixture of drugs. From the above solution injection was applied to the system.
2.3. System suitability
Different system suitability parameters (Retention factor, Number of theoretical plate/Column efficiency, Resolution and Tailing factor) were calculated by analyzing the middle concentration (5 µg/ml) of mixture of both drugs.
2.4. Analysis of marketed formulation
Twenty tablets were weighed and powdered. The powder equivalent to the 10 mg of EFD (and TEL) was accurately weighed and was transferred to the 10 ml volumetric flask. Few ml of methanol was added and then it was sonicated for 10 minutes and filtered using Whatman filter paper No. 45 in another 10 ml volumetric flask. Volume was made upto the mark with methanol which gave 1000 µg/ml of EFD and TEL. Appropriate aliquot 1 ml of solutions was taken in separate 10 ml volumetric flask diluted with methanol up to the mark which gave 100 µg/ml of EFD and TEL. Pipette out 0.5 ml from above solution in another 10 ml volumetric flask and volume was made up to the mark with methanol to get the middle concentration (5 µg/ml) of calibration range. From this solution injection were applied and analyzed by the proposed chromatographic method. Back calculated concentrations were determined and percentage amount of EFD and TEL were computed using regression equation.
3. Results
3.1. Selection of detection wavelength
The solution of Efonidipine hydrochloride and Telmisartan was prepared in methanol in separate volumetric flask to achieve the concentration of 10 µg/ml. The solution was scanned at wavelength range of 400-200 nm. The wavelength 251 nm was selected as analytical wavelength as both the drugs having considerable absorbance. The spectra for both drugs are shown in .
Figure 3. UV spectra of both drugs for selection of analytical wavelength.
3.2. Optimization of mobile phase
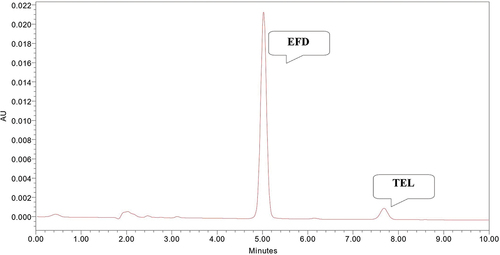
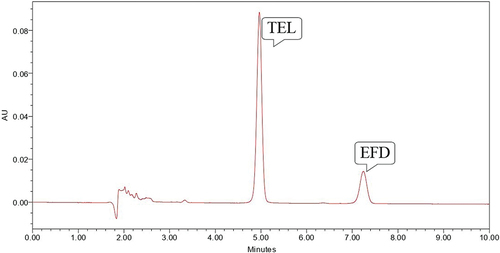
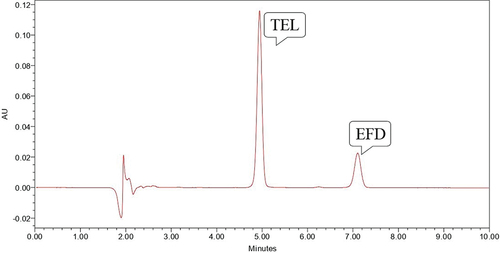
Acetonitrile: Potassium dihydrogen phosphate buffer (75:25 v/v) mobile phase in isocratic condition gave well resolved peak for EFD and TEL with retention time of 7.4 and 5.0 minute with tailing factor of 1.05 and 0.98, respectively (). So, it was selected as mobile phase for chromatographic development. The mobile phase flow rate was maintained at 1 ml/min.
Figure 4. Chromatogram of EFD and TEL in optimized mobile phase.
3.3. Validation of developed method
The developed RP – HPLC method was found to be linear in the concentration range of 0.2 – 15 µg/ml with correlation coefficient (r2) of 0.998 (EFD) and 0.996 (TEL). The regression analysis of calibration curve of EFD and TEL are tabulated in . Precision study was performed by checking the scanning and injection repeatability and intermediate precision was carried out in terms of interday precision and intraday precision. Value of %RSD for scanning repeatability of EFD and TEL was found to be 0.94 and 0.55, respectively while for the injection repeatability it was found to be 0.66 and 0.42, respectively. Lower value of %RSD is indicating the preciseness of the method. Results of intermediate precision (Intraday precision and interday precision) are shown in .
Table 1. Regression analysis of calibration curve of EFD and TEL.
Table 2. Intermediate precision of EFD and TEL.
Trueness of the developed method was performed by standard addition method. Where, percentage recovery for EFD and TEL was found to be 98.30 – 99.49 %w/w and 98.07 – 99.26 %w/w, respectively (). The percentage recovery of both drugs was nearer to 100 % w/w which indicates that the developed method is accurate.
Table 3. Summary of validation parameter of EFD and TEL.
The detection limit and quantification limit for EFD were found to be 0.12 µg/ml and 0.37 µg/ml, respectively while for TEL it was found to be 0.10 µg/ml and 0.30 µg/ml, respectively (). Robustness study was performed by bringing some deliberated changes in experimental conditions like detection wavelength was changed from 251 nm to 250 nm and 252 nm, flow rate of mobile phase was changed from 1 ml/min to 0.9 ml/min and 1.1 ml/min, mobile phase composition was changed from 75:25 v/v to 70:30 v/v and 80:20 v/v. In all three different conditions the value of %RSD was found to be less than 2 % ().
Table 4. Robustness studies of EFD and TEL.
3.4. Forced degradation study
The forced degradation was performed using 0.1 N HCl for 4 hours where both drugs were found to be stable and no degradation peak was observed ().
Figure 5. Chromatogram showing peak of TEL (10 µg/ml) and EFD (10 µg/ml) at 70° C for 4 hours in 0.1 N HCl.
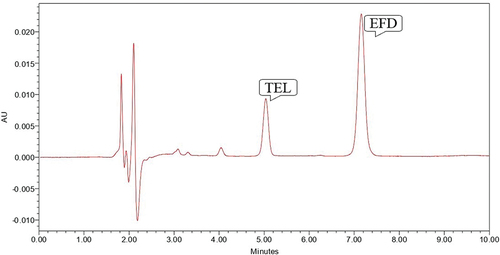
Base hydrolysis was performed using 0.1 N NaOH for 2 hours where EFD was susceptible to base hydrolysis which gave degradation peak at Rt value of 3.81, 4.52, 6.35 minutes and TEL was found to be stable to the proposed degradation condition (). So study was repeated for 4 hours at 70°C which shows that EFD was very susceptible to the degradation condition and gaves the degradation peak at Rt of 3.82, 4.52 and 6.22 minute which shows that no peak of EFD was observed, but TEL was found to be stable to proposed degradation condition ().
Figure 6. Chromatogram showing peak of TEL (10 µg/ml) and EFD (10 µg/ml) at 70° C for 2 hours in 0.1 N NaOH.
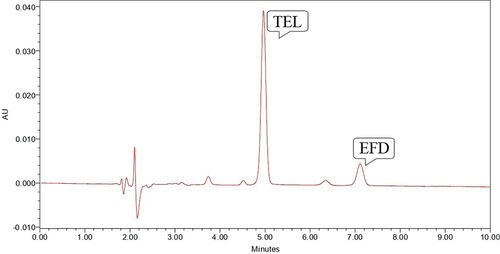
Figure 7. Chromatogram showing peak of TEL (10 µg/ml) and EFD (10 µg/ml) at 70° C for 4 hours in 0.1 N NaOH.
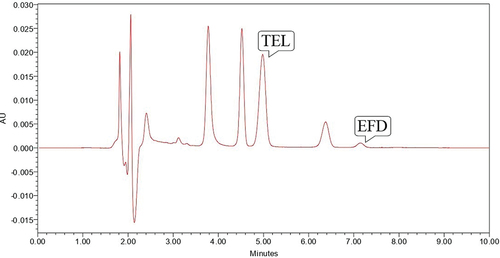
Oxidative stress degradation was performed using 3% H2O2, EFD was found to be susceptible to oxidative stress and gave degradation peak at Rt value of 3.32 minute while TEL was found to be stable ().
Figure 8. Chromatogram showing peak of TEL (10 µg/ml) and EFD (10 µg/ml) at 70° C for 60 minutes in 3% H2O2.
Dry heat degradation was performed by heating both the drugs at 70° C for 2 hours. Both the drugs were found to be stable and no degradation was observed (). Photo stability testing was performed by exposing drug to UV light for 24 hours and both the drugs were found to be stable ().
Figure 9. Chromatogram showing peak of TEL (10 µg/ml) and EFD (10 µg/ml) at 70–80° C for 120 minutes.
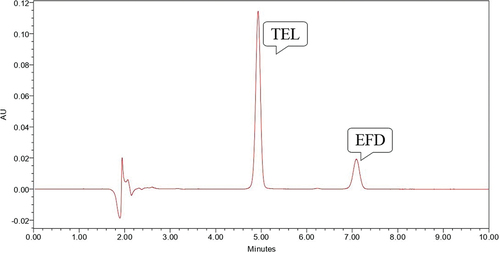
Figure 10. Chromatogram showing peak of TEL (10 µg/ml) and EFD (10 µg/ml) under UV Light for 24 hours.
EFD was found to be susceptible to base hydrolysis and oxidative stress degradation while TEL was stable in acid-base hydrolysis, oxidative stress, dry heat and photo stability testing conditions. Data of all conditions for forced degradation study was shown in .
Table 5. Result of stability study of proposed method.
4. System suitability
Result of different system suitability parameters (Theoretical plate, Tailing Factor, Resolution and retention time) are tabulated in . All the parameters are suitable as per the standard limitations.
Table 6. Result of system suitability parameters for developed method of EFD and TEL.
4.1. Greenness evaluation of method
The developed HPLC method was evaluated for greenness by using AGREE GREEnness software.[Citation26] Twelve principles of green analytical chemistry were evaluated for the developed method and a score was generated. AGREE method is based on the analytical method throughput, sample size, uses of bio-based solvents, toxicity, sources of reagent and energy consumption. The greenness score obtained for the developed method was 0.59 which is close to 1.0, representing the greenness of the method.
4.2. Analysis of marketed formulation
The proposed method was applied for the quantification of EFD and TEL in their pharmaceutical dosage form. The % amount of drug was found to be 100.04 % for EFD and 99.26% for TEL.
5. Conclusion
Accurate and precise stability indicating RP – HPLC method has been developed for simultaneous estimation of EFD and TEL. Symmetry® C18 (250 × 4.6 mm, 5 µm) column was used as stationary phase and acetonitrile (ACN): 0.05 M Potassium dihydrogen phosphate buffer (75:25, v/v) was used as mobile phase in optimized chromatographic condition. The developed method was found to be linear in the concentration range of 0.2 – 15 µg/ml for both drugs with correlation co-efficient of 0.998 for efonidipine and 0.996 for telmisartan. The proposed method was validated as per ICH Q 2 (R1) guideline. Forced degradation study was carried out and EFD was found to be susceptible to base hydrolysis and oxidative stress degradation while TEL was stable in acid-base hydrolysis, oxidative stress, dry heat and photo stability testing conditions. All degradants peaks were well resolved from drug peak. Compared to reported HPLC method,[Citation20–23] the developed method is more sensitive and uses a simpler mobile phase. In reported stability indicating HPLC method,[Citation22] telmisartan gets eluted closer to void volume which affects resolution between degradants and drug peak. The developed method has comparable accuracy and precision with respect to reported methods. The proposed method can be used for routine analysis of stability sample as well as quality control analysis of both the drugs in formulation.
Disclosure statement
No potential conflict of interest was reported by the author(s).
Additional information
Funding
References
- Pubchem. Efonidipine Hydrochloride. https://pubchem.ncbi.nlm.nih.gov/compound/Efonidipine. (September 2022).
- Pubchem. Telmisartan. https://pubchem.ncbi.nlm.nih.gov/compound/Telmisartan. (September 2022).
- Shreya, A. Analytical Method Development and Validation for Simultaneous Estimation of Efonidipine Hydrochloride and Telmisartan in Their Synthetic Mixture. M. Pharm Thesis, Ahmedabad, Gujarat, India: Gujarat Technological University, May 2020. May
- Ashish, R.; Durgesh, J.; Sharda, G.; Devanshi, S.; Purnima, A. RP-HPLC Method Development and Validation for the Quantification of Efonidipine Hydrochloride in HME Processed Solid Dispersions. Future J. Pharm. Sci. 2020, 6, 1–9.
- Kumar, A.; Shoni, S. K.; Dahiya, M.; Kumar, R. Development and Validation of Liquid Chromatography (RP-HPLC) Methodology for Estimation of Efonidipine HCl Ethanolate (EFD). Pharm. Anal. Acta. 2017, 8, 08.
- Vishal, B.; Heena, N.; Ritika, G.; Mitali, D.; Umesh, U. Development and Validation of Analytical Methods for Estimation of Efonidipine, Telmisartan and Chlorthalidone in Synthetic Mixture. Int. J. Creat. Res. Thoughts. 2022, 10, 379–405.
- Man, L.; Hongna, Z.; Yang, T.; Dan, Z.; Xiaolin, W.; Lina, Z.; Jing, H.; Huichen, L. Determination of Efonidipine in Human Plasma by LC-MS/MS for Pharmacokinetic Applications. J. Pharm. Biomed. Anal. 2014, 11, 1–10.
- Pandya, C.; Rajput, S. Forced Degradation Study of Efonidipine HCl Ethanolate, Characterization of Degradation Products by LC-Q-TOF-MS and NMR. J. Appl. Pharm. Sci. 2020, 10, 75–99.
- Dipika, S.; Dhara, P. Development and Validation of UV Spectrophotometric Method for Simultaneous Estimation of Efonidipine Hydrochloride Ethanolate and Chlorthalidone in Their Synthetic Mixture. Drug Anal. Res. 2022, 6(1), 27–34. DOI: 10.22456/2527-2616.125170.
- Sonali, R.; Santosh, W.; Chaudhary, P. UV-spectrophotometric Method for Estimation of Telmisartan in Bulk and Tablet Dosage Form. Int. J. Pharm. Sci. Res. 2012, 3, 3936–3939.
- Dixita, M.; Paresh, P. Development and Validation of Simultaneous Equation Method for Simultaneous Estimation of Telmisartan and Nifedipine in Synthetic Mixture. Int. Res. J. Pharm. 2016, 7(5), 6–9. DOI: 10.7897/2230-8407.07542.
- Komal, P.; Amit, P.; Jayant, D.; Chaganbhai, P. Absorbance Correction Method for Estimation of Telmisartan and Metoprolol Succinate in Combined Tablet Dosage Form. Pharm. Methods. 2012, 3(2), 106–111. DOI: 10.4103/2229-4708.103891.
- Bankey, S.; Tapadiya, G.; Saboo, S.; Bindaiya, S.; Deepti, J.; Khadbadi, S. Simultaneous Determination of Ramipril, Hydrochlorothizide and Telmisartan by Spectrophotometry. Int. J. ChemTech Res. 2009, 1(2), 183–188.
- Riddhi, P.; Dilip, M. UV Spectrophotometric Methods for Simultaneous Estimation of Telmisartan and Cilostazol in Synthetic Mixture. Int. J. Pharm. Sci. 2015, 6, 276–291.
- Suruliven, R. Determination of Telmisartan by HPTLC — A Stability Indicating Assay. J. Planar Chromatogr. Mod. TLC. 2007, 20, 65–69.
- Kapendra, S.; Shikha, S.; Mohammad, S.; Anees, S. Comparative Study of Forced Degradation Behavior of Telmisartan by UPLC and HPLC and Development of Validated Stability Indicating Assay Method according to ICH Guidelines. J. Chromatogr. Sep. Tech. 2012, 3, 1–6.
- Wankhede, S.; Tajne, M.; Gupta, K.; Wadodkar, S. RP – HPLC Method for Simultaneous Estimation of Telmisartan and Hydrochlorthiazide in Tablet Dosage Form. Indian J. Pharm. Sci. 2007, 69(2), 298–300. DOI: 10.4103/0250-474X.33164.
- Jawla, S.; Jeyalakshmi, K.; Krishnamurthy, T.; Kumar, Y. Development and Validation of Simultaneous HPLC Method for Estimation of Telmisartan and Ramipril in Pharmaceutical Formulations. Int. J. Pharm Tech Res. 2010, 2, 1625–1633.
- Izzathullah, S.; Medidi, S. Simultaneous Estimation of Telmisartan and Cilnidipine in Bulk and in Tablet Formulation Using RP – HPLC. Int. J. Adv. Pharm. Sci. 2014, 5(3), 2142–2148.
- Grishma, P.; Shreya, A.; Dhananjay, M. RP-HPLC Method Development and Validation for Simultaneous Estimation of Efonidipine Hydrochloride Ethanolate and Telmisartan in Their Synthetic Mixture. Int. J. Pharm. Drug Anal. 2021, 9, 190–194.
- Priyal, K.; Ashok, P.; Jayant, C.; Ashvin, D. Analytical Method for Simultaneous Estimation of Efonidipine Hydrochloride Ethanolate and Telmisartan By Validated RP-HPLC Method. J. Med. Pharm. Apll. Sci. 2021, 2, 4154–4158.
- Mrunalini, D.; Shubhangi, B.; Shankar, M. Stability Indicating HPLC Method for Efonidipine and Telmisartan in Combination. Int. J. Pharm. Res. Appl. 2024, 9, 1575–1583.
- Vishal, B.; Heena, N.; Ritika, G.; Mitali, D.; Umesh, U. Development and Validation of Analytical Method for Estimation of Efonidipine, Telmisartan and Chlorthalidone in Synthetic Mixture. Int. J. Creat. Res. Thoughts. 2022, 10, 379–405.
- Ashvin, D.; Ashok, P.; Jayant, C.; Dhruvanshi, G.; Priyal, K. Spectrophotometric Simultaneous Determination of Efonidipine Hydrochloride Ethanolate and Telmisartan in Synthetic Mixture by First Order Derivative Method. J. Med. Pharm. Allied Sci. 2022, 2, 4547–4551.
- Shreya, A.; Grishma, P.; Dhananjay, M. Development and Validation of Three Novel UV Spectrophotometric Methods for Simultaneous Estimation of Efonidipine Hydrochloride Ethanolate and Telmisartan in Their Synthetic Mixture and its Comparison Using ANOVA. J. Med. Chem. Sci. 2021, 4, 145–153.
- Francisco, P.; Wojciech, W.; Marek, T. AGREE-Analytical GREEnness Metric Approach and Software Analytical Chemistry. Anal. Chem. 2020, 92(14), 10076–10082. DOI: 10.1021/acs.analchem.0c01887.