
ABSTRACT
This study examined treatment of anal fissure disease using newer combination of Lidocaine hydrochloride (HCl; LID) and Diltiazem HCl (DIL). Although both are old drugs, the combination is new for treatment. A simple and validated reversed-phase high-performance liquid chromatographic (RP-HPLC) method has been developed for simultaneous quantification of LID and DIL. RP-HPLC method comprised of Inertsil® C8-3 (150 × 4.6 mm, 5 µm) column as stationary phase along with mobile phase of 1 M potassium phosphate buffer:acetonitrile (63: 37 v/v), pH 7.0 adjusted with 10% ortho phosphoric acid. A detection wavelength of 220 nm was selected as optimized. The method was found linear 20–500 µg/ml for LID and DIL with 0.9961 and 0.9984 regression coefficient, respectively. The standard spiking method showed method accuracy with mean percentage recovery of 99.10–100.65% and 98.92–100.38% for LID and DIL, respectively. In conclusion, the method was found to be linear, precise, accurate, robust, rugged, selective, and specific for quantification of LID and DIL in bulk and gel dosage form and successfully can be applied for qualitative and quantitative determination of both drugs in bulk and marketed tablet formulation.
1. Introduction[Citation1–3]
Chemically Lidocaine hydrochloride (LID) is 2-(diethylamino)-N-(2,6-dimethylphenyl) acetamide; hydrochloride, empirical formula of C14H23ClN2O and molecular weight of 270.80 g/mol (). It is a local anesthetic and cardiac depressant used as an antiarrhythmic agent.
Figure 1. Chemical structure of Lidocaine HCl.
Chemically Diltiazem hydrochloride (DIL) is [(2S,3S)-5-[2-(dimethylamino) ethyl]-2-(4-methoxyphenyl)-4-oxo-2,3-dihydro-1,5-benzothiazepin-3-yl] acetate; hydrochloride, empirical formula of C22H27ClN2O4S and molecular weight of 451.0 g/mol (). It is a calcium-channel blocker and vasodilator.
Figure 2. Chemical structure of Diltiazem HCl.
LID provides symptomatic relief by numbing the affected area, and DIL works by relaxing the smooth muscles in the blood vessels. The combination of LID and DIL in this rectal ointment formulation offers both therapeutic and symptomatic relief, particularly beneficial for patients who are experiencing both pain and difficulty in healing.
Through a thorough study of the literature, it was discovered that many analytical techniques for LID and DIL have been published for individual estimation and in combination with other drugs.[Citation4–21] Till date, only one UV spectroscopic method[Citation22] has been published for simultaneous estimation of LID and DIL. Also, both drugs have nearly same log P and pKa values which challenged to developed method which will give two well-resolved peaks. Therefore, researchers thought of research was to develop sophisticated chromatographic method to determine both simultaneously. The developed method has wide concentration range for linear response with good regression coefficient. The present study shows, high-performance liquid chromatographic (HPLC) method that has been developed and validated for simultaneous estimation of LID and DIL in bulk and dosage form.
2. Materials and method
2.1. Materials
Standards of LID and DIL was provided as a gratis sample by reputed pharmaceutical companies of Gujarat, India. Marketed formulation, CremaGel-L (2% w/w LID and 2% w/w DIL) was procured from local pharmacy store. Acetonitrile [(Gradient grade) – Qualingens – Thermo Fisher Scientific Pvt Ltd and Rankem – Avantor performance materials Ltd, Mumbai, India], triethylamine [(For HPLC) – Spectrochem Pvt Ltd, Mumbai, India, potassium dihydrogen phosphate – Merck Life Science Pvt, Mumbai, India], Orthophopsphoric acid [(For HPLC) – Spectrochem Pvt Ltd, Mumbai, India, and Milli-Q Water – Merck Life Science Pvt, Mumbai, India] were purchased.
2.2. HPLC instrument
The HPLC instrument consists of Waters® Alliance 2695 System with Software – Empower 3, and photodiode array detector was used to conduct the research.
2.3. Standard stock solution preparation
Standard stock solutions were prepared by weighing 50 mg of LID and DIL and transferred to a 25-ml volumetric flask containing few milliliters of diluent, vortexed, and sonicated. The volume was made up to mark with diluent to obtain the concentration of standard stock solution having 2000 µg/ml of LID and DIL individually. For diluent, mobile phase was used. From standard stock solution of LID and DIL, appropriate dilutions were made to obtain mixture of working standard of 20–500 µg/ml of LID and DIL.
2.4. Optimized mobile phase and development of chromatograph
The Inertsil® C8-3(150 × 4.6 mm, 5 µm) column as stationary phase was equilibrated with mobile phase comprised of 1 M potassium phosphate buffer:acetonitrile (63:37; pH 7 adjusted with 10% ortho phosphoric acid). The flow rate was maintained at 1.2 ml/min, eluent was monitored with photodiode detector at 220 nm. The injection volume applied was 10 µl with total run time of 40 minutes.
2.5. Validation of developed HPLC method
Developed reversed-phase HPLCmethod was validated for parameters specified in the International Council for Harmonization of Technical Requirements for Pharmaceuticals for Human Use (ICH) guidelines Q2 (R1).[Citation23]
2.5.1. Linearity and range
Appropriate aliquots of LID and DIL working solutions were taken in different 20-ml volumetric flaks and diluted up to the mark with diluent to obtain final concentrations of 20, 100, 150, 200, 250, 300 and 500 µg/ml of LID and DIL in a mixture. The solutions were injected and chromatograms were recorded. Calibration curves were constructed by plotting average peak areas versus concentrations, and regression equation were computed for both the drugs.
2.5.2. Precision
Intermediate precision was estimated in terms of intraday and interday precisions. Intraday precision was determined by analyzing sample solutions of LID and DIL at three different levels (20, 200, and 500 µg/ml) which covers low, medium, and high concentrations of the calibration curve and determined for three times on the same day (n = 3). Interday precision was determined by analyzing sample solutions of LID and DIL at three levels covering low, medium, and high concentrations over the 3 different successive days (n = 3). The peak areas obtained were used to calculate mean and % relative standard deviation (%RSD) values. Repeatability has been carried out by injection repeatability which was carried out by analyzing the samples of LID and DIL with the concentration of 200 µg/ml LID and DIL respectively by injecting six times and peak area of each drug concentration was measured.
2.5.3. Limit of detection and limit of quantification
Sensitivity of the method was determined with respect to limit of detection (LOD) and limit of quantification (LOQ). These two parameters were determined from linearity study by a linear regression model calculated from the slope and the intercept SD of calibration curves. Noise was determined by scanning a blank. LOD was calculated as 3 times the noise level, and LOQ was calculated 10 times the noise level.
2.5.4. Accuracy
The accuracy of the method was determined by calculating% recoveries of LID and DIL by the method of standard additions in pre-analyzed gel formulation. The sample was spiked with standard drugs at 80%, 100%, and 120% of the target concentration (160, 200, and 240 µg/ml for LID and DIL). The solutions were injected and analyzed. The amounts of LID and DIL were estimated by measuring peak areas and by fitting these values to the straight-line equations of the calibration curves.
2.5.5. Robustness
The robustness of the method was confirmed by making small but deliberate changes in the flow rate, wavelength, column temperature, buffer solution pH, and solvent variations. The effect of these changes was recorded and results were examined. The robustness of the method was determined in triplicate at concentration levels of 200 µg/ml for LID and DIL. The mean and %RSD values of the retention time (RT) were calculated.
2.5.6. Specificity
Specificity is the ability to assess unequivocally the analyte in the presence of components, which may be expected to be present which typically include impurities, degradants, matrix, etc. The specificity of method was ascertained by performing analysis of gel formulation and forced degradation study. The purpose of forced degradation study is to identify intrinsic stability of the drug. LID and DIL were subjected to various stress conditions to conduct forced degradation studies.
2.5.7. Solution stability
Solution stability was determined by storing stock solution of LID and DIL 200 µg/ml at room temperature for 60 h and analyzed at interval 0, 6, 12, 24, 30, 36, 42, 48, 54, and 60 h.
2.6. Analysis of marketed gel formulation
After precisely weighing the gel, quantity equivalent to 10 mg of LID and DIL was transferred to a 10-ml volumetric flask. The aforesaid volumetric flask was filled with a few milliters of acetonitrile, vortexed for 10 min, sonicated for 10 min, and the mixture was filtered through Whatman filter paper No. 45 to a second volumetric flask of 10 ml capacity. Acetonitrile was used to get the volume up to the required level, yielding 1000 µg/ml LID and DIL. A further dilution was made to produce 200 µg/ml LID and DIL. The regression equation used to carry out the quantification process.
3. Results
3.1. Optimization of mobile phase
Selection of the mobile phase was carried out on the basis of polarity. A mobile phase that would give a dense and compact band with an appropriate RT for LID and DIL with good resolution was desired. Various solvents alone and in combination was tried in different proportions. Mobile phase consists of 1 M potassium phosphate buffer:acetonitrile (63:37 v/v) pH 7.0 adjusted with the use of 10% OPA gave sharp and well-resolved peak of LID and DIL; hence, it is selected as mobile phase. The RT of LID and DIL was found to be 12.8 and 19.2 min respectively when the flow rate was maintained at 1.2 ml/min.
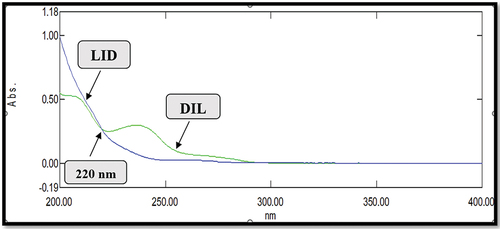
In the present study, LID and DIL solution of 10 µg/ml was prepared in acetonitrile. The drug solutions were then scanned in the UV region of 200–400 nm which shown appreciable absorption at 220 nm for both the drugs. Selection of wavelength from UV spectra is shown in .
Figure 3. UV overlay spectra of LID (10 µg/ml) and DIL (10 µg/ml).
3.2. Method validation
The calibration curves for LID and DIL were found to be a linear in the range of 20–500 µg/ml () with a correlation coefficient of 0.9961 and 0.9984, respectively. The regression analysis of calibration curves is reported in . Method precision was determined by performing injection repeatability test and %RSD values for LID and DIL were found to be 0.25% and 0.25%, respectively. The intraday and interday precision studies were carried out, and the results are reported in . The low RSD values indicate that the method is precise. The accuracy of the method was determined by calculating % recoveries of LID and DIL by standard spiking method. The % recoveries were found to be 99.10–100.65% and 98.92–100.38% for LID and DIL, respectively (). The data indicate that the method is accurate.
Figure 4. Overlay chromatogram of calibration range (20–500 µg/ml) of LID and DIL.
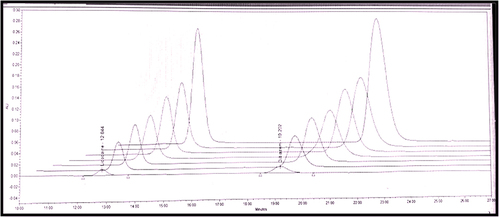
Table 1. Regression analysis of calibration curve.
Table 2. Summary of validation parameters.
The quantitation limits of LID and DIL were found to be 5.30 and 3.06 µg/ml respectively, while detection limits were found to be 1.74 and 1.01 µg/ml, respectively (). Robustness study was performed by deliberately changing the experiment conditions like flow rate from 1.2 to 1.0 ml/min and 1.4 ml/min. The column temperature was changed form 30°C to 25°C and 35°C. The pH of buffer solution was change from pH 7 to 6.8 and 7.2. The composition of mobile phase was change varying the proportion of buffer and acetonitrile from 63:37 v/v to 65:35 v/v and 61:39 v/v. Detection wavelength was changed from 220 to 218 nm and 222 nm. Under all conditions, the %RSD value was found to be <2%. All parameters deliberate changes result in terms of robustness is in . Solution stability data for both drugs is shown in .
Table 3. Robustness data.
Table 4. Solution stability data.
3.3. Analysis of marketed formulation
The marketed gel dosage formulation was analyzed by the proposed method. The % content for LID and DIL were found to be 98.89 ± 0.46% w/w and 99.27 ± 0.08% w/w, respectively. The assay result is shown in .
Table 5. Marketed formulation analysis.
4. Discussion
A developed and validated HPLC method can be apply for qualitative and quantitative estimation of LOD and DIL in bulk and pharmaceutical gel dosage form. The proposed method is selective and specific to determine LID and DIL in the presence of excipients. It complies for accuracy, precision, and robustness according to the ICH guidelines. The method can be effectively useful for routine analysis of both LID and DIL simultaneously in bulk and gel dosage form.
Acknowledgments
All authors are very thankful to SICART, Vallabh Vidyanagar and Indukaka Ipcowala College of Pharmacy, New Vallabh Vidyanagar, for providing necessary facilities to carry out research work.
Disclosure statement
No potential conflict of interest was reported by the author(s).
References
- Drug Profile Lidocaine Hydrochloride. https://pubchem.ncbi.nlm.nih.gov/compound/Lidocaine-Hydrochloride accessed January 2024.
- Drug Profile Diltiazem Hydrochloride. https://pubchem.ncbi.nlm.nih.gov/compound/Diltiazem-Hydrochloride accessed January 2024.
- Drug Information. https://www.ncbi.nlm.nih.gov/pmc/articles/PMC4755763/ accessed January 2024.
- Ingle, S.; Birajdar, A.; Matole, V.; Adlinge, S.; Nangare, G. UV Spectrophotometric Method Development and Validation of Lignocaine Hydrochloride in Bulk and Semisolid Dosage Form. Res. J. Pharm. Technol. 2021, 14, 5280–5282. DOI: 10.52711/0974-360X.2021.00920.
- Omer, L. S.; Ali, R. J. Extraction Spectrophotometric Determination of Lidocaine Hydrochloride in Pharmaceuticals. Int. J. Chem. 2017, 9(4), 5539. DOI: 10.5539/ijc.v9n4p49.
- Bhusal, P.; Sharma, M.; Harrison, J.; Procter, G.; Andrews, G.; Jones, D.; Hill, A.; Svirskis, D. Development, Validation and Application of a Stability Indicating HPLC Method to Quantify Lidocaine from polyethylene-co-vinyl Acetate (EVA) Matrices and Biological Fluids. J. Chromatogr. Sci. 2017, 55(8), 832–838. DOI: 10.1093/chromsci/bmx043.
- Hamdah, M. N.; Matthew, P.; James, S. G.; Dion, R. B. A High-Performance Liquid Chromatography Assay Method for the Determination of Lidocaine in Human Serum. Pharm. MDPI. 2017, 9, 52.
- Salih, M. A.; Aziz, D. F.; Ali, S. I. Development and Validation of New High Performance Liquid Chromatography Analytical Technique for Separation of Diclofenac Sodium and Lidocaine Hydrochloride from Ampoule Injection. Kurdistan J. Appl. Res. 2020, 5(1), 115–127. DOI: 10.24017/science.2020.1.11.
- Shaalan, R. A.; Belal, T. S. HPLC–DAD Stability Indicating Determination of Nitrofurazone and Lidocaine Hydrochloride in Their Combined Topical Dosage Form. J. Chromatogr. Sci. 2010, 48(8), 647–653. DOI: 10.1093/chromsci/48.8.647.
- Belal, T. S.; Shaalan, R. A.; Haggag, R. S. Gradient HPLC-diode Array Detector stability-indicating Determination of Lidocaine Hydrochloride and Cetyl Pyridinium Chloride in Two Combined Oral Gel Dosage Forms. J. AOAC Intern. 2011, 94(2), 503–512. DOI: 10.1093/jaoac/94.2.503.
- Doganay, A.; Koksel, B.; Gundogdu, S.; Capan, Y. Simultaneous Determination of Dexpanthenol, Lidocaine Hydrochloride, Mepyramine Maleate and Their Related Substances by ARP-HPLC Method in Topical Dosage Forms. J. Chromatogr. Sci. 2018, 56(10), 903–911. DOI: 10.1093/chromsci/bmy067.
- Al-Salman, H. N.; Al-Jadaan, S. A.; Alnuaim, M.; Hussein, H. Estimation of lidocaine-HCl in Pharmaceutical Drugs by HPLC-UV System. Am. J. Pharm. Tech. Res. 2017, 7, 1–11.
- Mohamed, D.; Kamal, M. Enhanced HPLC-MS/MS Method for the Quantitative Determination of the co-administered Drugs Ceftriaxone Sodium and Lidocaine Hydrochloride in Human Plasma following an Intramuscular Injection and Application to a Pharmacokinetic Study. Biomed. Chromatogr. 2018, 32(10), 3422. DOI: 10.1002/bmc.4322.
- Suresha, D. N.; Rashmi, T.; SenthilKumar, G. P. A Novel Method Development and Validation of Diltiazem Hydrochloride in Pure and Pharmaceutical Dosage Forms by Using Uv- Spectrophotometric Method. Am. J. Pharm. Tech. Res. 2019, 9, 226–232.
- Nafisur, R.; Syed, N. Spectrophotometric Determination of Diltiazem Hydrochloride with Sodium Metavanadate. Microchem. J. 2000, 65, 9–43.
- Arafat, M. Simple HPLC Validated Method for the Determination of Diltiazem Hydrochloride in Human Plasma. Int. J. Pharm. Pharmac. Sci. 2014, 6, 213–216.
- Patil, B. R.; Bhusnure, O. G.; Paul, B. N.; Ghodke, A. Y.; Mulaje, S. S. Analytical Method Development and Validation for the Estimation of Diltiazem Hydrochloride in Bulk and Pharmaceutical Dosage Form by RP-HPLC. Int. J. Drug Regul. Aff. 2014, 2(2), 78–84. DOI: 10.22270/ijdra.v2i2.133.
- Pawar, R. K.; Lokhande, R.; Yadav, R.; Bind, B.; Velankar, S. Development and Validation of Assay Method by RP-HPLC for Determination and Quantitation of Diltiazem Hydrochloride. Active Pharm. Ingredient. 2017, 4, 1–8.
- Kulkarni, A. S.; Jadhav, S. D.; Khetmar, S. S.; Bhatia, M. S. Development of Chromatographic Technique for Simultaneous Estimation of Lovastatin and Diltiazem Hydrochloride. Mahidol Univ. J. Pharm. Sci. 2012, 39, 17–23.
- Mahajan, N.; Deshmukh, S.; Farooqui, M. A Novel stability-indicating Method for Known and Unknown Impurities Profiling for Diltiazem Hydrochloride Pharmaceutical Dosage Form (Tablets). Future J. Pharm. Sci. 2017, 7, 1–13.
- Devarajan, P. V.; Dhavse, V. V. High-performance thin-layer Chromatographic Determination of Diltiazem Hydrochloride as Bulk Drug and in Pharmaceutical Preparations. J. Chromatogr. Biomed. Sci. Appl. 1998, 706(2), 362–366. DOI: 10.1016/S0378-4347(97)00548-3.
- Chaudhari, N.; Saskshee, S.; Patel, S.; Chandwani, J.; Kachhiya, H. A Validated UV Spectroscopic Method for Quantification of Lidocaine HCl and Diltiazem HCl. J. Adv. Res. Rev. Med. Med. 2024, 1, 12–21.
- ICH Guidelines Q2 (R2). Validation of Analytical Procedure: Text and Methodology; Geneva, Switzerland, March 2022.