
Abstract
Objective data on pedestrian travel has long been lacking, especially pertaining to quantitative information about flows and route choices. Recent ICT development has opened opportunities to collect position-determined data automatically/passively but has rarely been used to study walking behavior. This study analyses the use of two such data sources for pedestrian study. Data was collected in the autumn of 2019 in Umeå, Sweden, where residents (N = 88) in the study area were asked to use the travel survey app (TravelVu) for 5 days. A total of 3,856 trips were recorded of which 51% were walking. A measurement of travel patterns was also carried out with Wi-Fi (Bumbee) for 8 days at 14 points, which recorded 279,791 entries. The results show that what Bumbee loses in precision it makes up for in the number of registrations, while TravelVu provides a detailed picture of an individual’s travels. This pilot study addresses how well the combination of these data types describes pedestrian traffic in an area in terms of flow, route choice, and distribution in time and space. Furthermore, the study provides knowledge on how new data sources can be used to provide municipalities with a picture of their pedestrian traffic.
1. Introduction
1.1. Background
The transport planning literature has largely focused on motorized travel modes, whether it concerns the built environment or psychological determinants of travel behavior, or the use of new and “emerging” data. However, the learnings from motorized modes of travel cannot simply be transferred to non-motorized modes due to their distinctly different characteristics. According to Lee and Sener (Citation2020) walking trips are more “sensitive to the environment (e.g. weather conditions, topography, land use patterns), more variant (i.e. do not always follow dedicated roadways or often make their own paths), and shorter than motorized trips”.
Similarly, there is a difference between different non-motorized travel modes such as walking and cycling. Cycling is usually faster, for longer distances, requires equipment (i.e. a bicycle that needs investment and storage when not in use) and some amount of skill (i.e. ability to ride and handle a bike), and has different environmental requirements than walking (Krizek et al., Citation2009). Walking is the most basic mode of travel that can (mostly) be undertaken by all socio-economic and age groups without any special requirement for skill or equipment. However, it is often over shorter distances and requires more time (due to the slow speed). Therefore, there has been an increasing focus on understanding walking separately, without clubbing it with cycling and other active modes of transport or physical activity.
Walking studies are being undertaken for a variety of reasons: to evaluate the effect of walking on physical and mental health (Chen et al., Citation2021; Hsu et al., Citation2021; Piva et al., Citation2022; Morris & Hardman, Citation1997; Yen et al., Citation2022) and environment (Keall et al., Citation2018; Neves & Brand, Citation2019); to identify correlations between the built environment and walking (Ewing & Cervero, Citation2010); to identify the psychological (or behavioral) factors that affect walking (Dill et al., Citation2014). In recent years, there has also been growing interest in the interactions between psychosocial and built environment factors in explaining walking (and physical activity) (Carlson et al., Citation2012; Rhodes et al., Citation2006). The wide range of research interests also requires different types of data to be collected using a variety of methods. However, walking data have so far been mostly subjective, relying on people’s ability to remember and estimate the time and distance travelled. With advances in technology, the traditional methods of data collection are being supplemented or replaced by new methods, that K. Lee and Sener (Citation2020) term as emerging data. However, their use has been limited to motorized modes of transport or cycling at the most. This paper tests the use of two new sources of data in a pilot study conducted in Umeå, Sweden to test their usefulness to pedestrian studies.
1.1.1 Overview of pedestrian studies
According to urban design and planning literature, travel behavior, including walking, correlates to built environment characteristics. A meta-analysis conducted by Ewing and Cervero (Citation2010) found more than 200 individual studies of the built environment and travel, of which they identified 30 studies that relate walking to some aspect of design. They report walking to be most strongly related to measures of land use diversity, intersection density, and the number of destinations within walking distance Another review conducted by Saelens and Handy (Citation2008) reviewed 13 reviews published between 2002 and 2006 and 29 original studies published in 2005 and up through May 2006. Results indicate a consistent correlation between walking for transportation and the built environment (density, distance to non-residential destinations, land use mix, route/network connectivity, parks and open space, and personal safety). Another systematic review and meta-analysis conducted by Barnett et al. (Citation2017) found strong evidence for positive associations between older adults’ total walking and built environment (neighborhood walkability, access to/availability of shops/ commercial destinations, overall destinations and services, and more greenery and aesthetically pleasing scenery, access to/availability of neighborhood public transport and parks/public open space, crime/personal safety, residential density, walk-friendly infrastructure, and street lighting.
Traditional measurements of walking were previously limited to manual counting and travel surveys (questionnaires, travel diaries, and interviews). Ewing et al. (Citation2016) established a correlation between streetscape features and pedestrian activity using pedestrian counts, i.e. the average number of people encountered (by field observers) on four passes up and down a given block face. Manual counting has advanced to automated counting using video cameras and various sensors such as infrared sensors, while travel surveys are being conducted via web-based questionnaires. K. Lee and Sener (Citation2020) note that “while the main reason for counting is to gather traffic volume data, in some cases, counting is capable of collecting additional information about non-motorized travel modes beyond simply numbers, such as direct observation of travel behaviors (e.g. helmet wearing, crossing on red, travel speed) and traveler attributes (e.g. gender, generalized age ranges)”. It has however not been possible to establish a travel pattern between the measurement points or route choices. For example, do more people prefer to go from A to D via B or C?
Several survey formats are used to measure walking subjectively. For example, Cervero and Duncan (Citation2003) used the 2000 Bay Area Travel Survey (BATS). It was a 2-day travel diary using a standard household travel survey (HTS) approach capturing key individual, household, and travel behavior information including trip locations, mode of transportation, trip start and end times, trip purpose, and trip activities (MORPACE International, Citation2013). C. Lee and Moudon (Citation2006) asked 438 respondents in Seattle about the last week of walking “(a) to work, (b) to school, (c) to grocery stores, (d) to other retail or service facilities, and (e) for recreation or exercise”. Rhodes et al., (Citation2006) used an adapted Godin Leisure Time Exercise Questionnaire (GLTEQ) consisting of three open-ended questions about frequency and average duration of physical activities that were adapted to include mild, moderate, and strenuous walking bouts completed during free time for at least 20 min duration in a typical week, that was mailed to the participants. Dill et al. (Citation2014) on the other hand, conducted a random telephone survey in three residential neighborhoods in Portland. The dependent variables (walking or bicycling behavior) were based on responses to questions about how often in the past month the respondent had walked or bicycled from their home.
Travel surveys (including travel diaries) measure walking subjectively and rely on people’s memory and ability to estimate distance and time when reporting their travel behavior. As a result, there can be shortcomings in the information collected, including forgotten trips, especially short trips on foot, and the participants’ inaccuracy in estimating time and distance travelled. They traditionally did not provide any information about the route taken and why, though recent studies sometimes include maps to identify routes for specific activities. To deal with these shortcomings, studies, especially in health sciences, have been using accelerometers/pedometers that provide a more accurate account of the actual distance travelled and the time taken (Carlson et al., Citation2012). But pedometers are expensive and cannot be provided to a large number of people. Surveys focusing on a fixed number of frequent waking trips, also do not provide a complete picture of the individuals walking behavior.
Krizek et al. (Citation2009) observe that to influence future policy decisions, there is a need to evaluate the effectiveness of interventions designed to increase walking and cycling through infrastructure improvements and other changes to the built environment. In order to do so, health behavior researchers (including physical activity researchers) and travel behavior researchers rely on two different theoretical frameworks that are “beginning to converge on a common framework that considers the interplay between individual, interpersonal, and environmental factors” (p. 727). Dill et al. (Citation2014) observe that built environment and demographics influence walking and cycling behavior by influencing people’s perceived behavioral control (PBC) and attitudes. Results from Tortosa et al. (Citation2021) study of cycling participation in England indicate that the likelihood of cycling is lower among people living in deprived areas than among people living in non-deprived areas despite better cycling infrastructure and greater levels of cyclability in deprived areas than in non-deprived areas. Thus, there is a need to be able to objectively measure the actual travel behavior along with these other factors. Counting pedestrians does not give a background of the pedestrians, whereas travel surveys traditionally collect some background information (mostly demographic data at the individual level) or they sometimes collect some trip-level information, but only for specific trips).
Wi-Fi and GPS-enabled mobile devices (e.g. smartphones) have become very popular in recent years and people from almost all age groups (except very young children) and socio-economic groups now have access to them. K. Lee and Sener (Citation2020) termed these new technology-based data available through mobile devices as emerging data. They review the various types of emerging data available, their advantages and disadvantages, and their application to cycling and walking studies. They observe that emerging data is being more widely used in the research of motorized travel modes than non-motorized travel modes. Also compared to bicycle data, transportation researchers and practitioners have notably less used emerging pedestrian data.
Krizek et al. (Citation2009) have categorized the methods for measuring walking and cycling behavior into three main categories: self-reported (such as survey or travel diary), observation of people’s activity (manually or using sensing equipment) and employing instrumentation on bodies or bicycles while focusing on the challenges associated with conducting walking and cycling behavior studies from a transportation point of view. Bauer et al. (Citation2009), on the other hand, use only two categories: pedestrian counting (with five sub-categories) and pedestrian tracking (with five sub-categories, including employing instrumentation that they categorize as intrusive localization methods) while focusing on the management of large public infrastructure such as airports, shopping malls, etc. They list all the possible means of measuring pedestrians for enclosed or semi-enclosed spaces. Therefore, they include methods that are not commonly used to measure pedestrian activity such as RFID tags (used more for packages), while ignoring travel surveys (that are very popular at the urban or national scale travel research). However, none of these studies include the newly emerged methods used in our study (as they had not yet been introduced) and therefore, there is a need to analyze their effectiveness and limitations, in addition to their advantages. lists the commonly used methods for collecting pedestrian activity data for urban studies.
Table 1. Key limitations of the “conventional” methods for collecting pedestrian data at the urban scale.
K. Lee and Sener (Citation2020) have categorized emerging data as mode-unspecified and mode-specified. In our study, Bumbee provides mode-unspecified data and TravelVu provides mode-specified data. Neither of these data sources has been included in their review (which focuses mostly on data available in the USA). According to the classification of emerging data types by K. Lee and Sener (Citation2020), while Bumbee data can be categorized under Wi-Fi/Bluetooth data, there is no category that TravelVu data would fit under; TravelVu does not fit under any of the 4 sub-categories of mode-specified data. Bumbee Labs was established in 2011 in Stockholm, Sweden, as a means to provide “analytics and predictions on footfall traffic and consumer behavior in outdoor and indoor spaces”(https://bumbeelabs.com/) Whereas TravelVu is a smartphone app developed by Trivector in 2016 that collects travel survey data by combining technology with human input (https://www.travelvu.app/). Both these new sources of data are being slowly used for research purposes within Sweden, and Europe, and therefore of specific interest to evaluate in this study. New sources of data can potentially address many of the limitations of conventional data collection methods. However, they have their limitations, identifying which is important to decide when and where they can and should be used. This paper explores, based on our experience with the Umeå case study, how accurate or useful they really are.
1.2. Aims and objectives
This paper is part of the project developed by the Luleå University of Technology and financed by the Swedish Transport Administration (Trafikverket) that aims to evaluate the impact of the built environment on pedestrian behavior. The paper provides a brief background of the research project and then presents the two methods that were used to measure pedestrian behavior. The data collected from the two sources for our first case study in Umeå are described and compared. This paper aims to identify their usefulness in describing travel behavior and flows of pedestrians as input to the planning of pedestrian infrastructure.
2. Method and data
The Methodology adopted for the research project is to conduct several physical planning interventions in several Swedish cities and study the change in walking behavior before and after these interventions, to determine the impact of the built environment (/the interventions) on walking behavior.
To develop a systematic and holistic understanding of the changes in pedestrian behavior in the before and after periods, we decided to collect two types of data.
Pedestrian flow or site-specific data, i.e. number and direction of pedestrians at a point or along a street. We used the Wi-fi based method provided by Bumbee Labs.
Travel behavior or person-specific data, i.e. route choice, distance, frequency, attitudes, etc. We went for the Mobile app-based method, i.e. the TravelVu app developed by Trivector, Sweden.
The data collected using both methods were anonymous to the research team and in accordance with the European General Data Protection Regulation (GDPR).
2.1. Umeå case study
Umeå is a city in northeast Sweden. It is also considered to have a good infrastructure for both public transport and walking and cycling (262 kilometers of walking and cycling routes and 160 kilometers of exercise tracks). The municipalitýs transport planning organization is also working towards further improving the walking and cycling infrastructure as part of their work with sustainable transport planning (Umeå Municipality (Gator och parker), Citation2019).
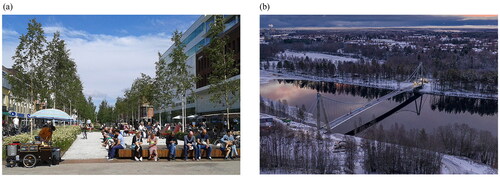
Two intervention sites in Umeå city were identified by the researchers in consultation with the Planning Department of Umeå municipality for the main study. Both interventions were under construction at the time of these consultations and the data collection. While Rådhusesplanaden (the central pedestrian street in Umeå city center) is a street beautification project conducted in four stages, Lundabron’s (a 179 m long bridge over the Ume River) aim is to improve connectivity for pedestrians and cyclists (refer to and ). This paper uses the data collected as part of the before-study (refer to study design). While postal invitations to participate in the study were sent to residents within a 1 km radius of these study areas (), all residents of Umeå City were welcome to participate in the study.
Figure 1. Map of Umeå focusing on the study area. Source (for base map): https://www.openstreetmap.org/#map=14/63.8251/20.2651
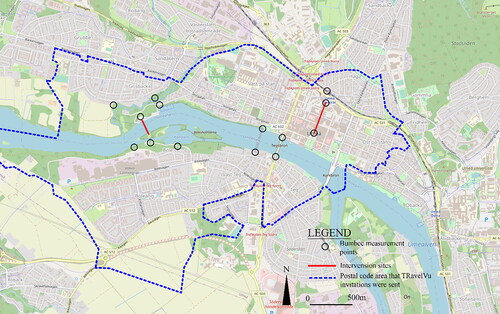
Figure 2. (a) Rådhusesplanaden and (b) Lundabron. Sources: Umeå Municipality, Citation2016, Citation2023.
2.2. Wi-Fi based data
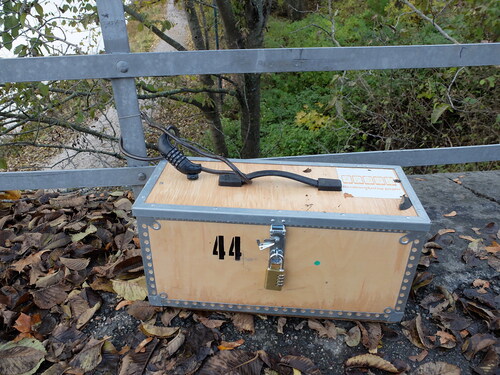
Bumbee measures and visualizes visitor flows (number and path) by capturing anonymized Wi-Fi signals in smartphones. Each station measures the passages of a mobile device within a radius of about 25 meters. If a mobile device passes two or more measuring ranges within 60 min a path for the device is created. The main advantage of Bumbee measuring devices over manual or infrared counting methods is the ability to identify a person/device passing through multiple measuring points and creating a path, as opposed to just recording the numbers at a given location. That is, Bumbee can provide both count and tracking data. 14 measuring points were set up and data was collected for 8 days (15th–22nd October 2019). The number of measuring points was based on financial constraints and their location was based on intervention sites. shows a typical measuring instrument while the location of the instruments is marked in .
Figure 3. Bumbee measuring instrument. Source: Authors.
2.3. App-based travel survey
TravelVu is a smartphone-based app developed by Trivector AB © that enabled the collection of two types of data:
Objectively collected Travel (GPS) data consisted of location, activity type, distance, duration, and number of trips. While the travel data is collected passively by the app, the participants need to actively review and approve that the description of the day is correct. shows the app user interface.
Self-reported survey questions designed to measure the various constructs of TPB and consisted of five sections:
You (Personal factors/background)
Preferences (Attitude)
Others (Subjective Norms)
Opinions (Perceived Behavioral Control)
Pop-up questions related to walking (Perceived Behavioral Control)
Figure 4. TravelVu app’s smartphone interface: (a) My travel today, (b) travel route, and (c) overview. Source: Trivector (2022).
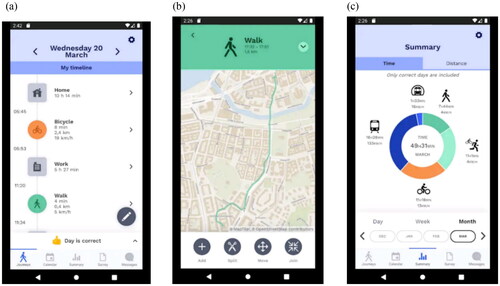
The first four sections of the survey consisted of questions that a participant needed to answer only once, anytime within the survey period (Individual level). The pop-up questions, related specifically to the travel elements under consideration, were asked to the participants every time they walked more than 500 m (trip level). The main advantage of the TravelVu data collection method over the traditional surveys is not only the objective (GPS-tracked) travel data, but also the ability to ask customized questions, in real-time (the pop-up questions asked when the participant is still in the built environment or just completed the trip with the experience fresh in the memory). The objectively collected data provides distance and time data that is accurate and truly continuous, and not in chunks/intervals (e.g. 12 min or 1.3 km instead of being rounded to 10 min or 1.5 km).
Data was collected during the period 1 November–22 December 2019. Invitations were sent by Luleå University of Technology Sweden, in consultation with Sweco Sverige AB and Umeå municipality, via a variety of different methods: unaddressed flyers, personally addressed postcards, and A3 posters put up in some key locations. Participants were invited from within approx. 100 m radius of the two intervention sites. Participants were asked to use the app for any five (or more) consecutive days, preferably including a weekend.
3. Results and discussion
3.1. Data description
3.1.1. Bumbee (Wi-Fi)
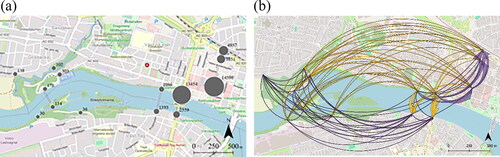
The 14 measuring points within the study area recorded a total of 279,791 entries. Bumbee also recorded the path traveled between the measuring points, including the direction of travel. The two maps in provide an overview of the data collected in Umeå. The maps clearly show that not only is there a lot of traffic movement within the city center, but also a significant movement to and from the city center (N = 279,791)
Figure 5. (a) Visit count and (b) traffic flow between the measuring points per day.
3.1.2. TravelVu
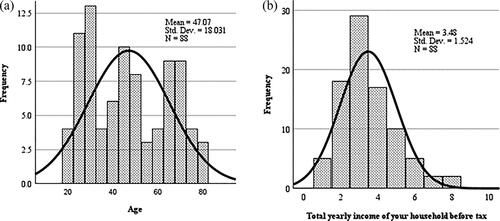
88 individuals provided over 3,500 trip data, of which 51% was walking data. The participants used the app for an average of 6.5 days. shows the age and income distribution of the TravelVu participants. One of the main concerns with using smartphone-based data is the over-representation of young and tech-savvy people. But our data was fairly representative of the Umeå population in terms of gender (50% male, 50% female), age, and income.
Figure 6. (a) Age and (b) income distribution of TravelVu participants.
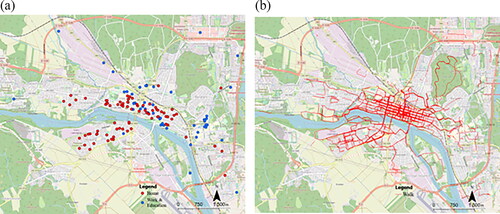
A quick comparison of the two maps in shows that considerably high levels of pedestrian activities take place in and around the home-work-study locations, which in our case is in the city center, and the adjacent areas, compared to those further away. This is in line with most studies that state that most of the walking takes place in the people’s neighborhood within a 10–15-min walking distance (Agrawal & Schimek, Citation2007; Yang & Diez-Roux, Citation2012).
Figure 7. (a) Distribution of home (red) and work/study (blue) locations (left) and (b) distribution of all walking trips.
3.2. Comparative analysis
The method to collect empirical data on walking with Travel VU was useful because it was easy to provide information and questions to the respondents in their everyday life. The method is also accessible to everybody with a smartphone, which is widely spread amongst the Swedish population, and it was understood to be easy for the respondents to add information in the smartphone app.
For better comparison and to check the reliability of our data we looked at the pedestrian flow between the different zones in the TravelVu data and the flows based on Bumbee data. The Bumbee data was cleaned to separate pedestrians from other modes, using mainly the speed of travel (i.e. 8 km per hour or less), and the 14 measuring points were clubbed into five zones (as shown in , based on the side of the river they were on and their proximity to each other) for easier comparison with the TravelVu data. shows that the proportion of pedestrian flow is comparable in both methods. The relationship between the flow data from Bumbee and that derived from TravelVu was also investigated using Pearson product-moment correlation coefficient. There was a strong, positive correlation between the data from the two sources, r = .689, n = 9, p < 0.05.
Figure 8. Bumbee measuring points, grouped into zones.
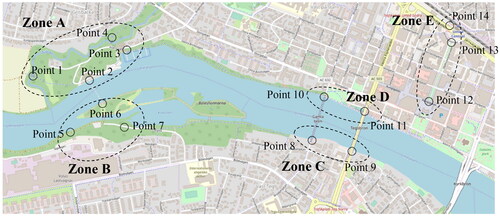
Figure 9. (a) Pedestrian flow based on Bumbee data and (b) pedestrian flow based on TravelVu data.
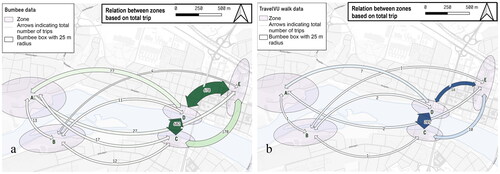
Bumbee data provides better insight into the likely volume of walking trips on a given day between the zones. But it does not provide any information about the origin and destination, the purpose, or the actual route taken for the trips. However, in a study carried out in Gothenburg, Sweden, in 2018 (Örarbäck & Wilson, Citation2019), Bumbee data provided a much better view of the routes taken by pedestrians as the study used 50 measuring points for an area of approximately 0.77 sq km in the city center (that is physically constrained by the river on one side and a green belt and water channel on other three sides, with limited entry points). Our study, on the other hand, used 14 measuring points for a study area of approximately 10.15 sq km. Thus, it is theoretically possible to get a better understanding of route choices using Bumbee by setting up measurement points at every junction, but it is practically and economically not feasible at large urban scales.
Another important difference between the two data sources is the ID registered per device and the path formed. For Bumbee data, if the time taken by a person/device to pass between two measuring points is more than 60 min, then a path between the points will not be created as the device will be registered as a new device (and provided a new id). That is, if the measuring points are separated by long distances and the people stop in between (e.g. to shop or have coffee), then the paths may not be created. TravelVu, on the other hand, provides a single ID to each device for the entire duration of the study and shows not only the specific choice of routes, origin, and destination but also provides the opportunity to ask questions about specific types of trips. shows the choice of routes taken between zones A and D, as measured using TravelVu. The figure highlights that the pedestrian route along the river is preferred, while the busy arterial road with a higher volume of vehicular traffic is avoided. Thus, TravelVu can theoretically provide information about travel between different zones if all or most residents participate in the data collection, but that is also practically not possible, at least yet. More measurement points and more participants can bring the two methods closer to each other. shows all the pedestrian trips from the TravelVu dataset in relation to the Bumbee measuring points.
Figure 10. Combined data from Bumbee and TravelVu shows the multiple route choices between any two zones.
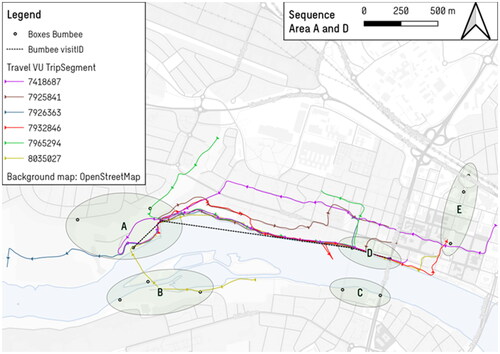
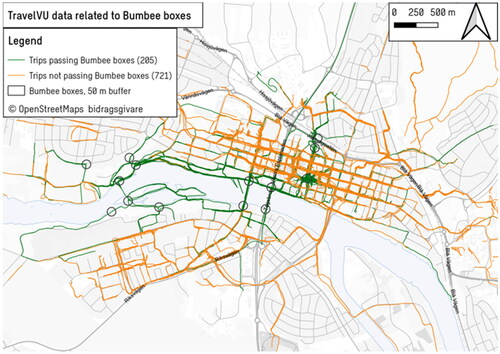
Figure 11. TravelVu data in relation to the Bumbee measurement points.
3.3. Limitations
Using Wi-Fi and GIS data can enhance the capability of monitoring human movement patterns in specific scenarios, along with collecting additional data that manual/traditional methods cannot collect. Despite the many advantages of the rich and extensive data that can be collected using these new technologies, they also have their limitations.
The main limitation of Bumbee data is that not everyone carries detectable devices and not all devices are discoverable. This can affect data quality and richness, compared to manual counting or infrared devices. Another issue is the mode unspecified nature of the data. It is difficult to separate walking from other modes of travel. Walking trips were differentiated from other modes based on speed. However, the accuracy of the cleaned data is not certain, especially when differentiating between walking and cycling. For example, a person cycling past one measuring point could have stopped somewhere along the route and then passed another measuring point, such that it appears to be slow-moving. Also, a car could have driven past one measuring point and then traveled along a long route before passing a second measuring point. The data is expected to be more accurate when the measuring points are closer to each other (as in the case of the Gothenburg study) or in pedestrian-only areas.
The main limitation of TravelVu (or mobile-based app) survey data is that the response rate (around 4–6%) is much lower than traditional surveys (around 30%). The response rate for our survey was 1.95% (considering the 88 participants for 4,500 flyer invitations sent) despite two rounds of invitations. This is probably due to smartphone app-related problems, such as battery drainage and non-tech-savvy users or privacy concerns. Though the TravelVu app is GDPR approved, and the data collected was anonymous, people might still have privacy concerns due to the GPS tracking of their movement. The privacy concern is greater in villa areas with low population density, compared to large apartment blocks with higher densities, as the possibility to identify the actual person or household is higher in the former than in the latter. Also, the dropout rate is high. The participants were asked to use the app and record their travel for a minimum of 5 days (including a weekend, if possible), but 14.8% of participants stopped using the app after 1 or 2 days. Only 67% of the participants recorded their travel for 5 or more days, with 28 days being the maximum.
The low response rate is an important limitation as it increases the cost (measured per participant) of the survey and the quality and representativeness of the data. The non-participants could have a different travel behavior pattern than the participants of the survey. Indeed, our results are biased towards people who prefer walking over other modes of transport (75.3%), and our study’s mean percentage of walking trips is high (48%). This is possibly because the research was presented as a walking study when inviting participants, as opposed to other travel surveys that are neutral. It is also possible that people with a positive attitude towards walking and who walk regularly are the ones who participated in the study due to their interest in the subject.
Another major limitation (particularly in our study) of using either of the two methods, Wi-Fi and app-based, is the associated cost. The approximate cost of data received from Bumbee Labs was approximately 885 SEK (i.e. 75 Euro) per measuring point per day. Thus, in the planning stage, the choice had to be made between a greater number of days (and fewer points) or a greater number of measuring points (and fewer days). Infrared People Counters can, on the other hand, be bought for between 90 and 500 Euros, depending on the quality of the product. The approximate cost of data received from Trivector AB (for TravelVu data) was approximately 1,230 SEK (i.e. 105 Euro) per person. This included the cost of setting up the customized questionnaire and the app being available for people to use for a period of 52 days. As mentioned previously, the response rate in our study was extremely low and therefore resulted in high per-person costs. A higher response rate can bring down the per-person cost considerably. In comparison, ordering existing Citizen Survey data from The Statistics Authority of Sweden (Statistikmyndigheten SCB) costs from 105 SEK (i.e. 9 Euro) per person (Statistikmyndigheten SCB, n.d.-a), ordering a survey to be carried out by SCB0FFootnote1 costs from 370SEK (i.e. 32 Euro) per person (Statistikmyndigheten SCB, n.d.-b) and National Travel Habits Survey in 2005 cost just over SEK 350 (i.e. 30 Euro, excluding planning and analysis work) (Vägverket, Citation2005). Pedometers, an alternative for collecting objective travel data, on the other hand, need to be supplied to each participant for the duration of the study (the cost of which depends on the quality of the device), as opposed to the participants using their own mobile devices for downloading and using TravelVu app.
4. Conclusion
Finally, we will conclude by going back to our research question: How useful are new data sources in pedestrian planning? In short, they are treasure troves of information with a lot of potential.
The new and smart sources of data have some clear advantages over traditional sources. They can provide not only accurate but much more detailed data than that collected from more traditional sources. If these methods are to replace or complement manual counts and traditional travel surveys, they could greatly enhance the understanding of pedestrian behavior. We have also shown how Wi-Fi and app data have their shortcomings and could benefit from each other in the pursuit of studying and measuring walking behavior and patterns. Combining the data from the two sources would provide a holistic understanding of pedestrian behavior. For example, for data collected over several years, any change in the number of pedestrians that is noted from Wi-Fi-based Bumbee data can be explained by GPS-based TravelVu data. However, collecting truly longitudinal data (where the same people are surveyed over multiple years and any changes in their travel behavior are identified) is not possible using TravelVu because the data collected is anonymous due to privacy reasons. Data can be collected from the same geographical units and changes in travel behavior at that level can be identified. As part of our research project, we have collected TravelVu data for the same study area for 2019 and 2021.
However, based on the aims and objectives of the study, the two methods can be used individually. When generally comparing the two methods we see that they show similarities in pedestrian flows: both in directions and distribution in the pedestrian network. When compared to Bumbee, what TravelVu loses in terms of numbers, it makes up in terms of detailed path and activity data, in addition to the possibility to ask project-specific questions and vice-versa. This is promising for further studies.
Thus, systematic data collected through bigger studies over multiple years would provide a comprehensive understanding of pedestrian behavior and help plan better urban environments that encourage pedestrian activity. Pedestrian route choice data can help planners identify the most used and avoided routes, which can in turn help inform the type of interventions needed to promote more activity along lesser-used streets or provide better amenities to the more popular streets. The potential applications of the two kinds of data sources are plentiful. Wi-fi measurements with multiple tracking stations covering a larger area would reveal which route choices or trajectories that are commonly used and how these might correspond to urban design qualities and amenities along different streets and paths. Flow metrics – from Wi-fi stations and /or mobile phones – could support decision-making regarding infrastructure and design interventions. Walking flow data can then be used to estimate migration effects, before-and-after travel behavior, and travel time loss estimations. Flow data for walking can also be compared against motor and cycle traffic flow in order to assess priority of transport modes at places, on roads and in larger street networks.
Potential applications of mobile phone travel surveys for research are exposure metrics (km travelled on foot) to be used as input in traffic safety and public health assessments. Further, TravelVu data or the like can potentially illustrate how activity spaces and travel patterns differ between socio-economic groups and genders, which increases the understanding of whom can take part in and enjoy every-day life activities (on foot), and not.
Acknowledgments
Umeå Municipality, Sweden, has actively contributed to formulating the questionnaire and detailed knowledge about the study sites. We thank Frida Leksell at Sweco Sverige AB for her valuable help with preparing the maps. We also thank the reviewers for their valuable input.
This paper was earlier presented in track F-4 (Liveability and Non-Motorized Transport) of World Conference on Transport Research (WCTR-2023) held at Montreal, Canada, during 17th–21st July 2023. Authors thank the track Chair for giving opportunity to submit our paper to the partner journal TSTL, Taylor & Francis (T&F).
Disclosure statement
No potential conflict of interest was reported by the author(s).
Data availability statement
The data that support the findings of this study are available from the corresponding author, Anindita Mandal, upon reasonable request.
Additional information
Funding
Notes
1 The price varies greatly based on various factors such as sample size, survey scope, collection strategy, and delivery content. A price estimate for a sample size of approximately 5,000 individuals, a survey of approximately 10 A4 pages, and delivery in the form of a microdata file and tables is from SEK 550,000 excluding VAT.
References
- Agrawal, A. W., & Schimek, P. (2007). Extent and correlates of walking in the USA. Transportation Research Part D: Transport and Environment, 12(8), 548–563. https://doi.org/10.1016/J.TRD.2007.07.005
- Barnett, D. W., Barnett, A., Nathan, A., Cerin, E., & Van Cauwenberg, J. (2017). Built environmental correlates of older adults’ total physical activity and walking: A systematic review and meta-analysis. International Journal of Behavioral Nutrition and Physical Activity, 14(1), 1–24. https://doi.org/10.1186/s12966-017-0558-z
- Bauer, D., Brändle, N., Seer, S., Ray, M., & Kitazawa, K. (2009). Measurement of pedestrian movements: A comparative study on various existing systems. In H. Timmermans (Ed.), Pedestrian behavior: Models, data collection and applications (1st ed., pp. 325–344). Emerald Group Publishing Limited. https://doi-org.proxy.lib.ltu.se/10.1108/9781848557512-015
- Carlson, J. A., Sallis, J. F., Conway, T. L., Saelens, B. E., Frank, L. D., Kerr, J., Cain, K. L., & King, A. C. (2012). Interactions between psychosocial and built environment factors in explaining older adults’ physical activity. Preventive Medicine, 54(1), 68–73. https://doi.org/10.1016/j.ypmed.2011.10.004
- Cervero, R., & Duncan, M. (2003). Walking, bicycling, and urban landscapes: Evidence from the San Francisco Bay Area. American Journal of Public Health, 93(9), 1478–1483. https://doi.org/10.2105/ajph.93.9.1478
- Chen, S.-T., Stevinson, C., Yang, C.-H., Sun, W.-J., Chen, L.-J., & Ku, P.-W. (2021). Cross-sectional and longitudinal associations of outdoor walking with overall mental health in later life. Experimental Gerontology, 151, 111428. https://doi.org/10.1016/j.exger.2021.111428
- Dill, J., Mohr, C., & Ma, L. (2014). How can psychological theory help cities increase walking and bicycling? Journal of the American Planning Association, 80(1), 36–51. https://doi.org/10.1080/01944363.2014.934651
- Ewing, R., & Cervero, R. (2010). Travel and the built environment. Journal of the American Planning Association, 76(3), 265–294. https://doi.org/10.1080/01944361003766766
- Ewing, R., Hajrasouliha, A., Neckerman, K. M., Purciel-Hill, M., & Greene, W. (2016). Streetscape features related to pedestrian activity. Journal of Planning Education and Research, 36(1), 5–15. https://doi.org/10.1177/0739456X15591585
- Hsu, M.-Y., Lee, S.-H., Yang, H.-J., & Chao, H.-J. (2021). Is brisk walking an effective physical activity for promoting Taiwanese adolescents’ mental health? Journal of Pediatric Nursing, 60, e60–e67. https://doi.org/10.1016/j.pedn.2021.03.012
- Keall, M. D., Shaw, C., Chapman, R., & Howden-Chapman, P. (2018). Reductions in carbon dioxide emissions from an intervention to promote cycling and walking: A case study from New Zealand. Transportation Research Part D: Transport and Environment, 65, 687–696. https://doi.org/10.1016/j.trd.2018.10.004
- Krizek, K. J., Handy, S. L., & Forsyth, A. (2009). Explaining changes in walking and bicycling behavior: challenges for transportation research. Environment and Planning B: Planning and Design, 36(4), 725–740. https://doi.org/10.1068/b34023
- Lee, C., & Moudon, A. V. (2006). Correlates of walking for transportation or recreation purposes. Journal of Physical Activity & Health, 3(s1), S77–S98. https://doi.org/10.1123/jpah.3.s1.s77
- Lee, K., & Sener, I. N. (2020). Emerging data for pedestrian and bicycle monitoring: Sources and applications. Transportation Research Interdisciplinary Perspectives, 4, 100095. https://doi.org/10.1016/j.trip.2020.100095
- MORPACE International. (2013). Bay Area Travel Survey, 2000. Inter-university Consortium for Political and Social Research Distributor. https://doi.org/10.3886/ICPSR34805.v1
- Morris, J. N., & Hardman, A. E. (1997). Walking to health. Sports Medicine, 23(5), 306–332. https://doi.org/10.2165/00007256-199723050-00004
- Neves, A., & Brand, C. (2019). Assessing the potential for carbon emissions savings from replacing short car trips with walking and cycling using a mixed GPS-travel diary approach. Transportation Research Part A: Policy and Practice, 123, 130–146. https://doi.org/10.1016/j.tra.2018.08.022
- Örarbäck, J., & Wilson, T. (2019). Fotgängarmätningar med wifi-teknik.
- Piva, G., Caruso, L., Gómez, A. C., Calzolari, M., Visintin, E. P., Davoli, P., Manfredini, F., Storari, A., Spinozzi, P., & Lamberti, N. (2022). Effects of forest walking on physical and mental health in elderly populations: A systematic review. Reviews on Environmental Health, 39(1), 121–136. https://doi.org/10.1515/reveh-2022-0093
- Rhodes, R. E., Brown, S. G., & McIntyre, C. A. (2006). Integrating the perceived neighborhood environment and the theory of planned behavior when predicting walking in a Canadian adult sample. American Journal of Health Promotion: AJHP, 21(2), 110–118. https://doi.org/10.4278/0890-1171-21.2.110
- Saelens, B. E., & Handy, S. L. (2008). Built environment correlates of walking: A review. Medicine and Science in Sports and Exercise, 40(7 Suppl), S550–S566. https://doi.org/10.1249/MSS.0b013e31817e67a4
- Statistikmyndigheten SCB. (n.d.-a). SCB:s medborgarundersökning. Retrieved May 30, 2023, from https://scb.se/vara-tjanster/bestall-data-och-statistik/regionala-statistikprodukter/medborgarundersokningen/
- Statistikmyndigheten SCB. (n.d.-b). Skräddarsydda undersökningar från SCB. Retrieved May 30, 2023, from https://www.scb.se/vara-tjanster/bestall-data-och-statistik/enkatundersokningar-och-fragekonstruktion/enkatundersokningar/
- Tortosa, E. V., Lovelace, R., Heinen, E., & Mann, R. P. (2021). Infrastructure is not enough: Interactions between the environment, socioeconomic disadvantage, and cycling participation in England. Journal of Transport and Land Use, 14(1), 693–714. https://doi.org/10.5198/jtlu.2021.1781
- Trivector, A. B. (2022). TravelVu – appen som detekterar resor. https://www.trivector.se/it-system/programvaror/travelvu/
- Umeå Municipality. (2016). Lundabron ska börja byggas. https://www.mynewsdesk.com/se/umea/pressreleases/lundabron-ska-boerja-byggas-1446146
- Umeå Municipality. (2023, October 2). Rådhusesplanaden. https://www.umea.se/radhusesplanaden
- Umeå Municipality (Gator och parker). (2019). Fotgängarprogram för Umeå.
- Yang, Y., & Diez-Roux, A. V. (2012). Walking distance by trip purpose and population subgroups. American Journal of Preventive Medicine, 43(1), 11–19. https://doi.org/10.1016/J.AMEPRE.2012.03.015
- Vägverket. (2005). Kostnadseffektiva resvaneundersökningar.
- Yen, H.-Y., Liao, Y., & Huang, W.-H. (2022). Walking and cycling for health: A multi-group analysis of path models between genders. Journal of Advanced Nursing, 78(11), 3721–3732. https://doi.org/10.1111/jan.15322