
Abstract
The interplay between urban planning and transportation deployment substantially influences a city’s sustainability and liveability, as well as quality of life. The quality of services supplied determines ridership on public transit. To assess and improve rider satisfaction, several studies have used a variety of approaches, digging into critical service qualities. These studies also compare other modes of transportation, including express and local buses, trains, Bus Rapid Transit and the dynamic interaction between local buses and rail transit. However, no study has yet compared the improvement priorities between conventional and electric buses. This study aimed to assess the effectiveness of combining the ordinal logit regression and random forest approaches with the three-factor theory to determine the prioritization of improvement for service attributes in electric and conventional buses, aiming to enhance passenger satisfaction during rides. This study’s findings indicate differences in the perceived importance of attributes for overall satisfaction and the priorities of service quality attributes for improvement between electric and conventional buses. The findings show that among the selected service quality attributes, primary emphasis should be placed on addressing the issues related to “availability of information on other communication technologies (application)” and “punctuality” of both conventional and electric buses. As for the secondary concerns, “comfort" and “comfort while alighting and boarding” should be addressed in both conventional and electric buses to enhance riders’ satisfaction. In conclusion, prioritizing improvement techniques for electric and conventional buses serves both customer satisfaction and larger goals of sustainable transportation and urban liveability.
1. Introduction
During the concluding two decades of the 21st century, the magnitude of concerns regarding urban pollution has markedly amplified. In parallel, the paramount significance of public transportation as a strategy to mitigate these challenges has been emphasized. Notably, in most industrialized nations, public transportation has observed a downward trend over the past 20 years and this phenomenon predominantly stems from factors such as population growth and urbanization (McNicol et al., Citation2001). This trend increases travel demand and drives the widespread adoption of private vehicles like cars, motorbikes, and others to meet transportation needs without compromising reliability, privacy, accessibility or comfort (Chauhan et al., Citation2022; Contreras & Paz, Citation2018). Travel patterns have become more complicated due to urbanization, necessitating the use of various transit options. This shift causes difficulties, such as longer transfer times and waiting periods. Enhancements to public transportation systems yield significant reductions in both traffic congestion and environmental pollution. Through the refinement of existing services and the introduction of novel ones, individuals may be more inclined to opt for public transportation as their preferred mode of travel. This choice consequently results in diminished reliance on alternative, often less sustainable, modes of transport (Gupta et al., Citation2022). Sustainable transportation is a critical component of the dream of a sustainable city, with transport policy and people’s travel behavioural impacting social, economic and environmental growth (Toth-Szabo et al., Citation2011). Monitoring whether a city’s transport infrastructure matches sustainable growth and whether policy initiatives meet their objectives is crucial. Researchers stress the relevance of service quality attributes as a handy tool to analyse the sustainability of transportation performance (Litman, Citation2007; Toth-Szabo et al., Citation2011). An organization’s capacity to fulfil its customers’ requirements is the measure of service quality (SQ). The perspectives of passengers directly influence the quality of public transportation. This shift from relying on public transit to private automobiles is driven by customers’ dissatisfaction with the services provided by policy makers. Hence. the quality of the services offered by public transport must be enhanced to increase ridership (Nwachukwu, Citation2014; Chauhan et al., Citation2021; Eboli & Mazzulla, Citation2008).
Public buses typically serve as the predominant means of public transportation within urban areas. Utilizing bus-based public transit can confer significant societal benefits, touching upon the economic, social and environmental dimensions of sustainable development. Transitioning from private vehicles to conventional and electric buses has attracted significant attention in academic research since the onset of the 21st century (Graham-Rowe et al., Citation2011). Electric buses have enhanced conventional buses’ ability to meet people’s transportation demands. Electric buses have various advantages over conventional vehicles (M. T. Islam et al., Citation2022). Electric buses are rapidly being advocated not only for their ability to address carbon emission concerns in public transportation, but also for their overall benefits to SQ, passenger pleasure and sustainability (Mahmoud & Hine, Citation2016). These buses provide a variety of features that improve commuters’ overall experiences. Their silent function decreases noise pollution, resulting in a more relaxing environment both within the bus and outside. Furthermore, the smooth acceleration and modern technology features help to provide a comfortable and flawless ride, hence boosting SQ (Corazza et al., Citation2016; Mahmoud & Hine, Citation2016; Sunitiyoso et al., Citation2022). However, it is critical to recognize that the factors influencing bus SQ may differ between conventional and electric vehicles, necessitating separate considerations. As a result, it is critical to evaluate the SQ of both conventional and electric buses individually. This assessment will improve rider satisfaction and help priorities change for various aspects, optimizing the entire passenger experience.
Moreover, most of the research has focused on assessing the contentment of commuters with a singular form of transportation, such as the heavy rail transit system (Huang et al., Citation2018; Olszewski & Krukowski, Citation2012; Shen et al., Citation2016), bus rapid transit (Anderson et al., Citation2012; Zheng et al., Citation2021), metro (Mandhani et al., Citation2021; Shahi & Bhattarai, Citation2021). On the other hand, some studies have mixed two or more types of transit services for analysing rider satisfaction, such as express and local buses (Wu et al., Citation2018), metro and Bus Rapid Transit (BRT) (Cao & Cao, Citation2017). While the literature has examined the enhancement priorities of local and express buses and those of bus rapid transit (BRT) metro structures, no study has yet compared the improvement priorities of conventional and electric buses. Moreover, these SQ studies are more pronounced to specific study area context and also require attention to specific requirements of commuters which are influenced by country specific cultural, social and economic aspects (Chauhan et al., Citation2021). The current study seeks to investigate riders’ impressions of electric and conventional buses, as well as to identify SQ features that need to be improved in a developing country such as Nepal. The increased reliance on private vehicles in Kathmandu, a densely populated city in Nepal with limited space and a population of 2.99 million, highlights the main reason for conducting present study. The absence of satisfactory public transportation services provided by transport planners has resulted in a considerable shift in people’s use of private vehicles.
To keep the focus on the comparative analysis of improvement priorities for conventional and electric buses, the study intentionally eliminates concerns for operation lines and crews. These characteristics are considered external and may change regardless of the type of bus, possibly hiding the fundamental differences between electric and conventional buses”. This study utilized an integration of ordinal logit regression (OLR) and random forest (RF) techniques, in conjunction with the three-factor theory (TFT), to investigate the study’s questions, namely: (a) How did the improvement priorities of SQ change after the implementation of electric buses? (b) Which SQ attributes should be prioritized to enhance user satisfaction towards public buses?
2. Literature review
Public transportation is crucial in mitigating the reliance on automobiles and the subsequent adverse outcomes, such as traffic congestion and carbon emissions (Gupta et al., Citation2022). An efficient transit system can redirect automobile journeys towards public transportation (De Oña et al., Citation2013). To ensure the continued growth and retention of ridership, transit agencies must prioritize examining rider satisfaction and enhancing key service attributes that have a significant impact. Rider satisfaction surveys are frequently utilized as a means of gathering feedback from riders regarding their satisfaction with a particular service attribute, as well as their overall satisfaction with the transit system. This data serves as a fundamental basis for understanding customer loyalty (Cao et al., Citation2015; Hu et al., Citation2015). So, scholars and professionals express a greater interest in examining the impact of SQ on rider’s overall satisfaction.
A substantial portion of previous research has explored the relationship between bus services and passenger satisfaction, with a focus on evaluating users’ contentment across various modes of transportation (Allen et al., Citation2020; Chauhan et al., Citation2022; Dell ́Olio et al., Citation2017; De Oña & De Oña, Citation2015; Mandhani et al., Citation2021). Literature has also identified the service attributes that display a better association with overall satisfaction or has determined the ranked order of attribute enhancements necessary to improve riders’ satisfaction (Cao et al., Citation2015; Wan et al., Citation2016; Wu et al., Citation2020). Additionally, these studies seek to elucidate how a rider’s global assessment of transit service is developed. Numerous methodologies have been utilized in prior research to evaluate the efficacy of SQ attributes and the general contentment of commuters concerning bus transit amenities. These methodologies include structural equation modelling (SEM), SERVQUAL, regression analysis, partial least square structural equation modelling (PLS-SEM) and RF. lists essential SQ parameters from prior studies.
Table 1. Factor examined based on the SQ of buses.
Based on current knowledge, a restricted number of research have considered the statistical significance and effect size when evaluating the importance of attributes affecting SQ. The present study employed regression model with dummy variables combining RF method to implement the TFT. The OLR techniques provide a more precise explanation of the non-linear relationships between attributes and overall satisfaction by considering the significance of the attributes without considering the effect size of the attributes. However, RF also measures non-linear relationships by considering the effect size. This study contributes to literature by combining both the methods to identify importance of attributes and thereafter, utilizing TFT to determine the improvement priorities of attributes to enhance the users’ satisfaction.
3. Methodology
3.1. Data and variables
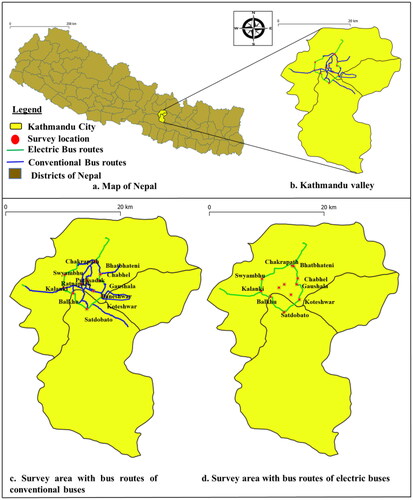
Kathmandu, the capital city of Nepal was chosen as the study area for this study. The study area with bus routes and survey locations within Kathmandu is shown in . Kathmandu is the most populated city of Nepal and is the fast-urbanizing cities in south Asia (MOPIT, Citation2015; Muzzini & Aparicio, Citation2013). The total population of Kathmandu city is 2.99 million (CBS Nepal, Citation2022). The total number of public transports are 4404 which include conventional buses such as large bus, minibus and micro bus with quantity 2036, 2036 and 336, respectively and are operating on total 201 routes in Kathmandu (Clean Air Network Nepal, Citation2013; MoPIT/JICA, Citation2012). The average number of trips by conventional buses are 948,464 as reported by Khokali (Citation2017). On the other hand, there are only few electric buses which are operated on two major routes in Kathmandu connecting three major cities namely; Lalitpur, Bhaktapur and Kathmandu (the capital city of Nepal, Itself). Furthermore, it’s important to note that detailed data such as passenger numbers, frequency of service, specific routes and daily commuters is currently unavailable in the public domain for electric buses. Our study focuses on enhancing urban mobility by comparing the improvement priorities of SQ for conventional and electric buses in Kathmandu city, examining the various operational features of both forms of transportation. The green lines in indicate that electric buses only operate on two specified routes, with time constraints. The initial stage of the survey was conducted for conventional buses.
Figure 1. Study area map (a) administrative boundary of Nepal, (b) Kathmandu valley area, (c) survey area with bus routes of conventional buses and (d) survey area with bus routes of electric buses.
The assessment factors for public bus SQ underwent a two-stage process. Firstly, factors for the assessment of the SQ of the public bus were selected from the studies in several countries that looked at the quality of service offered by public transportation, including trains, buses and metros, like Italy (Eboli & Mazzulla, Citation2007), Spain (De Oña et al., Citation2013), India (Deb & Ali Ahmed, Citation2018), Qatar (Shaaban & Khalil, Citation2013) and Bangladesh (M. R. Islam et al., Citation2016). Secondly, the pilot survey with 60 conventional bus users was conducted with the help of the questionnaire which was prepared after extensive literature review. To obtain the superior quality of data, respondents were well facilitated to understand the questionnaire. Based on the responses received from the pilot survey, 22 questions of SQ, as well as a question for overall satisfaction were considered for the final questionnaire which are presented in . A collection of 526 data samples was undertaken from 27 May to 17 June 2022. A study of similar scope and nature was undertaken on electric buses between the 1st and 23rd of February 2023, resulting in a collection of 388 valid data samples.
Table 2. Descriptive analyses and performance strength of attributes of service quality (rating of satisfaction).
3.1.1. Questionnaire design
The questionnaire was designed in two sections:
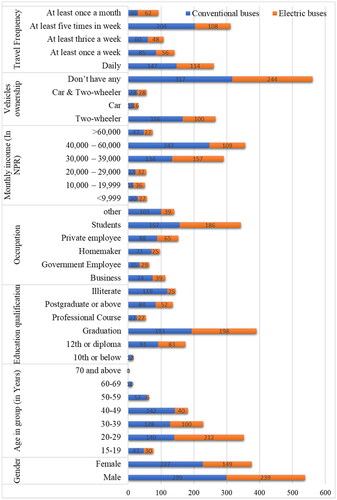
Socio-demographic characteristic and trip characteristic: Questions related to socio-demographic characteristics and trip characteristics including age, gender, qualification, occupation, vehicle ownership, travel frequency and household income were asked during survey. As shown in , conventional buses and electric buses riders have shown distinctive characteristics in the sample. Most of the riders of the conventional buses belong to the age group of 40–49 years followed by age group of 20–29 years however for electric buses most of the riders belong to the age group of 20–29 years.
Satisfaction rating of various attributes of SQ and overall satisfaction: During the survey, respondents were asked to evaluate the performance of twenty-two attributes of SQ and overall satisfaction. These lists of attributes were extracted after extensive literature review (Chauhan et al., Citation2022; De Oña & De Oña, Citation2015; Eboli & Mazzulla, Citation2007). They then scored the version using a Likert scale that ranged from “Excellent” (5) to “Worst” (1), “Good” (4) to “Neutral” (3) and “Poor” (2). summarizes the satisfaction rating of different attributes of SQ along with overall satisfaction of bus services quality after evaluation which were asked on the scale of five-point Likert scale. In terms of overall satisfaction of the SQ of the buses, conventional buses had a mean rating of 3.25 and standard deviation of 0.728; however, for electric buses had a mean rating of 3.51 and standard deviation of 0.796 for overall satisfaction.
Figure 2. Overview of socio-demographic and trip characteristics.
3.2. Modelling approaches
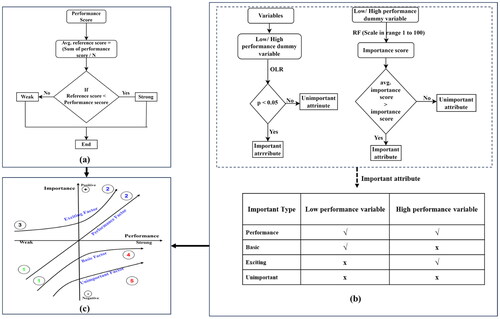
The study aims to identify the priority of each attribute for enhancing SQ of electric and conventional buses. These priorities were identified based on the performance strength of the attributes and significance and important types of attributes (). Initially, based on the rating obtained from the responses, the performance strength of the attributes was determined as shown in . Once the benchmarks for SQ features had been established, OLR and the RF technique were used to refine the results (). First, OLR approach is used to determine the important type of attributes on the basis of significance level (p < .05) by representing the performance level of each attribute in two mutually exclusive dummy variables; namely, “high performance” and “Low performance”. Similarly, the important attributes were identified by RF approaches on the basis of importance scored of dependent attributes. Once the important attributes were identified through OLR and RF, the table shown in , was used to find the overall importance of each attribute. Lastly, as shown in , TFT was used to determine the improvement priority of various SQ attributes on the basis of importance levels of the attributes as well as their performance strength. Once the improvement priority of the attributes was identified, ANOVA test was carried out on those attributes to determine the statistical significance of socio demographic characteristics namely, gender and age group.
Figure 3. Methodology flow chart: (a) determination of performance strength of attributes; (b) determination of important attributes of SQ by OLR and RF approaches and (c) illustration of three factor theory (TFT).
4. Analysis and results
4.1. Determination of performance strength of attributes
As shown in , for each attribute, the performance mean score is calculated and compared to the reference performance score (the score which is averaged across all observation and all attributes). If the performance score of the attribute is lower than the average reference score, it is considered to have “weak” performance, and if it is higher, it is deemed to have “strong” performance. Performance strength thus calculated for each attribute for conventional as well as electric buses is presented in .
4.2. Determination of importance type of attributes
4.2.1. Through OLR approach
A regression analysis with dummy variables is used to establish the statistical significance of each attribute, similar to previous research on the satisfaction levels of transit riders (Cao & Cao, Citation2017). Based on the ordinal nature of the dependent variables, the present study employs the OLR technique to ascertain the significance of various SQ attributes regarding customer satisfaction with public transport. This methodology estimates the impact of individual SQ attributes on overall satisfaction. In this study, the performance of each attribute of SQ is represented by two mutually exclusive dummy variables, namely “high-performance” and “low performance” so that the interpretation will become easy and increase the stability and the significance of the coefficients. The coding scheme for high-performance indicators involves assigning a value of “1” to the categories “excellent” and “good” and “0” to the rest categories. Conversely, for low performance, “worst” and “poor” are also assigned a value of “1” and the rest of the categories were assigned a value of “0”. displays the coding methodology used for the independent variables. After performing a regression analysis, if the coefficient of a specific attribute is determined to be statistically significant (p ≤ .05), it can be interpreted as a significant attribute within that particular dimension (ie low or high performance).
Table 3. Recoding strategies for five-point Likert scale.
The results of OLR for conventional buses, as shown in , illustrate those four attributes of high-performance variable (network coverage, information available at other communication technologies, journey time inside bus and sense of security to women against harassment) have significant positive effect on riders’ overall satisfaction. In the same way, for low-performance variable, four attributes (availability of the walking infrastructure, availability of travel-related information at bus, information available at other communication technologies and attitude of the driver/conductor) have significant positive effects on rider’s overall satisfaction of conventional bus services.
Table 4. Ordinal logistic regression results for conventional buses and electric buses.
Similarly, in case of electric buses, two attributes of high-performance variable (Comfort while alighting and boarding and sense of security to women against harassment) have significant positive effects and three attributes of low-performance variable (availability of travel-related information at bus, level of comfort and Comfort while alighting and boarding) have significant positive effects on rider’s overall satisfaction of electric bus services.
4.2.2. Through random forest (RF) approach
Because of the inherent heterogeneity in respondents’ perceptions, using a single mode to assess the critical qualities of SQ may not be the most effective strategy. As a result, after OLR deployment, RF is employed as the second strategy to obtain comprehensive estimation results (Rasouli & Timmermans, Citation2014). RF model is generated through the process of “bagging”, also referred to as bootstrap aggregating, of classification and regression trees (CART) (Breiman, Citation1996, Citation2001). The RF algorithm is an enhanced version of the decision tree algorithm that combines several decision trees (Zheng et al., Citation2021). Python environment is utilized for RF modelling to compute the importance score of every attribute pertaining to SQ. Initially, the importance scores of each attribute are evaluated by assessing their influence on five levels of the dependent variables using a scale ranging from 0 to 100. Then, the average importance score is computed across all attributes. The determination of important attributes was based on their importance score surpassing the average importance score, also known as the reference score. An attribute is considered “important” if its average importance score exceeds its individual importance score. Alternatively, the attributes can be deemed as “unimportant” as shown in .
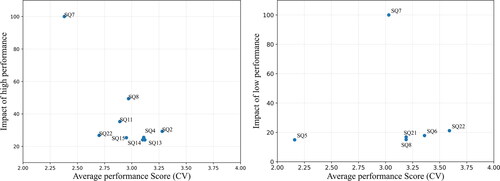
shows the important variables for electric buses that are obtained from the result of RF method in which left graph shows high-performance indicators and right graph shows low-performance indicators. Similarly, shows the important variables for conventional buses that are obtained from the result of RF method in which left graph shows high-performance indicators and right graph shows low-performance indicator. From and , variables that are important as identified by OLR (Comfort while alighting and boarding and sense of security to women against harassment) are also identified as important by RF in high-performance indicators. Additionally, the RF algorithm also captured certain variables such as the “Frequency”, “network coverage”, “availability of walking infrastructure”, “availability of travel-related information at the bus stop”, “attitude of the driver/conductor”, “Level of comfort” and “seat availability/maintenance of seats at bus stop” for high-performance indicators. Similarly, for low-performance indicators, two variables, “Level of comfort”, “Comfort while alighting and boarding” are found to be important as identified by both OLR and RF algorithm. For low-performance indicators, the RF algorithm considered variables such as the “Frequency”, “real-time information inside the bus”, “journey time inside the bus”, “attitude of the driver/conductor” and “security against crimes/thefts during travel”.
Figure 4. Random forest results for electric buses.
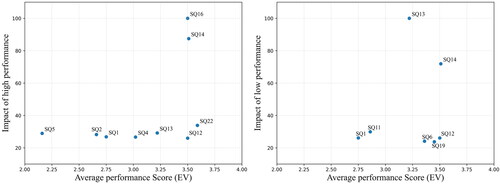
Figure 5. Random forest results for conventional buses.
4.3. Priority determination by three factor theory (TFT)
To evaluate the influence of specific attributes of SQ on riders’ overall satisfaction, it is necessary to prioritize effect sizes which is done by RF method (Breiman, Citation1996; Cao & Cao, Citation2017; Ogutu et al., Citation2011; Zheng et al., Citation2021). At the same time, the OLR approach is utilized to establish the statistical significance of the given attributes (Breiman, Citation1996; Cao & Cao, Citation2017; Ogutu et al., Citation2011; Wu et al., Citation2018; Zhang et al., Citation2019). Thus, by integrating both RF and OLR, it is possible to ascertain consistent and inclusive importance categories for each attribute. Table shown in categorizes attributes into four types of importance, as determined by the results obtained from OLR and RF. The attributes of SQ have been classified into four factors based on the importance of performance-related dummy variables, as illustrated in , which is as per the concept TFT (Kano, Citation1984; Matzler et al., Citation2004; Wu et al., Citation2018). Based on the TFT theoretical framework, attributes that impact riders’ overall satisfaction only if they exhibit subpar performance are categorized as basic factors. Conversely, attributes that influence overall satisfaction exclusively when they demonstrate superior performance are considered exciting factors. Further, factors significantly affecting overall satisfaction, regardless of whether they perform poorly or well, are classified as performance factors. Lastly, unimportant factors do not influence the overall satisfaction of customers. shows the importance type assigned to each attribute of electric and conventional buses on the basis of results obtained from TFT.
Table 5. Rules for determining the ranking of attributes which affect overall satisfaction.
Each attribute’s improvement priority is based on its performance strength and importance category. The prioritization of improvement of attribute is determined by the regulations outlined in . Weakly performing basic and performance elements are prioritized because they negatively impact riders’ overall satisfaction. The overall satisfaction of riders is influenced by both exciting and performance variables, particularly when a robust performance is present. So, they are given second priority since focusing on enhancing variables already doing well may be impractical and may not be cost-effective. The third priority is set aside for weak exciting factors, which will still be helpful if the reference performance improves. Basic factors with high performance have the fourth priority. The least critical aspects are given the lowest priority because they have negligible effects on the riders’ overall satisfaction.
On the basis of importance of attributes presented in and considering the performance strength of attributes obtained as shown in , the improvement priorities of each attribute are determined according to the rule explained in . These improvement priorities are then illustrated in . The improvement priorities of each attribute are based on the ranking which range from 1 to 5. The attribute’s importance and priority for improvement are inversely proportional to its improvement priority value. A higher priority ranking value indicates a lower importance, while a lower improvement priority value indicates a higher importance. For example, in the context of service providers considering improving the quality of their service, if the improvement priority value of a certain characteristic is 1, it indicates that this attribute is assigned a higher level of urgency compared to other attributes.
Table 6. Importance type of each type of service quality attributes.
Table 7. Improvement priority of different service quality attributes.
Among the various attributes of SQ of conventional buses, “availability of travel-related information at bus stop”, “real time information inside bus”, “punctuality”, “security against crimes/thefts during travel”, “sense of security to women against harassment” and “lighting at bus stop” has the first priority for the improvement. This means that these are attributes which need to be improved most urgently and should be considered first for the improvement of the service provided by conventional buses so as to improve the overall satisfaction of the riders. But in case of electric buses, the improvement priority of “sense of security to women against harassment” has moved to second priority, “availability of travel-related information at bus stop” has moved to third priority and “real time information inside bus” has moved to fourth priority. This is because of the advancement of the technology in electric buses and installation of CCTV and availability of security personnel on those buses. Although some attributes like “punctuality” and “information available at other communication technologies” both are in first priority as there is no availability of mobile applications, websites or online platforms where the transport planners/service providers can publish the valuable information related to fares, schedule, routes and disruption of services.
Similarly, in the case of electric buses, among the various attributes, “frequency”, “availability of walking infrastructure” and “punctuality” are at the first priority of improvement. Those attributes are at first priority because of a smaller number of electric buses in the fleet which does not provide more frequent service to the riders and lack of proper pedestrian connectivity and comfortable waiting environments to electric bus stops along with accessible and well-maintained sidewalks, crosswalks and footpath.
4.4. ANOVA test
ANOVA analysis aimed to compare how genders and age groups perceived these traits and how they influenced SQ. Regarding conventional buses, there were statistically significant differences in attributes with respect to gender such as “real-time information inside buses (SQ6)” and “information available at other communication technologies (SQ7)”, with p values less than .05 as presented in of Appendix A. Furthermore, variables such as “punctuality (SQ8)”, “lighting at bus stops (SQ21)”, and “security for women against harassment (SQ22)” had p values near .05, indicating probable gender differences in satisfaction levels. Females reported lower satisfaction with these attributes than males, with the greatest F-value of 14.10 found for “information available at other communication technologies SQ7)”, showing significant gender heterogeneity. Similarly, significant age-group differences were discovered for traits such as “punctuality (SQ8)”, with a p value less than .05 and a maximum F-value of 2.523 and “security against crimes/theft (SQ18)”, with a p value close to .05 (.06) as shown in of Appendix A.
In the case of electric buses, a statistically significant difference was observed based on gender for the attribute “availability of walking infrastructure (SQ4)”, with a p value of .07 and a maximum F-value of 3.13 as presented in of Appendix A. Furthermore, it can be inferred from the mean values of the mentioned attributes that females exhibited lower satisfaction compared to males. Similarly, a statistically significant difference based on age groups was identified for the same attribute, “availability of walking infrastructure (SQ4)” with a p value of .01 and a maximum F-value of 3.12 as presented in of Appendix A. ANOVA tests were performed on SQ variables chosen as priorities for improvement in electric and conventional buses.
5. Discussion
The present study had explored the improvement priorities of different attributes of SQ so as to improve the overall satisfaction of the riders by analysing the SQ of electric and conventional buses of Kathmandu (the capital city of Nepal). These priorities were based on the performance strength of the attributes, significance and important types of attributes which were obtained by combining RF method to implement TFT. Twenty-two attributes of SQ were chosen for analysing the improvement priorities of the attributes. From the analysis, “information available at other communication technologies (SQ7)” and “Punctuality SQ8)” were observed to be prioritized first for both electric and conventional buses. Similarly, “Comfort while alighting and boarding” and “Level of comfort” were observed to be improved as second priority to improve the rider satisfaction of the electric and conventional buses.
Besides “SQ7” and “SQ8”, “availability of travel related information bus stop (SQ5)”, “real time information inside bus (SQ6)”, “Security against crimes/thefts (SQ19)” and “security to women against harassment (SQ22)” are the attributes which were also given high priority so as to improve the rider’s satisfaction of conventional buses. These attributes were also found to be in top priority in previous studies (Chauhan et al., Citation2022; Kim et al., Citation2018; Morton et al., Citation2016). These attributes were associated with information, safety and security. Although these attributes were given first priority in the case of conventional buses, a different trend was observed with respect to electric buses and those attributes were prioritized as 3rd, 4th and 2nd priority, respectively.
Apart from “SQ13” and “SQ14”, “network coverage (SQ2)” and “Availability of walking infrastructure (SQ4)” are given the second priority so as to boost the rider’s satisfaction for the conventional buses. These seem to be in agreement with previous studies (Ismael & Duleba, Citation2021) but for electric buses these attributes were priorities as 3rd and 1st respectively. Similarly, “Journey time (SQ11)” and “Cleanliness (SQ15)” are given 3rd priority, and “attitude of the driver/conductor (SQ12)” is given 4th priority for boosting the rider’s satisfaction of conventional buses. These seem to be similar to prior studies like (Bose & Pandit, Citation2020; Deb et al., Citation2022; Eboli & Mazzulla, Citation2009).
And finally, the last priority is given to “Frequency (SQ1)”, “Convenient bus stop accessibility (SQ3)”, “regularity (SQ9)”, “passengers waiting time at bus stop (SQ10)”, “Seat availability/maintenance at bus stop (SQ16)”, “condition of bus (SQ17)”, “Shelter availability at bus stop (SQ18)” and “lighting inside bus (SQ20)” for boosting the rider’s satisfaction of conventional buses. Among these attributes, “SQ3”, “SQ9”, “SQ10”, “SQ17”, “SQ18” and “SQ20” attributes were also priorities for 5th rank for the improvement of rider’s overall satisfaction of electric buses. These attributes were also found to be least important in prior studies (Chauhan et al., Citation2022; Noor et al., Citation2014; Wu et al., Citation2020).
Access to the information availability at other communication technologies like mobile apps or websites increases the passenger’s convenience, while reliable punctuality will minimize the waiting times. These attributes are connected to each other with available information contributing to improved punctuality, which ultimately enhance the overall public transportation experiences in Nepal (Kandel et al., Citation2023). Since the advent of electric buses, there has been a noticeable shift in passenger priorities, with a greater emphasis on availability, accessibility, comfort and convenience. Passengers prioritize attributes such as frequency, availability of walking infrastructure, journey time and driver/conductor attitude, showing a desire for improved SQ. As recommended by previous studies, methods such as expanding fleet size, optimizing scheduling and establishing bus priority lanes can increase the frequency of bus services which ultimately improve the overall satisfaction of public transport users (Chauhan et al., Citation2021; Deb & Ahmed, Citation2019).
Furthermore, attributes such as information availability in other communication technologies, availability of travel-related information at bus stops and lighting and shelter availability at bus stops must be addressed. Shelters, enough seating and lighting, as well as digital information displays and the development of mobile applications, can all help to improve passenger satisfaction at bus stops. Furthermore, factors such as light inside buses, level of comfort, ease of boarding and alighting, and regularity remain strong for both electric and conventional buses, considerably influencing rider satisfaction. Transport planners should prioritize improving these features to maintain customer satisfaction and improve overall public transport services.
6. Conclusions
This research looks into how satisfied passengers are with conventional and electric buses. In this research, the quality of service provided by electric and conventional buses was compared using a customer satisfaction survey. Previous research into maximizing customer satisfaction through SQ alterations has typically relied on structural equation modelling (SEM), partial least square-structural equation modelling (PLS-SEM), SERVQUAL, etc. (Chauhan et al., Citation2022; dell’Olio et al., Citation2018; De Oña et al., Citation2013; Machado-León et al., Citation2016; Mandhani et al., Citation2021). However, few studies have used a comprehensive approach integrating OLR, RF and TFT to prioritize which aspects of conventional and electric buses customers value most and which should be improved first (Wu et al., Citation2018; Zheng et al., Citation2021).
This study examines the impact of various attributes of SQ on the overall satisfaction of riders, comparing conventional and electric buses. Additionally, it investigates how the influence of these attributes on overall satisfaction changes after the introduction of electric buses. Initially, the RF algorithm is utilized to ascertain the impact of individual attributes. The RF method is employed in this study because it can attain superior predictive accuracy and capture attitudinal variability through a decision tree ensemble. Subsequently, OLR was applied to the survey responses for both conventional and electric buses. By deploying OLR and RF techniques, uncertainties can be mitigated. This is facilitated by OLR’s ability to evaluate statistical significance and RF’s competency in assessing attribute importance through effect size analysis.
The study’s findings indicate that attributes can be classified into three distinct categories based on their priority for improving the overall satisfaction of electric and conventional bus riders. These categories pertain to attributes that exhibit a consistent priority level for both conventional and electric buses, attributes that display a decrease in priority for electric buses (increase in priority of conventional buses) and attributes that demonstrate an increase in priority for electric buses (decrease in priority of conventional buses). This study aimed to investigate the disparity in attribute priorities between conventional and electric buses through attribute indicators. The present study’s results will provide valuable insights for bus transit planners and policy makers regarding the influence of various attributes on the overall satisfaction levels of riders with conventional and electric buses.
Additionally, according to the study’s conclusions, governments should adopt pragmatic plans that focus on the essential goals outlined for improving overall bus transit services and increasing the usage of both conventional and electric buses. Notably, "information available through other communication technologies" and "punctuality" appear as top priorities, with both attributes scoring highest for conventional and electric buses. Transportation planners and practitioners ought to prioritize these areas to increase overall SQ and rider satisfaction. For example, optimizing timetables, enhancing infrastructure and deploying effective fleet management strategies could help to improve punctuality. Similarly, boosting information available through other communication technologies may entail delivering real-time updates, installing user-friendly software with language support and ensuring thorough information distribution. Furthermore, the study calls for the development and implementation of diversity and inclusion guidelines in public transportation regulations, to ensure equitable treatment for all passengers, regardless of gender or age and address any underlying biases. Implementing these recommendations will result in considerable improvements in overall SQ and customer satisfaction for both electric and conventional buses. According to the findings of this study, a variety of measures can be offered to improve overall SQ and customer satisfaction for electric and conventional buses.
7. Information, safety & security
Implementing the Real-Time Passenger Information (RTOI) system is essential for furnishing passengers with current journey updates.
Both electric and conventional buses should feature panic buttons capable of instantly alerting the nearest police station during emergencies.
The installation of CCTV cameras at bus stations and within buses enhances security measures.
8. Comfort
Proper lighting inside buses so that people will feel comfortable travelling during the nights.
Proper training should be provided to the driver/conductor to reduce consequences of speeding, distracted driving and others poor behaviours.
9. Accessibility and availability
Better frequency and network coverage of the public buses.
Proper walking infrastructure (availability of footpath, sidewalk, etc.) by removal of illegal enhancement of street vendors.
Improving SQ through recommendations in a variety of areas is critical, but so is determining the feasibility of implementing these proposals. Furthermore, comprehensive urban transport regulations must be enforced to create an egalitarian, integrated, safer and more sustainable overall public transport system. This includes developing policies, regulations and standards for effectively governing, administering and promoting public transportation. Integrating sustainable transportation principles into urban planning initiatives also improves community liability. Cities that prioritize ecologically friendly modes of transportation, such as electric buses, can create more lively and healthy environments for their citizens.
Furthermore, while this analysis focused on comparing the improvement priorities of SQ attributes for electric and conventional buses, factors such as urban growth, geographic form, resident travel demand and transportation system composition were not completely examined. To create the most successful strategy, policymakers must carefully analyse the study’s recommended priorities in light of real-world scenarios and policy goals. Furthermore, it is critical to recognize that inconsistencies in SQ between electric and conventional buses may be due to operational variances in bus lines. These constraints provide an opportunity for future research to look deeper into the impact of operational factors on SQ across different bus types, thereby improving our understanding and enabling more targeted improvement measures. Additionally, while age and gender were tested using ANOVA, other important socio-demographic factors such as monthly income, qualification and occupation were excluded from the analysis. This decision was reached due to the necessity for a more in-depth investigation to fully examine the impact of socio-demographic characteristics on SQ perceptions in public transport. These limitations recommend that future research should investigate the impact of a larger variety of socio-demographic characteristics on perceptions of SQ in public transport, resulting in a more thorough understanding of passenger preferences and requirements. The absence of data on the average number of trips made specifically by electric buses poses a challenge in accurately assessing this aspect of the analysis. However, researchers can enhance their analyses and derive more nuanced findings on SQ judgments in public transport by incorporating respondents who have experience of riding both types of buses.
Disclosure statement
No potential conflict of interest was reported by the author(s).
References
- Allen, J., Eboli, L., Mazzulla, G., & Ortúzar, J. D. D. (2020). Effect of critical incidents on public transport satisfaction and loyalty: An ordinal probit SEM-MIMIC approach. Transportation, 47(2), 1–32. https://doi.org/10.1007/s11116-018-9921-4
- Anderson, D., Patarapichayatham, C., & Nese, J. F. (2012). Basic concepts of structural equation modeling. Behavioral Research and Teaching, University of Oregon.
- Bose, T., & Pandit, D. (2020). Heterogeneity in perception of service quality attributes of bus transit across various user categories- A case of Kolkata. Transportation Research Procedia, 48, 2784–2799. https://doi.org/10.1016/j.trpro.2020.08.239
- Breiman, L. (1996). Bagging predictors. Machine Learning, 24(2), 123–140. https://doi.org/10.1007/BF00058655
- Breiman, L. (2001). Random forests. Machine Learning, 45(1), 5–32. https://doi.org/10.1023/A:1010933404324
- Cao, J., & Cao, X. (2017). Comparing importance-performance analysis and three-factor theory in assessing rider satisfaction with transit. Journal of Transport and Land Use, 10, 837–854.
- Cao, J., Zhang, C., Cao, X., & Huang, X. (2015). The gaps in satisfaction with transit services among BRT, metro, and bus riders: Evidence from Guangzhou. Journal of Transport and Land Use, 9, 97–109. https://doi.org/10.5198/jtlu.2015.592
- CBS Nepal. (2022). Nepal census 2021. https://censusnepal.cbs.gov.np/results/downloads/provincial/3
- Chauhan, V., Gupta, A., & Parida, M. (2021). Demystifying service quality of Multimodal Transportation Hub (MMTH) through measuring users’ satisfaction of public transport. Transport Policy, 102, 47–60. https://doi.org/10.1016/j.tranpol.2021.01.004
- Chauhan, V., Gupta, A., & Parida, M. (2022). Evaluating service quality of Multimodal Transportation Hub (MMTH) in Delhi, India: A gender-based perspective. Case Studies on Transport Policy, 10(2), 1234–1248. https://doi.org/10.1016/j.cstp.2022.04.007
- Clean Air Network Nepal. (2013). Urban mobility in Kathmandu status and trends. Clean Air Network Nepal/Clean Energy Nepal.
- Contreras, S. D., & Paz, A. (2018). The effects of ride-hailing companies on the taxicab industry in Las Vegas, Nevada. Transportation Research Part A: Policy and Practice, 115, 63–70. https://doi.org/10.1016/j.tra.2017.11.008
- Corazza, M. V., Guida, U., Musso, A., & Tozzi, M. (2016). A new generation of buses to support more sustainable urban transport policies: A path towards “greener” awareness among bus stakeholders in Europe. Research in Transportation Economics, 55, 20–29. https://doi.org/10.1016/j.retrec.2016.04.007
- Das, S., & Pandit, D. (2013). Importance of user perception in evaluating level of service for bus transit for a developing country like India: A review. Transport Reviews, 33(4), 402–420. https://doi.org/10.1080/01441647.2013.789571
- Deb, S., & Ahmed, M. A. (2019). Quality assessment of city bus service based on subjective and objective service quality dimensions: Case study in Guwahati, India. Benchmarking: An International Journal, 26(2), 567–589. https://doi.org/10.1108/BIJ-11-2017-0309
- Deb, S., & Ali Ahmed, M. (2018). Determining the service quality of the city bus service based on users’ perceptions and expectations. Travel Behaviour and Society, 12, 1–10. https://doi.org/10.1016/j.tbs.2018.02.008
- Deb, S., Ali, M., & Das, D. (2022). Case studies on transport policy service quality estimation and improvement plan of bus Service : A perception and expectation based analysis. Case Studies in Transport Policy, 10(3), 1775–1789. https://doi.org/10.1016/j.cstp.2022.07.008
- Dell ́Olio, L., Ibeas, A., de Ona, J., & de Ona, R. (2017). Public transportation quality of service: Factors, models, and applications. Elsevier.
- dell’Olio, L., Ibeas, A., de Oña, J., & de Oña, R. (2018). How to study perceived quality in public transport. Public Transportation Quality of Service, 7–32. https://doi.org/10.1016/b978-0-08-102080-7.00002-1
- De Oña, J., & De Oña, R. (2015). Quality of service in public transport based on customer satisfaction surveys: A review and assessment of methodological approaches. Transp. Transportation Science, 49(3), 605–622. https://doi.org/10.1287/trsc.2014.0544
- De Oña, J., De Oña, R., & Calvo, F. J. (2012). A classification tree approach to identify key factors of transit service quality. Expert Systems with Applications. 39(12), 11164–11171. https://doi.org/10.1016/j.eswa.2012.03.037
- De Oña, J., De Oña, R., Eboli, L., & Mazzulla, G. (2013). Perceived service quality in bus transit service: A structural equation approach. Transport Policy, 29, 219–226. https://doi.org/10.1016/j.tranpol.2013.07.001
- Eboli, L., & Mazzulla, G. (2007). Service quality attributes affecting customer satisfaction for bus transit. Journal of Public Transportation, 10(3), 21–34. https://doi.org/10.5038/2375-0901.10.3.2
- Eboli, L., & Mazzulla, G. (2008). A stated preference experiment for measuring service quality in public transport. Transportation Planning and Technology, 31(5), 509–523. https://doi.org/10.1080/03081060802364471
- Eboli, L., & Mazzulla, G. (2009). A new customer satisfaction index for evaluating transit service quality. Journal of Public Transportation, 12(3), 21–37. https://doi.org/10.5038/2375-0901.12.3.2
- Graham-Rowe, E., Skippon, S., Gardner, B., & Abraham, C. (2011). Can we reduce car use and, if so, how? A review of available evidence. Transportation Research Part A: Policy and Practice, 45(5), 401–418. https://doi.org/10.1016/j.tra.2011.02.001
- Gupta, A., Bivina, G. R., & Parida, M. (2022). Does neighborhood design matter for walk access to metro stations? An integrated SEM-Hybrid discrete mode choice approach. Transport Policy, 121, 61–77. https://doi.org/10.1016/j.tranpol.2022.03.010
- Hu, X., Zhao, L., & Wang, W. (2015). Impact of perceptions of bus service performance on mode choice preference. Advances in Mechanical Engineering, 7(3), 168781401557382. https://doi.org/10.1177/1687814015573826
- Huang, W., Shuai, B., Sun, Y., Wang, Y., & Antwi, E. (2018). Using entropy-TOPSIS method to evaluate urban rail transit system operation performance: The China case. Transportation Research Part A: Policy and Practice, 111, 292–303. https://doi.org/10.1016/j.tra.2018.03.025
- Islam, M. R., Hadiuzzaman, M., Banik, R., Hasnat, M. M., Musabbir, S. R., & Hossain, S. (2016). Bus service quality prediction and attribute ranking: A neural network approach. Public Transport, 8(2), 295–313. https://doi.org/10.1007/s12469-016-0124-0
- Islam, M. T., Kabir, R., & Nisha, M. (2022). Data analysis with stata: A comprehensive guide for data analysis and interpretation of outputs (1st ed.). ASA Publications Dhaka.
- Ismael, K., & Duleba, S. (2021). Investigation of the relationship between the perceived public transport service quality and satisfaction: A PLS-SEM technique. Sustainability, 13(23), 13018. https://doi.org/10.3390/su132313018
- Kandel, S., Khadka, S., Giri, S., & Thapa, S. (2023). Public transportation assessment along Kathmandu Bhaktapur route. Journal of Interior Designing and Regional Planning, 8(2), 22–30. https://doi.org/10.46610/JoIDRP.2023.v08i02.003
- Kano, N. (1984). Attractive quality and must-be quality. Journal of the Japanese Society for Quality Control, 31, 147–156.
- Khokali, B. B. (2017). Piloting sustainable urban transport index (SUTI) in Kathmandu Valley, Nepal. https://www.unescap.org/sites/default/files/SUTI%20%20Mobility%20Assessment%20Report%20-%20Kathmandu.pdf
- Kim, J., Schmöcker, J. D., Yu, J. W., & Choi, J. Y. (2018). Service quality evaluation for urban rail transfer facilities with Rasch analysis. Travel Behaviour and Society, 13, 26–35. https://doi.org/10.1016/j.tbs.2018.05.002
- Litman, T. (2007). Developing indicators for comprehensive and sustainable transport planning. Transportation Research Record: Journal of the Transportation Research Board, 2017(1), 10–15. https://doi.org/10.3141/2017-02
- Machado-León, J. L., de Oña, R., & de Oña, J. (2016). The role of involvement in regards to public transit riders’ perceptions of the service. Transport Policy, 48, 34–44. https://doi.org/10.1016/j.tranpol.2016.02.014
- Mahmoud, M., & Hine, J. (2016). Measuring the influence of bus service quality on the perception of users. Transportation Planning and Technology, 39(3), 284–299. https://doi.org/10.1080/03081060.2016.1142224
- Mandhani, J., Nayak, J. K., & Parida, M. (2021). Establishing service quality interrelations for Metro rail transit: Does gender really matter? Transportation Research Part D: Transport and Environment, 97, 102888. https://doi.org/10.1016/j.trd.2021.102888
- Matzler, K., Bailom, F., Hinterhuber, H. H., Renzl, B., & Pichler, J. (2004). The asymmetric relationship between attribute-level performance and overall customer satisfaction: A reconsideration of the importance–performance analysis. Industrial Marketing Management, 33(4), 271–277. https://doi.org/10.1016/S0019-8501(03)00055-5
- McNicol, B. D., Rand, D. A. J., & Williams, K. R. (2001). Fuel cells for road transportation purposes—Yes or no? Journal of Power Sources, 100(1-2), 47–59. https://doi.org/10.1016/S0378-7753(01)00882-5
- MOPIT. (2015). Yearly progress report F.Y.072/73, YPR (GoN). https://www.mopit.gov.np/downloadfiles/Yearly%20Progress%20Report%20FY%20072-73%20(In%20Nepali)_1561623752.pdf
- MoPIT/JICA. (2012). The Federal Democratic Republic of Nepal data collection survey on traffic ımprovement in final report October 2012 data collection survey on traffic ımprovement. Japan International Cooperation Agency. https://openjicareport.jica.go.jp/614/614/614_116_12176350.html
- Morton, C., Caulfield, B., & Anable, J. (2016). Customer perceptions of quality of service in public transport: Evidence for bus transit in Scotland. Case Studies on Transport Policy, 4(3), 199–207. https://doi.org/10.1016/j.cstp.2016.03.002
- Muzzini, E., & Aparicio, G. (2013). Urban growth and spatial transition in Nepal. The World Bank. https://doi.org/10.1596/978-0-8213-9659-9
- Noor, H. M., Nasrudin, N., & Foo, J. (2014). Determinants of customer satisfaction of service quality: City bus service in Kota Kinabalu, Malaysia. Procedia - Social and Behavioral Sciences, 153, 595–605. https://doi.org/10.1016/j.sbspro.2014.10.092
- Nwachukwu, A. A. (2014). Assessment of passenger satisfaction with intra-city public bus transport services in Abuja, Nigeria. Journal of Public Transportation, 17(1), 99–119. https://doi.org/10.5038/2375-0901.17.1.5
- Ogutu, J. O., Piepho, H. P., & Schulz-Streeck, T. (2011). A comparison of random forests, boosting and support vector machines for genomic selection. BMC Proceedings, 5(Suppl 3), S11. https://doi.org/10.1186/1753-6561-5-S3-S11
- Olszewski, P., & Krukowski, P. (2012, October). Quantitative assessment of public transport interchanges. In 40th European Transport Conference, Glasgow.
- Rasouli, S., & Timmermans, H. (2014). Applications of theories and models of choice and decision-making under conditions of uncertainty in travel behavior research. Travel Behaviour and Society, 1(3), 79–90. https://doi.org/10.1016/j.tbs.2013.12.001
- Sam, E. F., Hamidu, O., & Daniels, S. (2018). SERVQUAL analysis of public bus transport services in Kumasi metropolis, Ghana: Core user perspectives. Case Studies on Transport Policy, 6(1), 25–31. https://doi.org/10.1016/j.cstp.2017.12.004
- Shaaban, K., & Khalil, R. F. (2013). Investigating the customer satisfaction of the bus service in Qatar. Procedia - Social and Behavioral Sciences, 104, 865–874. https://doi.org/10.1016/j.sbspro.2013.11.181
- Shahi, P. B., & Bhattarai, D. K. (2021). Integrated multi-modal transportation system: A sustainable approach for urban transport in Kathmandu. IOSR Journal of Mechanical and Civil Engineering, 18, 47–59. https://doi.org/10.9790/1684-1806034759
- Shen, W., Xiao, W., & Wang, X. (2016). Passenger satisfaction evaluation model for urban rail transit: A structural equation modeling based on partial least squares. Transport Policy, 46, 20–31. https://doi.org/10.1016/j.tranpol.2015.10.006
- Sunitiyoso, Y., Belgiawan, P. F., Rizki, M., & Hasyimi, V. (2022). Public acceptance and the environmental impact of electric bus services. Transportation Research Part D: Transport and Environment, 109, 103358. https://doi.org/10.1016/j.trd.2022.103358
- Toth-Szabo, Z., Varhelyi, A., Koglin, T., & Angjelevska, B. (2011). Measuring sustainability of transport in the city – development of an indicator set. Lund University Bulletin, (261), 100. https://portal.research.lu.se/portal/files/5433221/1882700.pdf
- Wan, D., Kamga, C., Hao, W., Sugiura, A., & Beaton, E. B. (2016). Customer satisfaction with bus rapid transit: A study of New York City select bus service applying structural equation modeling. Public Transport, 8(3), 497–520. https://doi.org/10.1007/s12469-016-0135-x
- Wong, R. C. P., Szeto, W. Y., Yang, L., Li, Y. C., & Wong, S. C. (2017). Elderly users’ level of satisfaction with public transport services in a high-density and transit-oriented city. Journal of Transport & Health, 7, 209–217. https://doi.org/10.1016/j.jth.2017.10.004
- Wu, X., (Jason) Cao, X., & Ding, C. (2020). Exploring rider satisfaction with arterial BRT: An application of impact asymmetry analysis. Travel Behaviour and Society, 19, 82–89. https://doi.org/10.1016/j.tbs.2019.12.006
- Wu, X., Cao, J., & Huting, J. (2018). Using three-factor theory to identify improvement priorities for express and local bus services: An application of regression with dummy variables in the Twin Cities. Transportation Research Part A: Policy and Practice, 113, 184–196. https://doi.org/10.1016/j.tra.2018.04.003
- Zhang, C., Cao, X., Nagpure, A., & Agarwal, S. (2019). Exploring rider satisfaction with transit service in Indore, India: An application of the three-factor theory. Transportation Letters, 11(8), 469–477. https://doi.org/10.1080/19427867.2017.1398484
- Zheng, Y., Kong, H., Petzhold, G., Barcelos, M. M., Zegras, C. P., & Zhao, J. (2021). User satisfaction and service quality improvement priority of bus rapid transit in Belo Horizonte, Brazil. Case Studies on Transport Policy, 9(4), 1900–1911. https://doi.org/10.1016/j.cstp.2021.10.011
Appendix A
Table A1. ANOVA test for conventional buses.
Table A2. ANOVA test for electric buses.