
Abstract
Kolkata’s sustainability and liveability are impaired by uncontrolled emissions from vehicles that rely on traditional fossil fuels. Adoption of environment-friendly energy-efficient technologies like Electric Vehicles (EVs) is urgently required in the city. EV is a suitable option for both public and private transport. However, like other new technologies, EVs are also required to be facilitated by different enablers and drivers. Kolkata executed a pilot project of deploying 80 Electric Buses (e-bus) during 2017–2020 and is considering large-scale uptake of e-buses. The purpose of this study is to investigate the various elements that are crucial to accelerated large-scale e-bus adoption in the city. A survey of two hundred stakeholders from ten relevant entities is carried out through the statistical technique of Principal Component Analysis (PCA). The results indicate five key factors for faster e-bus adoption; (i) Successful e-bus pilot project, (ii) Setting up of an EV Accelerator Cell, (iii) Capital and operational Instruments, (iv) Publicity/Awareness Programs, and (v) Awards and Appreciation for the pilot e-bus project deployed in the city.
1. Introduction
Cities consume 75% of global energy and emit 70% of global CO2 emissions (IPCC, Citation2022; IRENA, Citation2021). In most developing country cities, transportation is the highest energy consumer with its consequent impact on the environment (IEA, Citation2016; Ram et al., Citation2022; UN-HABITAT, Citationn.d.). A large share of the transportation demand is met by public transport (primarily diesel-powered buses) in many Indian cities.
Electric vehicles (EVs) are a potential technology towards envisioning urban sustainability as they reduce fossil fuel demand, air pollution/CO2 emissions, and operation and maintenance costs, when compared to internal combustion engine (ICE) vehicles powered by petrol or diesel (Gass et al., Citation2014; Hagem et al., Citation2023; Kumar & Alok, Citation2020; Xiong et al., Citation2023). To achieve net zero emissions by 2050, EVs score better in terms of environmental and economic implications as compared to ICE vehicles (Veza et al., Citation2023). In addition, EVs have other advantages including zero tailpipe emissions, increased low-speed acceleration, and decreased interior noise and vibration (Bhatti et al., Citation2021; Buekers et al., Citation2014).
Thus, the option of replacing diesel buses with electric ones (e-buses) in Indian metropolitan cities can play a key role in addressing their high energy demand & emission issues from the transport sector. In the last decade, the e-bus technology has matured and has been adopted widely. Shenzhen in China has the world’s first and largest fully electric bus fleet of around 17,000 e-buses (Berlin et al., Citation2020). Other Chinese cities like Tianjin and Zhengzhou, also have achieved 100% of bus fleet electrification (Yiyang & Fremery, Citation2022). Large-scale e-buses have been deployed worldwide in cities including Bergen, Hamburg, London, Gothenburg, Milan, Utrecht, and many others. However, despite the technology’s potential to provide a more sustainable and cleaner environment, large-scale uptake of e-buses is still not prevalent in India. Compared to 2.3 million diesel and CNG buses, only around 4000 e-buses are currently operational on Indian roads (BS, Citation2023).
Amongst the Indian cities, Kolkata, the capital of West Bengal recently reported very high pollution levels in 2019; globally it ranked second in population-weighted annual average PM2.5 exposures (Health Effects Institute, Citation2022). PM2.5 is mostly emitted by the transport sector. The sector also contributes more than 68% of the Greenhouse Gas (GHG) emissions in the city (WB, Citation2020). Increasing transportation demand, motorization, and consequent fossil fuel consumption in the city are major contributors to these high pollution levels.
More than 60% of Kolkata’s transport demand is met by public/semi-public modes (bus, metro, taxi, and 3-wheelers) of which buses have the highest share (about 40%) (WB, Citation2020). Both Government and private buses ply in the city. The government buses are owned and operated by West Bengal Transport Corporation (WBTC). The private buses are mostly owned by individuals and they also carry a large share of bus trips in the city.
WBTC deployed a pilot e-bus project during 2017–2020, by procuring 80 e-buses for the city with the financial support of the Faster Adoption and Manufacturing of Hybrid and Electric Vehicles (FAME) 1 subsidy by the Government of India (GOI) and is considering a large-scale uptake of the e-buses with FAME subsidy. Similar to adopting e-buses in the public bus fleet, introducing them in the private bus segment will further curb the energy demand and subsequent emissions from the transport sector in the city. In June 2021, West Bengal released its EV Policy (WB EV Policy, Citation2021) focusing on an expedited uptake of EVs in both public and private transport segments. However, immediate actions and enablers are needed for the EV Policy’s rapid implementation and a quicker switch to EVs. Drivers leading to accelerated e-bus adoption in Kolkata need to be identified and addressed urgently. Such focused analysis on the drivers and parameters for faster adoption of electric mobility in the public transport segment in Kolkata has not been carried out earlier.
Researchers have recently investigated a range of determinants and facilitators to facilitate the rapid adoption of electric vehicles; most of these studies have focused on industrialized nations. The studies focusing on India and other developing countries have mostly focused on drivers for promoting EV adoption in the country as a whole; few studies have focused on the drivers in developing countries’ urban contexts (Inci et al., Citation2022; Palit et al., Citation2022).
In this context, this study is carried out. It aims to identify and analyze the key drivers for e-bus uptake in Kolkata by WBTC and focuses on two segments: (a) drivers for the uptake of pilot e-bus project (80 e-buses which are already operating in the city) in Kolkata and (b) accelerated large-scale uptake of e-buses in the city. The research also examines the respective importance/contributions of all the identified drivers. An opinion survey (Delphi method) and Principal Component Analysis (PCA) technique are adopted to carry out the task.
It is envisaged that the results of the study will facilitate policymakers to adopt measures resulting in faster deployment of e-buses in Kolkata, thereby resulting in reductions in fossil fuel demand and vehicular pollution in the city. The research includes inputs and validation of experienced policymakers, academicians, manufacturers, and other relevant experts. The study framework can also be extended to other national and international cities with required modifications according to their geographical coordinates, governance structure, constraints, and challenges and it will be helpful for them to strategize measures for accelerated adoption of e-buses.
2. Literature review
This section includes the current e-bus scenario in Kolkata, a comprehensive review of the literature on key drivers of e-bus adoption worldwide, and the research gaps.
2.1. Current e-bus scenario in Kolkata
WBTC adopted a pilot e-bus project in the public transport segment in Kolkata during 2017–2020 where 80 e-buses were procured with FAME subsidy. The Department of Heavy Industries (DHI) of the Government of India provides financial support under their FAME program. This subsidy enabled Kolkata to carry out one of the country’s first significant pilot e-bus initiatives. All these 80 buses are successfully operating in the city. They are charged using charging stations installed in the bus depots.
In recent times, WBTC has been considering large-scale e-bus procurement in OPEX mode with support from the FAME II program. In addition to WBTC-run buses, a large number of privately-owned diesel buses also operate in the city and e-bus uptake by them is negligible. Shifting these private buses to e-buses will lead to savings in fossil fuel and emissions.
2.2. Key drivers for the successful adoption of e-buses worldwide
Literature available on various drivers for global e-bus adoption is reviewed which indicates that faster deployment of e-bus encompasses several enablers; e-bus deployment worldwide has been driven by more than 30 factors. The key factors identified in various studies on the driving forces behind EV adoption include (a) adequate charging infrastructure and favourable government policies, (b) innovations in the electric mobility technology and charging systems, (c) financial and fiscal incentives for EV adoption, and (d) Awareness generation on EVs, environmental consciousness and pride in EV ownership (Aasness & Odeck, Citation2023; Austmann, Citation2021; Carley et al., Citation2013; Choi et al., Citation2022; Coffman et al., Citation2017; Ghosh & Bhaduri, Citation2023; Guno et al., Citation2021; Hagem et al., Citation2023; Helveston et al., Citation2015; Inci et al., Citation2022; Jenn et al., Citation2018; Liao et al., Citation2017; Melander et al., Citation2022; Sierzchula, Citation2014; Xiong et al., Citation2023; Zhang et al., Citation2016).
To achieve the goal of EV adoption for clean public transport systems, Kumar et al. (Citation2023) compared the adoption of EVs in the Global North and South and recommended that the following critical areas warrant immediate action: the success of pilot projects; the development of technical infrastructure; the availability of financial resources; the improvement of consumer perceptions towards EVs; and the policies and plans by the local and national government. According to Rohilla et al. (Citation2024), wealthier nations have embraced electric vehicles (EVs) significantly more quickly than developing ones, especially when it comes to well-designed charging infrastructure and financial incentives from the government. According to Tarei et al. (Citation2021), performance and range, the overall cost of ownership, a lack of infrastructure for charging, and a lack of customer knowledge about EV technology are the main obstacles to EV adoption in India. According to empirical data, the EV market was strongly correlated with institutional isomorphism brought up by legitimacy (Khatua et al., Citation2023).
For easier comprehension and representation, many authors while conducting driver/barrier analysis, have classified them (like policy, technology, finance, awareness, cultural, social, etc.) where the number of drivers/barriers are many (Seetharaman et al., Citation2019). Thereby, in this study, the e-bus drivers identified through the comprehensive literature review are broadly classified into four categories, which include (a) policy and regulatory, (b) technical, (c) financial and economic, and (d) informational/social/cultural ().
Table 1. Drivers for electric bus adoption.
2.3. Research gaps
The global automotive sector is currently undergoing a paradigm transition from ICE vehicles to a technology-ready, economically viable, and cleaner option of electric mobility (EV) resulting in savings in fossil fuel demand and GHG emissions (Haddadian et al., Citation2015; Liu et al., Citation2017). Drivers and enablers of adopting EVs have become a key topic for researchers worldwide.
However, studies specifically focusing on drivers for faster EV uptake in the public transport segment (e-buses) are predominantly carried out from the developed country perspective (Kumar & Alok, Citation2020). Research in the emerging economies mostly focuses on EV enablers adoption in the entire transport sector [public (bus), semi-public (cabs/3 wheelers) and private transport (cars, 2 wheelers) and not particularly on the public transport segment (Dixit & Singh, Citation2022; Pandita et al., Citation2022; Tarei et al., Citation2021). However, the enablers for expedited EV adoption in public transport might be completely different than those for semi-public or private transport segments. Furthermore, a thorough examination of the requirements for implementing electric transportation, particularly in the public transport segment in Kolkata has not been explored.
Considering diesel-driven buses cater to a major share of transportation demand in Kolkata leading to vehicular pollution from fossil fuel, replacing diesel buses with e-buses is needed in the city urgently. It may be noted that despite favourable policies (WB EV Policy, Citation2021) and financial incentives (FAME program), uptake of e-buses has been slow in the city, indicating the requirement of additional drivers and enablers for pushing the technology faster. Identifying such initiatives is imperative for its enhanced accelerated and successful adoption.
With this background, this study envisages identifying the key drivers and enablers that will facilitate a successful and accelerated e-bus uptake in Kolkata.
3. Research methodology
Identification and analysis of the key factors and their respective contributions in the pilot e-bus project in Kolkata and its large-scale accelerated uptake in the city are determined through the following steps:
Step 1: formulation of key drivers for both the pilot e-bus project in Kolkata by WBTC and its large-scale accelerated uptake and their validation by experts. The survey questionnaire is developed based on these drives.
Step 2: opinion survey of 280 stakeholders.
Step 3: statistical analysis of data gathered from the survey to determine the crucial factors, their contributing drivers, and respective contributions for the uptake of pilot e-bus project in Kolkata and large-scale accelerated uptake of e-buses in the city.
3.1. Step 1: Formulation of drivers of pilot and accelerated e-bus uptake in Kolkata
At the outset, the potential drivers for both the pilot e-bus project in Kolkata and its large-scale accelerated uptake in the city are formulated by the author based on (i) the literature review on the adoption of e-buses, (ii) secondary data, and (iii) consultation with relevant stakeholders including experience of WBTC officials wrt deployment of the pilot project of eighty e-buses in Kolkata. These identified drivers are then validated, refined, and ascertained by 20 experts (policymakers, sector specialists, and other relevant stakeholders with at least 15–20 years of experience in the subject). The drivers are included in and .
Table 2. Drivers for pilot e-bus project in Kolkata.
Table 3. Drivers for accelerated uptake of e-bus in Kolkata.
Based on these drivers, Questionnaires for the opinion survey are developed.
3.2. Step 2: Opinion survey
This study is based on inputs from 280 pertinent stakeholders representing government, private, academician, legal/media, and NGOs. Before finalizing the most suitable survey method for this study, a review of the different options is undertaken. The various types include the Delphi Method (Questionnaire Survey), Interview (through long discussions, not formal questionnaires), Meta-analysis (Big data reqd, not suitable in this study), Observation-based (validation required), Optimization techniques (linear programming, the objective of the study is not optimization, but identifying the key enablers), secondary data analysis (literature review basis), Simulation-based (not applicable for this type of analysis). A Survey-based method is robust and most popular for these types of studies (Helveston et al., Citation2015; Kumar & Alok, Citation2020). Thereby, after a detailed review, the Delphi method is adopted for the Opinion Survey in this analysis. The advantages of the Delphi method include (a) enables aggregated opinions from a diverse set of experts/stakeholders, (b) bringing everyone together for a physical meeting is not required, (c) respondents have the option of being anonymous without having to worry about repercussions, and (d) effective method for reaching consensus.
Delphi is a process of arriving at a group opinion or decision by surveying a panel of experts (minimum of 30 respondents). It is a series of questions leading to developing ideas around an issue. The strength of the agreements is measured through a rating scale. Most commonly, Likert scales between 4- and 7-points are used for answering the questions (Involve, Citation2023; Typeform, Citation2023). In this study, a 5-point Likert scale is adopted; respondents are requested to rank the relevance of the survey questions with severity between 1 and 5. Two hundred and eighty pertinent stakeholders from business and governmental institutions in Kolkata and other cities working in the transportation, energy, and environment sectors and common citizens are identified for the survey. displays the profile of the survey participants.
Table 4. Share of respondents.
The questionnaire was sent to the 280-survey audience and were asked to rank the relevance of each of the drivers on the 5-point Likert scale. Two hundred and thirty-two of them responded. After cleaning the outliers and incomplete responses two hundred responses were found to be thorough and suitable for the analysis ().
Table 5. Survey respondents of Delphi survey.
3.3. Step 3: Statistical analysis of Delphi survey data
A review of the available literature on different methods adopted by authors for analyzing the drivers of EV adoption includes Principal Component Analysis (PCA), 2-tuple linguistic method, decision-making trial and evaluation laboratory (DEMATEL) for prioritizing the critical factors, DEMATEL-ISM method, innovation diffusion theory, SWOT analysis, Analytical Hierarchy Process (AHP) and others (Palit et al., Citation2022). Amongst these, the analytical tool of PCA is particularly useful when variables are multi-collinear in a big data set as PCA transforms several possibly correlated variables in a large data set into fewer variables known as primary (principal) components or factors (Adewumi, Citation2019; Palit et al., Citation2022). Hence, PCA has been chosen for this study.
The Statistical Package for Social Sciences (SPSS, Version 20) is used for analyzing the reliability of the Opinion Survey data and carrying out the PCA. Developed by IBM, SPSS is a statistical software that is extensively used for advanced analytics.
After receiving the responses from the Delphi Survey regarding the various drivers of both pilot e-bus projects and their accelerated uptake, the data is first subjected to the Reliability Test, and following their reliability confirmation, they are subjected to PCA for determining the key factors and their respective contributions in pilot e-bus project in Kolkata and its large-scale accelerated uptake in the city.
To confirm the survey data reliability, Cronbach’s Alpha, a measure of survey data consistency is calculated. According to Cronbach (Citation1951), it should have a value between 0 and 1, a higher value indicating greater internal consistency. Following its confirmation, the data is then subjected to KMO for verifying the authenticity check of survey data and then the Bartlett Test. For KMO, a recommended value of 0.500 is advised by Osei-Kyei and Chan (Citation2017). The variables have a highly significant association, as indicated by the Bartlett test of sphericity at <0.0, and qualify the data for PCA (Arokodare, 2021).
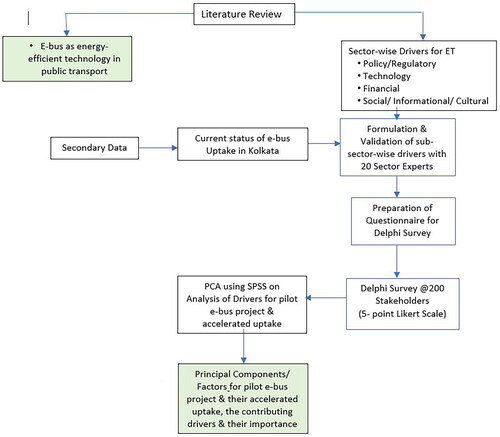
After the aforementioned assessments, PCA was performed on data on both segments using the "Dimension Reduction" function in SPSS. The Kaiser Normalization method is used in conjunction with Varimax rotation. The Cattel scree test is conducted to examine the number of components with eigenvalues >1 (graphically represented by scree plots) and their share of accounting of total variance. In this study, these indicate the number of key factors. The Rotated Component Matrix incorporates highly correlated variables under each factor and indicates contributing variables within each of them. This is followed by the Regression Analysis and the key elements/factors and the contributing drivers are then arranged in order of significance (according to the beta coefficient value derived from regression analysis). Thus, the factors, contributing drivers, and their level of contribution are determined for both the pilot e-bus project and its accelerated uptake in Kolkata. presents the statistical analysis framework of the Delphi Survey Data and presents the research methodology.
Figure 1. Statistical analysis framework of the Delphi survey data.
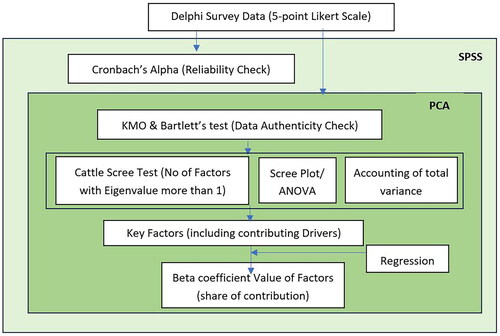
Figure 2. Research methodology.
4. Results
Results of the statistical analysis of both segments (pilot e-bus project and large-scale accelerated uptake of e-buses in Kolkata by WBTC) are included below.
4.1. Reliability test
Cronbach’s alpha values for both segments are >0.7 (), showing good response, consistency, data reliability, and the suitability of the five-point Likert scale approach used in the analysis.
Table 6. Cronbach’s alpha and KMO values generated in the study.
4.2. KMO and Bartlett’s test
The KMO value for both segments exceeds the minimum recommended value of 0.500 (). Furthermore, both segments’ results are statistically significant for Bartlett’s test of sphericity at 0.000, indicating that the correlation is factorable. Hence, the Delphi survey data is deemed appropriate for running PCA to identify the key factors of e-bus deployment in Kolkata.
4.3. PCA
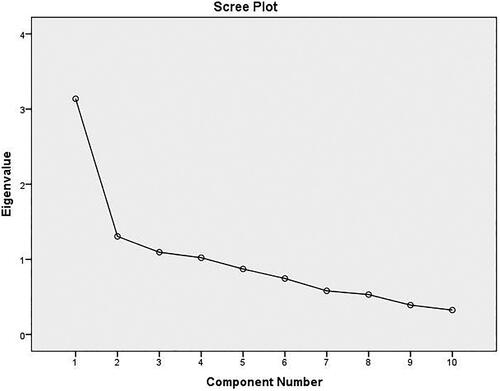
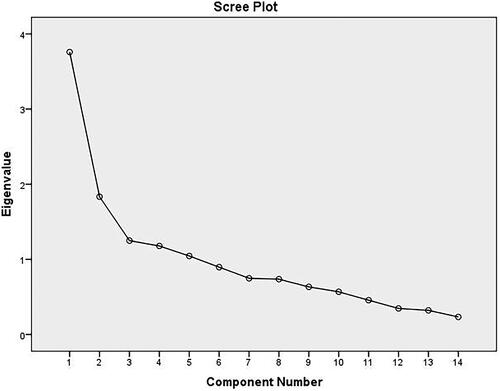
Using the Delphi survey data, the PCA and Cattel Scree tests were performed for both segments using the Varimax rotation with the Kaiser Normalization procedure. The number of factors with an eigenvalue more than one, i.e. the number of factors influencing pilot e-bus project is 4 and that for accelerated uptake of e-buses is 5.
PCA results for the pilot e-bus project including (a) Variance, (b) Rotated Component Matrix, and (c) beta coefficient values (importance levels of factors) are presented in . The Scree Plot is presented in . PCA results for the accelerated e-bus uptake including (a) Variance, (b) Rotated Component Matrix, and (c) beta coefficient values (importance levels of factors) are presented in . The Scree Plot is presented in .
Table 7. Variance explanation—analysis of drivers of for pilot e-bus project.
Table 8. Rotated component matrix—pilot e-bus project.
Table 9. Coefficients—pilot e-bus project.
Table 10. Variance explanation—analysis of drivers of accelerated uptake of e-buses.
Table 11. Rotated component matrix—accelerated uptake of e-buses.
Table 12. Coefficients—accelerated uptake of e-buses.
Key Factors & their contributing drivers and for both pilot e-bus project uptake and the accelerated e-bus uptake are given in in Section 4.4.
Table 13. Factors, contribution and contributing drivers of e-bus uptake.
4.3.1. Results—scree plots, variance, rotated component matrix, and beta co-efficient values—pilot e-bus project
depicts the scree plot generated using PCA for the pilot e-bus project, which shows that four components that account for 65% of the total variance have eigenvalues >1. The weighting of these four components ranges from 12 to 18% ().
Figure 3. Scree plot—analysis of drivers for pilot e-bus project.
Source: PCA, SPSS.
The contributing drivers of the respective factors are presented in .
represents the contribution or importance of each of the factors.
4.3.2. Results—scree plots, rotated component matrix, and beta co-efficient values—accelerated uptake of e-buses
The scree plot derived by PCA for an accelerated e-bus project in Kolkata is presented in . It shows that five Components that account for 65% of the total variance have eigenvalues >1. The weighting of these four components ranges from 10 to 17% ().
Figure 4. Scree plot—analysis of drivers for accelerated uptake of e-buses.
Source: PCA, SPSS.
The contributing drivers of the respective factors are presented in .
represents the contribution or importance of each of the factors.
4.4. Results on the principal components/factors extracted from PCA
The analysis indicates that the drivers for both the segments (pilot e-bus project and accelerated e-bus uptake) that were finalized in discussion with sector experts are distributed among various factors. Those factors having eigenvalues more than 1 are considered as having significant importance and contribution to e-bus uptake. These factors in both segments include a mix of policy/regulatory, technological, financial/economic, and social/informational/cultural drivers. Each of the factors focuses on a distinct theme.
A summary of the factors, their contributing drivers, and beta co-efficient value (contribution in the uptake) for both existing status and accelerated uptake of e-bus technology in Kolkata is presented in . They are presented in terms of descending order of importance (also drivers within each factor are indicated in their descending order of importance).
The major factors, drivers, and points drawn from the above analysis of the pilot e-bus project indicate the following:
Factor 1—Local Champion and& STK Coordination: with the highest beta coefficient value (0.492), this is the most important factor in the pilot e-bus project of the uptake of 80 bus deployments in Kolkata in 2017. The initiative, perseverance and push by the Local Champion, preparation of the Feasibility Study on E-bus potential in the city, and necessary stakeholder Coordination by WBTC are the contributing drivers for the pilot project.
Factor 2—Financial Support from Government: the second key factor leading to the pilot e-bus project in Kolkata is the financial support from the FAME Grant (50% of project cost) and the West Bengal Government Dept agreeing to pay the balance 50%.
Factor 3—Potential Savings: awareness of potential fuel savings, lower O&M Expenses, Lower Investment (due to FAME subsidy), and the lower TOD tariff for night charging are identified as the key factors (beta coefficient value of 0.410) in the uptake of pilot e-bus project.
Factor 4—EV OEMs and after-sales service: with the contribution of 0.249, this is the fourth most important factor for the pilot e-bus project. The contributing drivers include the availability of different variants/models of e-bus from multiple manufacturers (OEMs), offering maintenance/service, and repair facilities. Considering e-bus technology was at a nascent stage in 2017, these facilities by OEMs played a major role in its uptake.
The major factors derived from the analysis for the accelerated uptake of e-bus technology in Kolkata are as under:
Factor 1—Successful pilot (highest beta coefficient value of 0.457): The satisfactory performance of the pilot e-bus project, ease of uptake of the technology, the demonstrated energy (fuel) savings, and cost savings (O&M cost cheaper than diesel buses) came out as the most important drivers for accelerated uptake of e-buses in Kolkata
Factor 2—EV Accelerator Cell: The quick carrying out of the WB EV policy and the creation of a “Govt EV Accelerator Cell” are the second-most significant factors contributing to Kolkata’s faster adoption of e-buses. The beta coefficient value of these factors is 0.449. The key responsibilities of the EV accelerator Cell towards promoting e-buses in the city include setting up charging infrastructure in bus depots, training relevant stakeholders in WBTC on e-bus technology, and coordinating with the Private e-bus operators towards shifting diesel-run buses to e-buses.
Factor 3—Capital and Operational Instruments (beta co-efficient value of 0.404): various drivers like minimal financial implications and no upfront investment due to the purchase of e-buses under OPEX model of FAME II, adequate financial incentives and financing options for the private bus operators for adopting e-bus technology, Road Tax/Registration Fee Exemptions will help faster e-bus adoption.
Factor 4—Intensive Publicity/Awareness Programs (beta co-efficient value of 0.330): Awareness Generation in TV, print, and social media about the benefits of e-buses, their techno-economic feasibility, and savings from the pilot e-bus project, awareness about e-bus success in cities worldwide are extremely important for increased knowledge and removal of uncertainties about e-buses.
Factor 5—Awards and Appreciation (beta co-efficient value of 0.105): International Awards received by Kolkata for India’s first successful e-bus pilot and appreciation by the citizens of Kolkata regarding greener, comfortable, environment-friendly rides by e-buses are also identified as important drivers for accelerated uptake of e-buses in the city
This analysis indicates the key factors, their contributing drivers, and the level of importance for both pilot e-bus projects and accelerated uptake of e-buses. For an accelerated and successful large-scale adoption of e-buses, all relevant stakeholders need to collaborate and focus on the identified factors and their contributing drivers. This will lead to a sustainable, less polluting, and livable Kolkata. Along with planning for the expedited e-bus adoption, planning for their charging, especially, for the privately owned buses, will have to be worked out simultaneously.
5. Policy recommendations
The key factors for deploying the pilot e-bus project and their accelerated uptake in Kolkata as identified above by PCA in this study are included in .
Table 14. Factors for e-bus uptake in Kolkata by WBTC.
Considering the pilot e-bus project is already implemented in Kolkata, recommendations in this study focus on their accelerated large-scale uptake. Few policy instruments facilitating the deployment of e-buses are already in place and a few more are proposed for their accelerated uptake in the city.
Owing to the high investment cost of e-buses and charging stations, organizing the capital cost is key to its large-scale uptake. The existing fiscal instruments available for e-buses are crucial for enhancing their uptake. In fact, as indicated in , financial support (FAME subsidy) and fiscal instruments from the government are identified as key factors for promoting both pilot e-bus projects and their accelerated uptake. However, the subsidy may not continue forever. Creating new business models and financial products for e-buses through collaboration by financers, non-banking finance companies (NBFCs) and other banking institutions is important, especially, for the private e-bus operators/owners, to address the hurdles of high initial capital cost. For the near future, instruments of FAME subsidy, lower electricity tariff for charging, etc. to be continued/extended and additional instruments for e-buses like reduced vehicle registration costs, lower interest rates in vehicle loans, and toll & parking waivers be introduced.
The EV Policy of West Bengal announced in 2021 has not yet been implemented fully. The key mandates of the Policy like the installation of an EV accelerator cell and equipment for charging infrastructure and capacity building of all relevant stakeholders, need to be implemented urgently. The EV Accelerator Cell has a key role to play in accelerated EV deployment in the state in both public and private transport segments and may be housed at the Transport or Power Department.
Citywide charging options, particularly on the e-bus routes, are a prerequisite before expecting private e-bus operators to convert their diesel-run private buses to e-buses. In India, charging stations are set up by power utilities, EV manufacturers, independent charging station operators, vehicle manufacturers/fleet operators, location owners/real estate, and public authorities. As per the amendment in the Electricity Act 2003 by the Ministry of Power, electric vehicle charging is designated as a “service” and no licensing is needed for operating a charging station. Hence, setting up a charging infrastructure network for facilitating the private bus operators across Kolkata should not be a challenge and to be considered a top priority.
Policy/programs on Intense Publicity/Awareness Programs and training of e-bus operators/drivers/other stakeholders (particularly the private diesel bus operators) on all aspects of e-buses are the need of the hour. A platform for convening private bus operators may be formulated and capacity building on topics including e-bus financing options, e-bus products & manufacturers, and after-sales services to be carried out for them. Results on savings in fuel cost and O&M costs from the WBTC pilot project (80 e-buses) need to be disseminated to them urgently. The private diesel bus operators will also need skill development & training in operating & maintaining e-buses.
Moreover, the e-buses will contribute to GHG reduction only if the electricity for their charging is generated from renewable sources of energy. Amongst the different RE options, solar is the most feasible option in Kolkata. To start with, the options of installing solar power in the bus depots can be considered.
With this background, the following recommendations are suggested for accelerating large-scale e-bus uptake in the city:
Continue existing capital and operational instruments and also explore new financial mechanisms to address procurement cost of e-buses/charging stations
EV Accelerator Cell proposed in WB EV Policy, Citation2021 be formulated at the earliest and they need to urgently focus on the following:
Policy roadmap and action plan for setting up citywide charging infrastructure
Bring Private Bus Operators on a common platform and coordinate with them regarding shifting diesel-run buses to e-buses
Collaborate with e-bus manufacturers and undertake Intensive Publicity/Awareness Programs/Training/skill development for relevant stakeholders in the e-bus ecosystem
Examine options for e-bus recharging with solar power. Rooftops of bus depots and tram depots may be used for solar power generation,
6. Conclusions
About 25% of the energy-related CO2 emissions in the world are emitted by the transportation sector (Choi et al., Citation2022). Faster adoption of e-bus technology with zero tailpipe emissions has the potential to achieve improved air quality, and climate benefits, putting cities on track towards sustainability and contributing to achieving net zero. However, despite the promises, the adoption of e-buses has not accelerated fast enough in Indian cities. Kolkata is no exception—although WBTC adopted a pilot e-bus project during 2017–2019 in the city and working on its large-scale uptake, 100% of the large number of private buses are still running on diesel. The predominant barriers and challenges include:
The high initial capital cost of e-buses: The pilot project of 80 e-buses and its subsequent large-scale e-bus project by WBTC are government-owned buses. Their procurement cost is met by state funds and both these initiatives are also recipients of the Centre’s FAME subsidy. However, the city also has many privately-owned diesel bus operators carrying a large share of bus trips. For them, the high upfront cost of replacing their diesel buses with e-buses is a big challenge. Since these private buses are mostly owned by individuals, the high capital cost of e-buses and the incumbent compliance of the OPEX model of FAME 2 remain a major deterrent for replacing their diesel buses with e-buses.
Lack of Public Charging Infrastructure: In the case of the government-run e-buses, WBTC has set up the charging infrastructure—they procured and installed the required charging stations in their bus depots across the city for use by their e-bus fleets throughout the day. However, this infrastructure will not be available for the privately owned e-buses. Considering charging stations of e-buses are very cost-intensive (unlike smaller-sized EVs like cars and 2/3 wheelers), their procurement and maintenance are not financially feasible options for the individual owners of the private buses. Also, the buses ply for long ranges and need to be recharged during the day which will not be possible without the availability of a charging network sprawling across the city.
Poor awareness and know-how on benefits of e-buses, e-bus driving, and the maintenance ecosystem: Compared to conventional diesel buses, e-bus is a new technology and the private bus operators lack knowledge of plying and maintaining them. Also, they are not aware of the information on the savings in diesel and O&M costs from the WBTC pilot project (80 e-buses).
Also, while executing the pilot e-bus project, the relevant WBTC officials and their e-bus drivers received training from the e-bus manufacturer on all aspects of the technology. Similar training for the privately-run e-bus stakeholders and also, focussed awareness generation activities to alert and educate them on various aspects of e-bus technology are lacking. A platform for convening private bus operators to negotiate on e-buses is missing.
Current use of non-renewable energy for battery charging: Attainment of emission reduction from bus transport is difficult with the transition to EV alone. The e-buses will lead to substantial GHG reduction only if they use RE-powered charging, e.g. Hydropower, Solar Power, Wind Power, and others. Currently, the RE share in West Bengal’s electricity generation is only 2%.
This study focuses on the drivers/enablers of e-bus uptake in Kolkata for two scenarios: (a) the pilot project of 80 e-buses and (b) their large-scale uptake by WBTC. More than 200 relevant stakeholders including WBTC officials, Policy Makers, e-bus manufacturers, and others were interviewed and Principal Component Analysis (PCA) of the survey data was carried out to identify the key factors for the uptake of e-buses. PCA extracted the drivers into factors having distinct themes. Each theme includes a combination of policy/regulatory, technological, financial/economic, and social/informational/cultural factors. Such an analysis for the public transport segment in Kolkata is carried out for the first time. Policy recommendations are suggested based on the key barriers/challenges of e-bus uptake and the drivers/enablers of large-scale e-bus deployment as determined in this study.
6.1. Key takeaways
This study is carried out in a particular backdrop where first, a pilot project of procuring and operating 80 e-buses in the city of Kolkata has already been undertaken during 2017-19 by WBTC, the state transport undertaking in West Bengal, which, is now planning a large-scale deployment of the e-buses in the city. Considering the research is based on an implemented on-ground project and not a hypothetical one, with inputs from key stakeholders, both national and international cities can draw lessons from the study.
A city-level designated nodal body on EV can suitably facilitate the uptake of the new e-bus technology. For cities planning to deploy e-buses for the first time, a pilot of 60-100 such e-buses is undertaken first and their performances (electricity consumption/charge, range/charge, O&M costs, and battery performance) are monitored for a certain period and disseminated to relevant stakeholders. Upon satisfactory performance of the pilot, their large-scale uptake may be considered. Financial mechanisms and fiscal support from the Government (subsidy towards investment cost, lower electricity tariff, waiver of registration charges, loan at lower interest, and others) will boost their uptake, especially if the buses are owned by private operators. Citywide charging networks (bus depots and along/near bus routes) are mandatory before procurement and operation of e-buses. Skill development/training of relevant stakeholders on the technology and Intensive Publicity/Awareness Programs (about O&M savings and other benefits, e-bus purchase protocols and available financial instruments, their worldwide success, and other topics) are extremely important for increased knowledge and removal of uncertainties about e-buses. Awards & appreciation of cities adopting large-scale e-bus deployment will also encourage their faster uptake in other cities.
An assessment of the global efforts to reach net-zero carbon emissions by 2050 indicates that the various measures in electricity, industry, buildings, transport, and others are failing in almost every way, except the fast induction of EVs (Bezos Earth Fund et al., Climate Action Tracker, United Nations). In India, the promotion of EVs is one of the actions undertaken by GOI to achieve Net-Zero emission targets in the transport sector. Thereby, this study is envisaged to facilitate other national and international cities towards accelerated uptake of e-buses, thereby striving for energy & emission savings and contributing to their efforts to net zero.
7. Limitations of the study and scope of further research
In Kolkata and other Indian cities, it is vital to reduce transportation-related fossil fuel usage and the resulting emissions by switching to energy-efficient choices like e-buses. This study facilitates and enables policymakers to make an informed decision regarding deploying e-buses at an enhanced rate in Kolkata.
Nonetheless, despite its innovativeness and meaningful contributions, there are limitations. It only addresses the deployment of EVs in the public transport sector. Examining the factors that encourage and facilitate increased use of EV technology in the private transportation sector (cars, two-wheelers, and three-wheelers) is vital given the rising energy consumption and ensuing emissions from the transportation sector. In addition, the feasibility of other energy-efficient environment-friendly bus technologies like Fuel Cells and green Hydrogen may be taken up for further research.
Disclosure statement
No potential conflict of interest was reported by the author(s).
References
- Aasness, M. A., & Odeck, J. (2023). Road users’ attitudes towards electric vehicle incentives: Empirical evidence from Oslo in 2014–2020. Research in Transportation Economics, 97, 1. https://doi.org/10.1016/j.retrec.2023.101262
- Adewumi, 2019: Understanding the Role of Eigenvectors and Eigenvalues in PCA Dimensionality Reduction, https://medium.com/@dareyadewumi650/understanding-the-role-of-eigenvectors-and-eigenvalues-in-pca-dimensionality-reduction-10186dad0c5c
- Adhikari, M., Ghimire, L. P., Kim, Y., Aryal, P., & Khadka, S. B. (2020). Identification and analysis of barriers against electric vehicle use. Sustainability, 12(12), 4850. https://doi.org/10.3390/su12124850
- Almansour, M. (2022). Electric vehicles (EV) and sustainability: Consumer response to twin transition, the role of e-businesses and digital marketing. Technology in Society, 71, 102135. https://doi.org/10.1016/j.techsoc.2022.102135
- Arokodare, M. A. (2020). The moderating effect of environmental turbulence on the strategic agility-performance relationship: Empirical evidence from Lagos State, Nigeria. Business and Management Research, 10(1), 1. https://doi.org/10.5430/bmr.v10n1p1
- Austmann, M. (2021). Drivers of the electric vehicle market: A systematic literature review of empirical studies. Finance Research Letters, 41, 101846. https://doi.org/10.1016/j.frl.2020.101846
- Avenali, A., Catalano, G., Giagnorio, M., & Matteucci, G. (2023). Assessing the cost-effectiveness of alternative bus technologies: Evidence from US transit agencies. Transportation Research Part D: Transport and Environment, 117(4), 103648. https://doi.org/10.1016/j.trd.2023.103648
- Berlin, A., Zhang, X., & Chen, Y. (2020). Electric buses in Shenzhen, China 2020. https://iea.blob.core.windows.net/assets/db408b53-276c-47d6-8b05-52e53b1208e1/e-bus-case-study-Shenzhen.pdf
- Bhatti, I., Mohan, H., & Singh, R. R. (2021). Towards the future of smart electric vehicles: Digital twin technology. Renewable and Sustainable Energy Reviews, 141, 110801. https://doi.org/10.1016/j.rser.2021.110801
- Bryła, P., Chatterjee, S., & Ciabiada-Bryła, B. (2022). Consumer adoption of electric vehicles: A systematic literature review. Energies, 16(1), 205. https://doi.org/10.3390/en16010205
- BS (2023). https://www.business-standard.com/industry/auto/fame-iii-india-to-replace-800k-diesel-buses-with-electric-over-7-years-123122900244_1.html
- Buekers, J., Van Holderbeke, M., Bierkens, J., & Panis, L. I. (2014). Health and environmental benefits related to electric vehicle introduction in EU countries. Transportation Research Part D: Transport and Environment, 33(2014), 26–28. https://doi.org/10.1016/j.trd.2014.09.002
- Carley, S., Krause, R. M., Lane, B. W., & Graham, J. D. (2013). Intent to purchase a plug-in electric vehicle: A survey of early impressions in large US cites. Transportation Research Part D: Transport and Environment, 18, 39–45. https://doi.org/10.1016/j.trd.2012.09.007
- Choi, S., Kwak, K., Yang, S., Lim, S., & Woo, J. (2022). Effects of policy instruments on electric scooter adoption in Jakarta, Indonesia: A discrete choice experiment approach. Economic Analysis and Policy, 76, 373–384. https://doi.org/10.1016/j.eap.2022.08.015
- Coffman, M., Bernstein, P., & Wee, S. (2017). Electric vehicles revisited: A review of factors that affect adoption. Transport Reviews, 37(1), 79–93. https://doi.org/10.1080/01441647.2016.1217282
- Costa, E., Horta, A., Correia, A., Seixas, J., Costa, G., & Sperling, D. (2020). Diffusion of electric vehicles in Brazil from the stakeholders’ perspective. International Journal of Sustainable Transportation, 15(11), 865–878. https://doi.org/10.1080/15568318.2020.1827317
- Cronbach, L. J. (1951). Coefficient alpha and the internal structure of tests. Psychometrika, 16(3), 297–334. https://doi.org/10.1007/BF02310555
- Das, P. K., & Bhat, M. Y. (2022). Global electric vehicle adoption: Implementation and policy implications for India. Environmental Science and Pollution Research International, 29(27), 40612–40622. https://doi.org/10.1007/s11356-021-18211-w
- Dixit, S. K., & Singh, A. K. (2022). Predicting electric vehicle (EV) buyers in India: A machine learning approach. Rev Socionetwork Strateg. 2022; 16(2): 221–238, https://www.ncbi.nlm.nih.gov/pmc/articles/PMC9116061/
- Gass, V., Schmidt, J., & Schmid, E. (2014). Analysis of alternative policy instruments to promote electric vehicles in Austria. Renewable Energy, 61, 96–101. https://doi.org/10.1016/j.renene.2012.08.012
- Ghosh, A. M., & Bhaduri, S. (2023). Identifying drivers for energy transition in transport sector in Kolkata through faster adoption of electric mobility. European Chemical Bulletin, 12(5), 882–902.
- Gonçalves, D. N. S., Goes, G. V., D’Agosto, M. A., & La Rovere, E. L. (2022). Development of policy-relevant dialogues on barriers and enablers for the transition to low-carbon mobility in Brazil. Sustainability, 14(24), 16405. https://doi.org/10.3390/su142416405
- Guno, C. S., Collera, A. A., & Agaton, C. B. (2021). Barriers and drivers of transition to sustainable public transport in the Philippines. World Electric Vehicle Journal, 12(1), 46. https://doi.org/10.3390/wevj12010046
- Haddadian, G., Khodayar, M., & Shahidehpour, M. (2015). Accelerating the global adoption of electric vehicles: Barriers and drivers. The Electricity Journal, 28(10), 53–68. https://doi.org/10.1016/j.tej.2015.11.011
- Hagem, C., Kverndokk, S., Nævdal, E., & Einar Rosendahl, K. (2023). Policies for electrification of cars in the short and long run. Transportation Research Part D: Transport and Environment, 117, 103606. https://doi.org/10.1016/j.trd.2023.103606
- Health Effects Institute (2022). Air quality and health in cities: A state of global air report 2022. Author.
- Helveston, J. P., Liu, Y., Feit, E. M., Fuchs, E., Klampfl, E., & Michalek, J. J. (2015). Will subsidies drive electric vehicle adoption? Measuring consumer preferences in the U.S. and China. Transportation Research Part A: Policy and Practice, 73, 96–112. https://doi.org/10.1016/j.tra.2015.01.002
- Hensher, D. A. H. (2021). The case for negotiated contracts under the transition to a green bus fleet. Transportation Research Part A: Policy and Practice, 154(4), 255–269. https://doi.org/10.1016/j.tra.2021.10.006
- IEA, 2016: Cities are at the frontline of the energy transition https://www.iea.org/news/cities-are-at-the-frontline-of-the-energy-transition
- Inci, E., Tatar Taspinar, Z., & Ulengin, B. (2022). A choice experiment on preferences for electric and hybrid cars in Istanbul. Transportation Research Part D: Transport and Environment, 107, 103295. https://doi.org/10.1016/j.trd.2022.103295
- Involve, 2023: https://www.involve.org.uk/resource/delphi-
- IPCC (2022). https://www.ipcc.ch/report/ar6/wg3/downloads/report/IPCC_AR6_WGIII_SPM.pdf
- IRENA (2021). How cities can take action to drive the energy transition. https://www.irena.org/News/articles/2021/May/How-Cities-Can-Take-Action-to-Drive-the-Energy-Transition
- Jenn, A., Springel, K., & Gopal, A. R. (2018). Effectiveness of electric vehicle incentives in the United States. Energy Policy, 119, 349–356. https://doi.org/10.1016/j.enpol.2018.04.065
- Khatua, A., Ranjan Kumar, R., & Kumar De, S. (2023). Institutional enablers of electric vehicle market: Evidence from 30 countries. Transportation Research Part A: Policy and Practice, 170, 103612. https://doi.org/10.1016/j.tra.2023.103612
- Kongklaew, C., Phoungthong, K., Prabpayak, C., Chowdhury, M. S., Khan, I., Yuangyai, N., Yuangyai, C., & Techato, K. (2021). Barriers to electric vehicle adoption in Thailand. Sustainability, 13(22), 12839. https://doi.org/10.3390/su132212839
- Kumar, P., Kumar, A., & Brewster, C. (2023). Investigating electric vehicles adoption in urban public transport: A socio-technical transition analysis across cities of the global north and south. Retrieved from https://ssrn.com/abstract=4493763
- Kumar, R. R., & Alok, K. (2020). Adoption of electric vehicle: A literature review and prospects for sustainability. Journal of Cleaner Production, 253(2020), 119911. https://doi.org/10.1016/j.jclepro.2019.119911
- Li, P., Jiang, M., Zhang, Y., & Zhang, Y. (2023). Cooperative optimization of bus service and charging schedules for a fast-charging battery electric bus network. IEEE Transactions on Intelligent Transportation Systems, 24(5), 5362–5375. https://doi.org/10.1109/TITS.2023.3243105
- Liao, F., Molin, E., & van Wee, B. (2017). Consumer preferences for electric vehicles: A literature review. Transport Reviews, 37(3), 252–275. https://doi.org/10.1080/01441647.2016.1230794
- Liu, H.-C., You, X.-Y., Xue, Y.-X., & Luan, X. (2017). Exploring critical factors influencing the diffusion of electric vehicles in China: A multi-stakeholder perspective. Research in Transportation Economics, 66, 46–58. https://doi.org/10.1016/j.retrec.2017.10.001
- Logan, K. G., Nelson, J. D., Chapman, J. D., Milne, J., & Hastings, A. (2023). Decarbonising UK transport: Implications for electricity generation, land use and policy. Transportation Research Interdisciplinary Perspectives, 17, 100736. https://doi.org/10.1016/j.trip.2022.100736
- Manzolli, J. A. (2020). Decision support for planning a bus rapid transit charging infrastructure [Master thesis]. University of Coimbra.
- Melander, L., Nyquist, C., Magnusson, B., & Wallström, H. (2022). Drivers for and barriers to electric freight vehicle adoption in Stockholm. Transportation Research Part D: Transport and Environment, 108, 103317. https://doi.org/10.1016/j.trd.2022.103317
- Osei-Kyei, R., & Chan, A. P. C. (2017). Factors attracting private sector investments in public-private partnerships in developing countries: A survey of international experts. Journal of Financial Management of Property and Construction, 22(1), 92–111. https://doi.org/10.1108/JFMPC-06-2016-0026
- Pagliaro, M., & Meneguzzo, F. (2019). Electric bus: A critical overview on the dawn of its widespread uptake. Advanced Sustainable Systems, 3(6), 1800151. https://doi.org/10.1002/adsu.201800151
- Palit, T., Bari, A. M., & Karmaker, C. L. (2022). An integrated principal component analysis and interpretive structural modeling approach for electric vehicle adoption decisions in sustainable transportation systems. Decision Analytics Journal, 4(2022), 100119. https://doi.org/10.1016/j.dajour.2022.100119
- Pandita, D., Bhatt, V., Kumar, V. R., & Gotise, P. (2022). A conceptual model for understanding the barriers to the adoption of electric vehicles in India. International Journal of Social Science and Economic Research, 07(08), 2544–2556. https://ijsser.org/more2022.php?id=170
- Ram, M., Gulagi, A., Aghahosseini, A., Bogdanov, D., & Breyer, C. (2022). Energy transition in megacities towards 100% renewable energy: A case for Delhi. Renewable Energy, 195, 578–589.
- Roemer, E., & Henseler, J. (2022). The dynamics of electric vehicle acceptance in corporate fleets: Evidence from Germany. Technology in Society, 68, 101938. https://doi.org/10.1016/j.techsoc.2022.101938
- Rohilla, K., Desai, A., & Patel, C. R. (2024). A cutting-edge examination of the dichotomy of electric vehicles as a symbol of “sustainable mobility” and “clean energy”. Journal of The Institution of Engineers (India): Series A, 105(1), 209–227. https://doi.org/10.1007/s40030-023-00778-x
- Say, K., Csereklyei, Z., Brown, F. G., & Wang, C. (2023). The economics of public transport electrification: A case study from Victoria, Australia. Energy Economics, 120(5), 106599. https://doi.org/10.1016/j.eneco.2023.106599
- Seetharaman, K. M., Patwa, N., Saravanan, D., & Gupta, Y. (2019). Breaking barriers in deployment of renewable energy. Heliyon, 5(1), e01166. https://doi.org/10.1016/j.heliyon.2019.e01166
- Sierzchula, W. (2014). Factors influencing fleet manager adoption of electric vehicles. Transportation Research Part D: Transport and Environment, 31, 126–134 https://doi.org/10.1016/j.trd.2014.05.022
- Tarei, P. K., Chand, P., & Gupta, H. (2021). Barriers to the adoption of electric vehicles: Evidence from India. Journal of Cleaner Production, 291(1), 125847. https://doi.org/10.1016/j.jclepro.2021.125847
- Thorne, R. J., Hovi, I. B., Figenbaum, E., Pinchasik, D. R., Amundsen, A. H., & Hagman, R. (2021). Facilitating adoption of electric buses through policy: Learnings from a trial in Norway. Energy Policy, 155, 112310. https://doi.org/10.1016/j.enpol.2021.112310
- Typeform, 2023: https://www.typeform.com/surveys/likert-scale-questionnaires/survey#:∼:text=A%20Delphi%20Survey%20is%20a,the%20responses%20given%20by%20participants
- UN-HABITAT (n.d.). https://unhabitat.org/topic/urban-energy
- Veza, I., Asy’ari, M. Z., Idris, M., Epin, V., Rizwanul Fattah, I. M., & Spraggon, M. (2023). Electric vehicle (EV) and driving towards sustainability: Comparison between EV, HEV, PHEV, and ICE vehicles to achieve net zero emissions by 2050 from EV. Alexandria Engineering Journal, 82(1), 459–467. https://doi.org/10.1016/j.aej.2023.10.020
- WB (2020). Report on ‘Estimation of base line emission load for state of West Bengal in terms of major air pollutants and CO2e’. Radical Action to West Bengal Biodiversity Board, Government of West Bengal.
- WB EV Policy (2021). https://wbpower.gov.in/wp-content/uploads/Electric%20Vehicle%20Policy%202021%20(Kolkata%20Gazette%20Notification).pdf
- Xiong, S., Yuan, Y., Yao, J., Bai, B., & Ma, X. (2023). Exploring consumer preferences for electric vehicles based on the random coefficient logit model. Energy, 263(Part A), 125504. https://doi.org/10.1016/j.energy.2022.125504
- Xu, X., Lv, X., & Han, L. (2019). Carbon asset of electrification: Valuing the transition from fossil fuel-powered buses to battery electric buses in Beijing. Sustainability, 11(10), 2749. https://doi.org/10.3390/su11102749
- Yiyang, C., & Fremery, V. (2022). E-bus development in China: From fleet electrification to refined management. https://transition-china.org/mobilityposts/e-bus-development-in-china-from-fleet-electrification-to-refined-management/
- Zhang, Y., Qian, Z., Sprei, F., & Li, B. (2016). The impact of car specifications, prices, and incentives for battery electric vehicles in Norway: Choices of heterogeneous consumers. Transportation Research Part C: Emerging Technologies, 69, 386–401. https://doi.org/10.1016/j.trc.2016.06.014