
ABSTRACT
Two paradigms were employed to disentangle information processing from executive motor inhibition in adults with Developmental Coordination Disorder (DCD). Choice Reaction and Stop Signal Tasks were compared between 13 adults fulfilling DSM-5 DCD criteria and 42 typically developing adults. Additional analyses included 16 probable DCD (pDCD) participants, who had motor difficulties but did not fulfil DSM-5 criteria. Analyses employed frequentist and Bayesian modeling. While DCD+pDCD showed slower reaction times and difficulty initiating Go responses, no impairments in Stop actions were found. These findings indicated no executive deficit in DCD, suggesting that previous results may be explained by inefficient information processing.
Introduction
Many complex everyday tasks require rapid and successful movement planning. However, changing environmental demands means that previous motor commands are often rendered incorrect or unnecessary (Picazio & Koch, Citation2015). For example, when playing team sports, such as football, the rapidly changing positions of the players and the ball can result in a previously prepared motor operation no longer being optimal. The ability to cancel this action in favor of a new optimized motor plan allows for more proficient goal-directed movement. Inhibitiory control is an executive function that allows for the successful suppression or cancellation of unwanted actions and responses, (Diamond, Citation2013) and is required for proficient and flexible goal-directed motor performance (Gálvez-García, Albayay, Rehbein, Bascour-Sandoval, & Michael, Citation2018). Poorer inhibitory control and motor difficulties have been observed in several neurodevelopmental disorders, such as Attention Deficit Hyperactivity Disorder (ADHD; Gilbert, Isaacs, Augusta, Macneil, & Mostofsky, Citation2011; Kalsi, Tambelli, Aceto, & Lai, Citation2015; Quay, Citation1997) and Autism Spectrum Disorder (Licari et al., Citation2020; Schmitt, White, Cook, Sweeney, & Mosconi, Citation2018; Xiao et al., Citation2012). Notably, one particular condition in which motor difficulties are considered the central symptom and in which inhibitory control difficulties have previously been observed (Mandich, Buckolz, & Polatajko, Citation2002) is that of Developmental Coordination Disorder (DCD, also known as Dyspraxia).
With an estimated prevalence rate of 5–6% (Blank, Smits-Engelsman, Polatajko, & Wilson, Citation2012), Developmental Coordination Disorder (DCD) is a common neurodevelopmental disorder marked by fine and gross motor difficulties. DSM-5 (American Psychological Association, Citation2013) diagnostic criteria for DCD include 1) motor skills below what would be expected given the individual’s age and opportunity to practice, 2) difficulties manifest when performing daily living activities, including writing, personal care and driving (de Oliveira & Wann, Citation2012; Huau, Velay, & Jover, Citation2015; Summers, Larkin, & Dewey, Citation2008), 3) symptom onset is early in development and 4) that the observed motor difficulties are not better explained by another neurological condition. It has been suggested that compromised inhibitory control may contribute to the poor motor skills observed in DCD, making it more challenging to cancel or supress unwanted movements during motor operations, such as driving, in which ongoing movements may need to be stopped rapidly (Bernardi, Leonard, Hill, & Henry, Citation2016; He et al., Citation2018; Tsai, Citation2009).
Inhibitory control deficits have been observed in children with DCD, (Bernardi et al., Citation2016; He et al., Citation2018; Mandich et al., Citation2002; Querne et al., Citation2008) however, the pattern of difficulties appears to be dependent upon the nature of the task used. As Leonard and Hill (Citation2015) explain, tasks that rely upon the inhibition of a motor response result in a greater error rate for participants with DCD when compared to controls (Leonard, Bernardi, Hill, & Henry, Citation2015; Rahimi-Golkhandan, Steenbergen, Piek, & Wilson, Citation2014; Thornton, Bray, Langevin, & Dewey, Citation2018). Conversely, on measures of inhibitory control that rely upon verbal responses, individuals with DCD do not make more errors than controls, but instead display significantly longer and more variable response times (Michel, Roethlisberger, Neuenschwander, & Roebers, Citation2011; Querne et al., Citation2008). Because slower information processing has also been found in DCD across audio, visual and tactile modalities (Trainor, Chang, Cairney, & Li, Citation2018; Wilson & McKenzie, Citation1998) and has not been examined in the context of a contribution to inhibitory control, it is difficult to evaluate whether an inhibitory deficit is present or whether the longer response times on verbal inhibition tasks are due to a general slowness in processing information. Whether, and how slower information processing may contribute to an apparent inhibitory control deficit in DCD is also an unanswered question. Further exploration of the presence and nature of a possible inhibitory control deficit and its influence upon motor difficulties in DCD is therefore required.
Action initiation in response to a presented stimulus is commonly measured using Choice reaction time tasks (Miller & Low, Citation2001) to provide a measurement of reaction time and accuracy, and as an index of bottom-up information processing. When considering how inhibitory control regulates action initiation, a distinction should be made between action restraint and action cancellation processes. Action restraint refers to the inhibition of automatic responses that have not yet been initiated, whilst action cancellation refers to the rapid termination of movement after initiation (Dambacher et al., Citation2014). Importantly, action cancellation as a function of top-down inhibitory control, requires additional executive resources (Aron, Citation2011; Schachar et al., Citation2007; Verbruggen & Logan, Citation2008a). Distinguishing these in DCD is important, as it can provide additional information regarding the source of inhibitory deficits. A common task to evaluate action restraint is the “Go/No-Go” task, in which participants are required to respond to frequent “Go” trials, and to suppress responses during infrequent “No-Go” trials (Gomez, Ratcliff, & Perea, Citation2007). Several studies have investigated action restraint processes in DCD using this paradigm (Cousins & Smyth, Citation2003; Querne et al., Citation2008; Thornton et al., Citation2018) and found increased total error rates relative to control participants. There is far less evidence for the presence of an action cancellation deficit in DCD.
The Stop-Signal Task (SST) is commonly used to measure action cancellation. In the SST, the “No-Go” stimulus is presented after the “Go” stimulus within the same trial, requiring the participant to inhibit a response that they have already initiated. The time between the “Go” stimulus presentation and the “No-Go” stimulus presentation is known as the Stop Signal Delay (SSD; Verbruggen & Logan, Citation2008b). The main outcome variable of the SST is the Stop Signal Reaction Time (SSRT), which is held as an index of top-down executive inhibitory control (Verbruggen & Logan, Citation2008b). The SSRT can be understood as the latency of the stop process, which is a covert latency, since it cannot be observed directly (as successful response inhibition results in the absence of an observable response). Thus, the SSRT needs to be estimated from a stochastic model, such as the independent race model of Logan, Cowan, and Davis (Citation1984), which takes into account the individual’s SSD and reaction times on “Go” trials. The independent race model assumes that the “Go” process races the “No-Go” process, and if the “No-Go” process is completed before the previously initiated “Go” process, then the response will be successfully inhibited. As SSRT provides a measure of inhibitory control that accounts for each participants’ reaction time it has great application for populations, such as those with DCD, who demonstrate a generally slowed reaction time which may not be accounted for when calculating the time taken to inhibit a response using other methods. The SST requires a motor response in the form of a key press in response to a stimulus, and so, consistent with previously discussed research, response times to “Go” trials will likely be slower for individuals with DCD than typically developing (TD) individuals (Henderson, Rose, & Henderson, Citation1992; Piek, Dyck, Francis, & Conwell, Citation2007). However, if the SSRT is not significantly different between individuals with and without DCD, then we may conclude that inhibitory response deficits are likely due to slower processing speeds.
Thus far, only one study (He et al., Citation2018) has examined action cancellation in DCD. In this study, a form of the SST was utilized in which participants had to stop an ongoing response (key press) to match the location of a target line in an indicator bar that filled up at constant velocity. A non-significant trend indicated that participants with DCD had greater SSRT than controls; however, further research is needed to determine if this result is replicable across recommended variations of the SST (Verbruggen et al., Citation2019), and if these results may be better explained by generalized slowness in processing and responding to information.
Due to the currently limited evidence for impaired action cancellation in DCD, there is a need to clarify the nature of the inhibitory deficit, as this impacts the understanding of the disorder and possible intervention strategies. The aim of the present study is therefore to investigate action cancellation in adults with and without DCD using an SST paradigm. This will be complemented by a Choice Reaction Task (CRT) as a measure of general efficiency in responding to a stimulus. This paradigm will allow for, in combination with model-based analysis, an examination of bottom-up and top-down processing and how these may contribute to the presence of any observed inhibitory deficit. It is hypothesized that first, individuals in the DCD group will display slower reaction times than TD adults across both the CRT and SST. Second, it is predicted that individuals with DCD will exhibit a slower SSRT than TD adults indicative of an action cancellation deficit.
To accompany and expand upon the comparison of these metrics a Bayesian framework will be used in order to evaluate separately Go and Stop processes. Having been previously utilized to characterize inhibitory deficits in ADHD and Schizophrenia (Matzke, Hughes, Badcock, Michie, & Heathcote, Citation2017; Weigard, Heathcote, Matzke, & Huang-Pollock, Citation2019), this method estimates the entire distribution of SSRTs and Go RTs and employs an extended ex-Gaussian race model to provide a mechanistic examination of the top-down processing itself (Weigard et al., Citation2019). Thus, providing more granular and specific information about the underlying Go and SSRT distributions, from which executive control over inhibitory control can be measured separately from information processing mechanisms. Of particular relevance to this study, and the disentanglement between top-down and bottom-up processes in DCD, are the estimation of the probability of Go failure (PGF) and of trigger failure (PTF). The PGF, refers to situations where a Go response was not triggered within a trial, and PTF to the likelihood of the event whereby inhibitory functions failed to trigger in response to the presented stimulus. It is expected that, consistent with the previous hypotheses, evidence of increased PGF will be present in participants with DCD, as evidence of inefficient stimulus response, as well as increased PTF, which will be indicative of an executive inhibitory deficit.
Methods
Participants
Seventy-nine individuals were recruited through the University of Surrey (N = 40) and Goldsmiths, University of London (N = 39), using local databases, poster advertisements and university recruitment systems. Participants attended one session, where they completed the behavioral tasks followed by the neuropsychological assessment. Ethical approval was granted by the University of Surrey and Goldsmiths, University of London.
Inclusion criteria for individuals with DCD included the fulfillment of DSM-5 (Association, Citation2013) DCD diagnostic criteria with reference to European guidelines for the UK context (Barnett, Hill, Kirby, & Sugden, Citation2014). Due to high comorbidity between ADHD and DCD (Kadesjö & Gillberg, Citation2001; Pitcher, Piek, & Hay, Citation2003), and the implication of impaired inhibitory control in ADHD (Wodushek & Neumann, Citation2003), participants who reported a diagnosis of ADHD were not included in the study.
The final TD sample retained for analysis consisted of 42 individuals, (31 female, M age 25.93 years, SD = 8.02). In the DCD group, there were 13 participants that fulfilled all DSM-5 diagnostic criteria (9 female, M age 22.37 years, SD = 2.36). Additionally, 16 possible DCD (10 female, M age 30.56 years, SD = 11.23) were identified, who demonstrated motor difficulty, but who did not fulfil additional DCD diagnostic criteria. These participants were combined with the DCD participants to create a possible DCD (DCD+pDCD, M age 26.89 years, SD = 9.33) group for additional comparisons with the TD group. Descriptive statistics for the DCD, DCD+pDCD and TD groups on all background measures can be found in . One DCD and one pDCD participant were removed from the CRT analysis as outliers due to very slow median reaction times, while one TD participant was removed due to low accuracy (see section 2.4 Behavioral Tasks). A smaller sample was retained for SST analysis after the application of compliance criteria, consisting of 33 TD, 12 DCD and 26 DCD+pDCD participants (see section Behavioral Tasks). When examining this smaller sample, the pattern of observed group differences on background measures variables remained consistent with the larger sample (Supplemental ).
Table 1. Background Measures descriptives and t-test results of the DCD, TD, and DCD+pDCD groups
Neuropsychological assessment
The Movement Assessment Battery for Children, second edition (MABC-2, Henderson, Sugden, & Barnett, Citation2007) is a tool commonly used in clinical and educational settings to assist in the diagnosis of DCD by identifying the presence of motor difficulties (Montoro et al., Citation2016). Conditions for inclusion into the DCD or DCD+pDCD group included a MABC-2 score at or below the 16th percentile in order to meet the first criterion of the DSM-5 (movement difficulty). The MABC-2 measures three aspects of motor functioning; manual dexterity, balance and aiming and catching. The measure has three age bands; for the current study, the third age band (11–16 years 11 months) was used. While the MABC-2 is designed for measuring movement difficulties in childhood, the lack of an appropriate test to assess motor difficulty in adulthood means that this practice is common in DCD research with adults (Cantell, Crawford, & (Tish) Doyle-Baker, Citation2008; Cousins & Smyth, Citation2003).
The Adult Developmental Coordination Disorder checklist (ADC, Kirby, Edwards, Sugden, & Rosenblum, Citation2010) is the first screening tool developed for DCD in adulthood, assessing the second and third DSM-5 DCD diagnostic criteria by measuring the degree of motor difficulties experienced retrospectively in childhood (section one) and during daily tasks (section two). Overall scores of 56 or above in combination with a score of at least 17 in section one indicates a possibility of DCD. This criterion was fulfilled for participants included within the DCD group. Participants who demonstrated motor difficulty but who had an ADC total score below 56 were included within the DCD+pDCD group. An exception was made for one participant to be included in the DCD group, who scored an ADC total score of 68, despite a score of 16 in section one.
The Wechsler abbreviated scales of intelligence, second edition (WASI-II, Wechsler, Citation2011) provides measures of verbal comprehension (VCI) and perceptual reasoning (PRI) in addition to Full Scale Intelligence Quotient (FSIQ) and is a brief, reliable measurement of cognitive abilities (McCrimmon & Smith, Citation2013). In order to fulfil DSM-5 criterion D and ensure our TD participants did not exhibit intellectual impairment, a WASI-II FSIQ of over 70 was required for inclusion within the study.
Participants completed the ADC, after which the WASI-II was administered with all four subtests completed in the order specified by the manual. The final measure completed was the MABC-2.
Behavioral tasks
Tasks were programmed using the Psychophysics Toolbox for MATLAB (Brainard, Citation1997; Kleiner, Citation2007; Pelli, Citation1997).
Choice reaction task (CRT) is a two-alternative forced choice paradigm which provides a measure of motor response time to a stimulus (Miller & Low, Citation2001). Participants were instructed to respond both as quickly and as accurately as possible to the stimuli; either a left or a right pointing arrow (). Left pointing arrows required a left index finger press of the “Z” key and right pointing arrows of the “M” key with the right index finger on a laptop keyboard. Participants completed 144 trials; each trial began with a centrally presented fixation cross for 350 ms prior to the presentation of a left or right pointing arrow for 1200 ms as demonstrated in .
Figure 1. Behavioral tasks and stop-signal race model. Representations of the sequence of visual stimuli presented in the CRT (Panel A) and SST (Panel B). Panel B also includes the proportion of each stimuli type for the SST task. Panel C is a schematic illustration of the two-racer ex-Gaussian stop-signal race model employed in the Bayesian modeling approach. It includes the underlying structure of Go Signal Reaction Time, Signal Respond Reaction Time, and Stop Signal Reaction Time Distributions with reference to modeling parameters. Panel C was adapted from Heathcote et al., 2018 (Creative Commons CC- BY license, https://creativecommons.org/licenses/by/2.0/). RT = Reaction Time, SSD = Stop Signal Delay, SSRT = Stop Signal Reaction Time
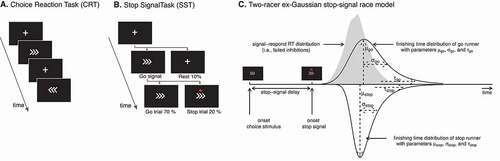
Stop signal task (SST) is a two-alternative forced choice reaction task, with ‘Go, “Stop” and “Rest” trials. On “Go” trials participants respond to the stimuli as described in the CRT, while responses were required to be withheld on “Stop” trials. During each trial, a fixation cross was presented for 500 ms, followed by a 1400 ms long presentation of the “Go” stimuli. As shown in , 10% of trials were “Rest” trials in which the fixation cross presentation remained throughout the trial; 20% of trials were “Stop” trials, whereby a stop signal (red circle) was presented after the “Go” stimulus. The “Stop” signal indicated the need to withhold a response and was presented with a variable delay following the appearance of the “Go” stimuli. The period between the “Go” stimulus presentation and the stop signal is the stop signal delay (SSD).
The SSD was adapted throughout the task using a staircase procedure designed to achieve 50% stopping accuracy. The initial SSD was calculated for each participant taking into account their median reaction time in the CRT and subtracting 200 ms, as in Jilka et al. (Citation2014) using variations recommended by Verbruggen et al. (Citation2019). The SSD was adapted every two stop trials. If the cumulative accuracy was above 50%, the SSD was decreased by 50 ms, and vice versa if a cumulative accuracy of less than 50% was calculated. We computed a critical SSD using the method described by Duann, Ide, Luo, and Li (Citation2009). SSRT was calculated through subtraction of the critical SSD from the median “Go” reaction time. As the SST requires participants to be both fast and accurate, which become competing task demands, it is common for participants to adopt a strategic slowdown (Verbruggen & Logan, Citation2008b). This interferes with the calculation of a correct SSRT, as it results in a slower “Go” reaction time. To avoid the adoption of this strategy, participants were instructed to respond as quickly and as accurately to the stimuli, and negative feedback was presented on the screen with the words “Speed up!” each time a participant responded with a reaction time at or above the 95th percentile of their reaction time distribution on the CRT. The SST relies upon achieving approximately 50% stopping accuracy, with scores significantly above or below indicating that either the participant is intentionally slowing their responses to wait for the stop signal, or they are failing to inhibit a majority of responses (Hochman, Henik, & Kalanthroff, Citation2018; Leotti & Wager, Citation2010). For this reason, participants were retained for analysis if an SST accuracy of above 40% but below 60% was achieved.
Data analysis
All variables were examined for normality violations prior to analysis. All analyses were run using R version 4.0.2 and R Studio version 1.3.1073 (R Core Team, Citation2019) and data manipulation was achieved using functions from dplyr version 0.8.5 (Wickham, François, Henry., & Müller, Citation2020). For frequentist and Bayesian group comparison analysis on normally distributed data, independent samples t-tests were run using JASP software for use in R (JASP Team, Citation2020). If normality violations were present, Wilcoxon rank-sum tests were run instead, again using functions from JASP. A Bayes factor indicates the strength of evidence suggesting that one hypothesis is more likely than another (Rouder, Speckman, Sun, Morey, & Iverson, Citation2009). Factors of less than 1 indicate no evidence against the null hypothesis, while factors of above 10 indicate strong evidence in favor of the alternate hypothesis. The strengths of evidence is proportional to the Bayes Factor, for example, a factor of 0.5 indicates that the data is twice as likely to be observed under the null hypothesis, while a factor of 5 may indicate the likelihood of this observation to be 5 times as likely under the alternate hypothesis.
Model-based analysis
Traditional ex-Gaussian models were created for additional analysis of reaction time distributions and inhibitory control functions using the Dynamic Models of Choice package release version 190,819 for R software (Heathcote et al., Citation2018). Reaction times data were cleaned by excluding trials in which participants responded in less than 250 ms due to the likelihood these represent false alarm responses. In addition, participants that failed to reach a stopping accuracy of between 40% and 60% also deemed non-compliant with SST instructions and therefore excluded from analysis. Three models were created from the (1) TD, (2) DCD and (3) combined DCD+pDCD groups separately.
Due to the relatively high Go accuracy and low number of errors within our data, the reaction time parameters μ and σ, and respectively representing the mean and standard deviations of the ex-Gaussian distribution were calculated separately for Go and Stop processes, in addition to τ, indicative of the tail of the distribution (). The modeled SSRT distribution therefore consisted of μStop, σStop and τ Stop parameters. Additional parameters calculated included PGF and PTF, yielding a total of 8 parameters, for which 30 chains were used for sampling. An analysis using ex-Gaussian models that modeled 3 runners in a modified race model (the correct Go response, incorrect Go response, Stop response) was attempted in order to account for commission errors by extracting parameters related to incorrect Go responses as a separate distribution (Matzke, Curley, Gong, & Heathcote, Citation2019). However, the models consistently overestimated the probability of an incorrect Go response across all groups, resulting in a poor fit between the model and observed data, consequently traditional two racer ex-Gaussian models were utilized.
Prior to the main analysis, an initial 100 iterations with migration on was performed, followed by inspection of iteration convergence. This was followed by the completion of another 100 iterations with migration off. Monte Carlo Markov chain convergence was checked for by visual inspection of iteration plots and the calculation of Gelman-Rubin diagnostics. TD, DCD+pDCD and DCD model chains demonstrated convergence. After this process, the parameter estimates generated were used as starting points for the group-level model parameters. One hundred iterations per group model were retained, for 3000 samples per posterior parameter per group model.
Results
CRT results
Participants in all groups demonstrated a high level of accuracy in the CRT (DCD: 95.56%, DCD+pDCD: 97.15%, TD: 98.08%; ). CRT outcome variables were analyzed between groups using frequentist and Bayesian t-tests.
Figure 2. CRT accuracy and reaction times distributions across group. Box plots show the distributions of accuracy percentages across TD, DCD and DCD+pDCD groups (Panel A) and frequency distributions of median reaction time (in seconds) on correct trials across the TD, DCD and DCD+pDCD groups (Panel B). Individual dots represent individual participants
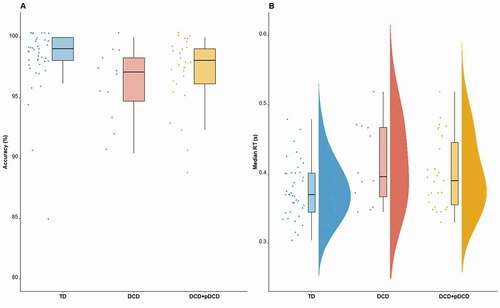
Frequentist analysis revealed a significant difference in accuracy between the DCD and TD groups, with the DCD group being less accurate; however, the strength of evidence for this difference was demonstrated to be very weak as per the Bayes Factor; W = 362.5, p = .011, r = .347, BF = 0.47. Further analysis of the nature of errors revealed that participants with DCD were not more likely to make a commission error (i.e. respond with the wrong key press) W = 164.5, r = .261, p = .059, BF = 3.25, but were significantly more likely to commit an omission error (i.e. fail to respond to the stimuli by not pressing a key), W = 142.5, r = .443, p = .001, r = .269, BF = 4.35. While differences in accuracy and commission errors were not observed between the TD and DCD+pDCD group, the same pattern was observed whereby DCD+pDCD participants made more omission errors W = 440, r = .260, p = .032, BF = 0.63, however the evidence for this was less conclusive than in the previous DCD only group analysis.
Reaction times were analyzed for correct trials. shows frequency distributions for reaction times plotted across the TD and DCD groups, with an additional distribution for the combined DCD+pDCD participants. Wilcoxon rank-sum test indicated a significant difference between TD (Mdn = 0.37) and DCD (Mdn = 0.40) groups in median reaction time, W = 154, r = .269, p = .025, BF = 1.47, with DCD participants having slower median reaction times. When comparing the DCD+pDCD to the TD group, significant differences in median reaction time were observed using frequentist analysis (DCD+pDCD, Mdn = 0.40; W = 412, r = .215, p = .038, BF = 0.32), such that the DCD+pDCD group were slower to respond than TD participants.
SST results
Descriptive statistics, frequentist p values and Bayes factors for SST-related variables by group can be found in . In order to establish whether participants with DCD performed the task according to the necessary requirements, we first analyzed the amount of negative feedback received and Stop-Accuracy. The DCD group exhibited a lower amount of negative feedback than the TD group, indicating that the DCD group were less likely to adopt a slowdown strategy (DCD: M = 7.90, SD = 5.30; TD: M = 11.11, SD = 5.45); W = 914, r = .241, p = .026, BF = 1.00). Similarly, no group differences were observed for Stop-Accuracy were observed, W = 838, r = .164, p = .131, BF = 0.23. With the addition of pDCD participants to the DCD group (DCD+pDCD), no significant differences were found in Stop-Accuracy, W = 1510.5, r = .000, p = .995, BF = 1.57 or negative feedback W = 1547, r = .019, p = .837, BF = 1.49. This evidence indicates that DCD and DCD+pDCD participants did not differ from TD participants in their approach and engagement with the SST.
Table 2. Descriptive statistics, p values and Bayes Factors (BF) across groups on SST outcome variables
Evidence for group differences in median reaction time on correct trials were found with reference to frequentist results, W = 95.5, r = .394, p = .008, BF = 1.26, although the Bayes Factor indicates only weak evidence. When including the DCD+pDCD participants differences in median reaction times between the DCD+pDCD and TD groups remained significant, and stronger evidence was provided by the relevant Bayes factor, W = 694.5, r = .529, p <.001, BF = 5.27. No evidence for differences in SSRT between DCD and TD participants was found (DCD, M = 0.22, SD = 0.05; TD, M = 0.22, SD = 0.05, t(44) = 0.17, p = .860, d = .044, BF = 1.35), which did not change when including the pDCD participants within the DCD group (DCD+pDCD, M = 0.21, SD = 0.07; t(58) = 1.02, p = .309, d = .200, BF = 1.08). For Go-Accuracy, no significant differences were found between the DCD and TD groups, W = 772.5, r = .086, p = .427, BF = 1.36, which remained the case when investigating DCD+pDCD participants, W = 1707.5, r = .111, p = .245, BF = 1.51.
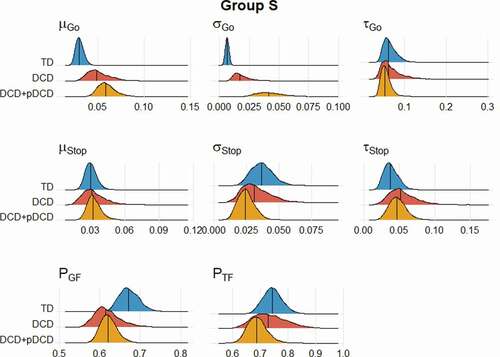
Model-based SST analysis
Between-group differences were calculated and evaluated using Bayesian p values, for both approximation of the group means (Group M) and standard deviations (Group S) as displayed in . While this allows for the comparisons of model parameters between groups, the PGF and PTF parameters were transformed to allow for the placement of group medians on a probability scale.
Table 3. Medians and Bayesian p value comparisons between DCD and TD, and DCD+pDCD groups for each posterior parameter at the group level
When regarding inhibitory processes in DCD, the current analysis provides evidence that the ability to initiate Go processes is impaired, while the ability to initiate a stopping process is retained, supported by the observation of a greater PGF in the DCD+pDCD group (p = .038, see ) and a lack of differences in PTF (). Evidence of differences between the TD and DCD groups in PGF was weaker (p = .096). When examining parameters relating to these processes, participants with DCD had differences in μ Go (p = .030) and σ Go (p = .001) S parameters. This pattern was also observed when comparing the DCD+pDCD participants to the TD group, in addition to demonstrating significant differences in μ Go <.001 (p = <.001) and τ Go (p = .001) M parameters. No differences in any Stop process parameters were observed.
Figure 3. Distribution of Group M and S parameters by Group. Shapes represent the distribution within each group across the parameter, with the central line representing the group median
Discussion
In this study we employed two complementary paradigms to disentangle bottom-up information from top-down executive motor inhibitory control. To do this, adults with DCD and probable DCD and typically developing adults were compared across a CRT and an SST paradigms. Our primary hypothesis posited that the DCD group would display a slower reaction time than those in the TD group. CRT frequentist analysis revealed slower reaction times in the DCD group, which was also observed when comparing the DCD+pDCD group. Additionally, a slower reaction time on Go trials when completing the SST was observed in DCD and DCD+pDCD participants, albeit with weaker evidence for this difference in the DCD group. This observation is consistent with previous literature that has found slower reaction and stimulus processing in DCD (Henderson et al., Citation1992; Wilson & McKenzie, Citation1998). Our secondary hypothesis predicted that the DCD group would have a significantly slower SSRT, indicative of an action cancellation motor inhibitory control deficit. This was not observed when comparing the DCD and DCD+pDCD to the TD groups, nor did the analysis of the Bayesian models revealed any differences in components related to stopping processes. While not anticipated, a distinct pattern of errors emerged for DCD and DCD+pDCD participants, who made more omission errors, while not differing in the total number of commission errors as compared to TD participants.
Initiation of Go processes was overall less reliable in the DCD+pDCD group, which was not apparent when referring to overall SST accuracy prior to the model-based analysis, but may also be indicated by the greater occurrence of response omissions in the DCD and DCD+pDCD groups during the CRT. This could be evidence of a less efficient Go process initiation mechanism, and additionally, the large differences in μ Go and σ Go M parameters reveal a Go process in DCD that is not only less reliable in initiation, but also seems to have an atypical distribution, with a shallower mean and elongated tail indicative of slower, more variable responses. It should also be considered with reference to the frequentist analysis findings that generally slower responses were present in our DCD group within the SST, and so it may be the case that an additional specific deficit exists in processing conflicting information in DCD in conjunction with generally slower information processing. In terms of stop trial parameters, no evidence of differences between TD and DCD participants was found. This indicates that action cancellation functions in DCD may be unaffected, and instead differences in behavioral results may be attributable to slower information processing. The same pattern of intact action cancellation inhibitory functioning and difficulty with information processing is present within the expanded DCD+pDCD group. Frequentist analysis indicated slower median reaction times in DCD and DCD+pDCD during the SST participants but no difference in response accuracy compared to TD controls. When examining the expanded DCD+pDCD group, participants had a greater PGF indicative of less efficient Go response initiation as a result of bottom up processing deficits. This is further supported by results of the CRT that indicated participants with DCD made more omission errors than their TD peers. When taken in combination with differences in PGF, this seems likely to be further evidence of an inefficient action initiation mechanism in DCD.
Poorer inhibitory control in DCD has most often been ascribed to a top-down executive functioning deficit (Pratt, Leonard, Adeyinka, & Hill, Citation2014). However, because differences in SSRT components were not evident, while slower and less reliable action initiation was observed, the results of the current study instead suggest that primary deficits in DCD involve bottom-up processing. Previously, slower motor reaction and processing times in adults with DCD have been observed (Cousins & Smyth, Citation2003), however, it has been difficult to ascertain if this is dependent upon usage of a slowdown strategy in order to prioritize accuracy. While not a primary hypothesis, in the current study, the Negative Feedback and SST accuracy allowed us to ascertain if participants with and without DCD differed in their use of cognitive strategies whilst completing the SST. The fact that the DCD and DCD+pDCD groups did not incur more instances of negative feedback suggests similar executive strategy (top-down), further indicating that the observed results are more likely explained by slower information processing (bottom up). This is also partially consistent with our CRT results, which indicated significantly slower median reaction times in the DCD+pDCD group. Additionally, the greater omissions seen in participants with DCD suggests increased difficulty triggering a Go response, further supporting a deficit in early stimulus detection processes.
The finding that motor inhibitory control difficulties are not a result of an executive deficit, but instead a deficit in information processing is highly relevant when trying to explain the underlying mechanism of movement difficulty in DCD. The internal modeling deficit hypothesis holds that the motor difficulties in DCD are due to a reduced ability to accurately and efficiently create, update and represent motor plans (Wilson, Maruff, & Lum, Citation2003). During motor operations, movement is represented via an internal model (Wolpert, Ghahramani, & Jordan, Citation1995), which allows for the rapid prediction of motor outcomes, and for the correction of motor plans with reference to incoming sensory information. In DCD, poorly defined and less flexible internal representations of movement have been observed (Gabbard & Bobbio, Citation2011; Maruff, Wilson, Trebilcock, & Currie, Citation1999; Wilson, Ruddock, Smits‐Engelsman, Polatajko, & Blank, Citation2013). For example, individuals with DCD find it difficult to engage in motor imagery (Noten, Wilson, Ruddock, & Steenbergen, Citation2014; Reynolds, Licari, Elliott, Lay, & Williams, Citation2015) and do not seem to benefit from this activity as much as their TD peers (Hyde et al., Citation2014). Similarly, while children with DCD are able to engage in efficient mental rotation of objects, they are not able to do so for the movement of limbs (Wilson et al., Citation2004). One explanation holds that this represents an executive cognitive deficit (Fuelscher, Williams, Enticott, & Hyde, Citation2015); however, another account holds that the difficulty internally representing movement in DCD may be best explained by inefficiency in utilizing sensory information (Smits‐Engelsman & Wilson, Citation2013). Thus, inefficiency of information processing can lead to a poorly defined sense of the position of the body in space, and poorer motor predictions. The subsequent overreliance on feedback mechanisms in order to exert control over motor operations, often culminates with slower and less coordinated movement. As the current study found no evidence of differences in top-down executive processing, but consistent evidence for slower processing in DCD participants across both tasks, this supports the second account of the internal modeling deficit hypothesis. Further research should seek to characterize the nature of this information processing deficits across a range of multimodal stimuli, in order to determine if the observed results represent a global or a specific deficit.
Further consideration should also be given to why the described results differed from He et al. (Citation2018) who conducted the only other study investigating action cancellation in adults with DCD. He et al. (Citation2018) identified a non-significant trend in slower SSRT in participants with probable DCD when using an SST paradigm. While the researchers argued that this represents evidence for inefficient action cancellation in DCD, it should be considered that the nature of the tasks differed significantly. The SST paradigm of the current study had static pointing arrows as stimuli, while in the research of He et al., a bar was present on a screen which took 1s to fill completely, with the stop signal appearing at a certain level on the bar. For individuals with DCD, this may introduce an additional element of difficulty related to information processing, but not necessarily to executive inhibitory control processes. Individuals with DCD have identified difficulties with vertical pursuit eye tracking (Robert et al., Citation2014); as the bar utilized by He et al. was vertical, the observed non-significant trend in SSRT may represent slowed eye tracking of a dynamic and vertically moving stimulus as opposed to a deficit in executive motor inhibitory control.
There are limitations to the current research that should be addressed. In meeting the DCD diagnostic criteria, for criteria B and C the recommended cutoffs from Kirby et al. (Citation2010) on the ADC have been used. However, it has been suggested that these cutoffs may be too conservative, and a number of authors have advocated for lower thresholds. For example, in He et al. (Citation2018) a cutoff of 6 in Section A, and 25 in ADC total score was used based upon the confidence intervals of a previously recruited sample. The strategy for the current study was the creation of a DCD+pDCD group of participants with a motor difficulty, but who did not report a sufficient degree of difficulty in their everyday lives. This may represent an arbitrary distinction; in terms of our CRT and SST outcome measures, these participants did not cluster toward one end of the distribution when included within the DCD group and seemed to perform similarly to other DCD participants on most outcome variables. Additionally, while participants who reported a diagnosis of ADHD or a diagnosis of another neurodevelopmental disorder were unable to participate in the current study, it may be possible that due to the high level of co-occurrence, some participants with DCD may have had undiagnosed ADHD. However, if this was the case, we would have reasonably expected to observe differences between groups in terms of action cancellation, which was not the case.
It should be also considered that the traditional ex-Gaussian models used do not account fully for commission errors. While a three runner ex-Gaussian analysis was attempted, good fits were unable to be attained precluding the additional modeling of incorrect Go responses. This is most likely due to the high accuracy levels for Go trials in our sample when compared to other comparable studies (Jilka et al., Citation2014).
In our SST slower responses on Go trials were observed in the DCD and DCD+pDCD groups; however, the relevant Bayes Factors indicated only limited evidence of reaction time group differences during the CRT. It may be the case that an insufficient number of trials were run with the smaller DCD and DCD+pDCD groups. While the SST used two runs for a greater total number of Go trials, the CRT relied upon only one run. It should also be considered that fatigue may have played a role, as the CRT was completed before the SST. Fatigue is becoming an increasingly acknowledged symptom of DCD, with adults with DCD demonstrating significantly heightened levels of fatigue, difficulty sleeping and difficulty completing cognitive tasks (Thomas & Christopher, Citation2017). It may therefore be the case that the sustained demand for rapid and accurate responses resulted in greater differences in median reaction time in the SST than the CRT due to less cognitive resources available to DCD participant to maintain task performance for an extended period.
Conclusion
The current study sought to clarify the inhibitory control abilities of adults with DCD, with an SST paradigm able to dissociate general reaction times from inhibition processes. Adults with DCD had slower reaction times on the CRT and SST, however, slower SSRT was not observed, indicating that differences in information processing speed are a more likely explanation than an executive motor inhibition deficit in DCD. This was further supported by the modeling analysis which failed to find evidence of difficulty executing a stopping process in DCD, but evidence of difficulty initiating a Go process. Future research should seek to explore further the nature of information processing difficulties in DCD, and how these may be implicated in movement difficulties.
Context
Complex everyday tasks require rapid and successful movement planning that relies on a tight-balance between bottom-up and top-down control of information flow. Individuals with Developmental Coordination Disorder (DCD) display fine and gross motor difficulties, which often manifest in an inability to cancel or supress unwanted movements during motor operations. However, it is currently unknow whether this difficulty is due to inefficient bottom-up, top-down or a combination of the two processes. Here we present the results of two experimental paradigms, accompanied by Bayesian modeling to help disentangle information processing speed (bottom-up) from executive motor inhibition (top-down).
Supplemental Material
Download PDF (284.9 KB)Data Availability statement
CRT, SST and participant background measures data are available via the Open Science Framework (OSF; https://osf.io/9qpbv/). The background test materials are not included through the OSF, as these are copyrighted tests. This study, procedure or analyses were not pre-registered prior to data collection.
Supplementary material
Supplemental data for this article can be accessed on the publisher’s website.
Additional information
Funding
References
- Aron, A. R. (2011). From reactive to proactive and selective control: developing a richer model for stopping inappropriate responses. Biological Psychiatry, 69(12), e55–68. doi:https://doi.org/10.1016/j.biopsych.2010.07.024
- Association, A. P. (2013). Diagnostic and Statistical Manual of Mental Disorders (DSM-5®), Arlington, VA: American Psychiatric Publishing.
- Barnett, A., Hill, E., Kirby, A., & Sugden, D. (2014). Adaptation and extension of the European recommendations (EACD) on developmental coordination disorder (DCD) for the UK context. Physical & Occupational Therapy in Pediatrics, 35. doi:https://doi.org/10.3109/01942638.2014.957430
- Bernardi, M., Leonard, H. C., Hill, E. L., & Henry, L. A. (2016). Brief report: response inhibition and processing speed in children with motor difficulties and developmental coordination disorder. Child Neuropsychology, 22(5), 627–634. doi:https://doi.org/10.1080/09297049.2015.1014898
- Blank, R., Smits-Engelsman, B., Polatajko, H., & Wilson, P.; European Academy for Childhood Disability. (2012). European academy for childhood disability (EACD): recommendations on the definition, diagnosis and intervention of developmental coordination disorder (long version). Developmental Medicine and Child Neurology, 54(1), 54–93.
- Brainard, D. H. (1997). The psychophysics toolbox. Spatial Vision, 10(4), 433–436. doi:https://doi.org/10.1163/156856897X00357
- Cantell, M., Crawford, S. G., & (Tish) Doyle-Baker, P. K. (2008). Physical fitness and health indices in children, adolescents and adults with high or low motor competence. Human Movement Science, 27(2), 344–362. doi:https://doi.org/10.1016/j.humov.2008.02.007
- Cousins, M., & Smyth, M. M. (2003). Developmental coordination impairments in adulthood. Human Movement Science, 22(4–5), 433–459. doi:https://doi.org/10.1016/j.humov.2003.09.003
- Dambacher, F., Sack, A. T., Lobbestael, J., Arntz, A., Brugman, S., Schuhmann, T. (2014). A network approach to response inhibition: dissociating functional connectivity of neural components involved in action restraint and action cancellation. European Journal of Neuroscience, 39(5), 821–831. doi:https://doi.org/10.1111/ejn.12425
- de Oliveira, R. F., & Wann, J. P. (2012). Driving skills of young adults with developmental coordination disorder: maintaining control and avoiding hazards. Human Movement Science, 31(3), 721–729. doi:https://doi.org/10.1016/j.humov.2011.06.010
- Diamond, A. (2013). Executive functions. Annual Review of Psychology, 64(1), 135–168. doi:https://doi.org/10.1146/annurev-psych-113011-143750
- Duann, J.-R., Ide, J. S., Luo, X., & Li, C. R. (2009). Functional connectivity delineates distinct roles of the inferior frontal cortex and presupplementary motor area in stop signal inhibition. Journal of Neuroscience, 29(32), 10171–10179. doi:https://doi.org/10.1523/JNEUROSCI.1300-09.2009
- Fuelscher, I., Williams, J., Enticott, P. G., & Hyde, C. (2015). Reduced motor imagery efficiency is associated with online control difficulties in children with probable developmental coordination disorder. Research in Developmental Disabilities, 45–46, 239–252. doi:https://doi.org/10.1016/j.ridd.2015.07.027
- Gabbard, C., & Bobbio, T. (2011). The inability to mentally represent action may be associated WITH PERFORMANCE DEficits in children with developmental coordination disorder. International Journal of Neuroscience, 121(3), 113–120. doi:https://doi.org/10.3109/00207454.2010.535936
- Gálvez-García, G., Albayay, J., Rehbein, L., Bascour-Sandoval, C., & Michael, G. A. (2018). Response inhibition as a function of movement complexity and movement type selection. Frontiers in Psychology, 9. doi:https://doi.org/10.3389/fpsyg.2018.02290
- Gilbert, D. L., Isaacs, K. M., Augusta, M., Macneil, L. K., & Mostofsky, S. H. (2011). Motor cortex inhibition: A marker of ADHD behavior and motor development in children. Neurology, 76(7), 615–621. doi:https://doi.org/10.1212/WNL.0b013e31820c2ebd
- Gomez, P., Ratcliff, R., & Perea, M. (2007). A model of the go/no-go task. Journal of Experimental Psychology. General, 136(3), 389–413. doi:https://doi.org/10.1037/0096-3445.136.3.389
- He, J. L., Fuelscher, I., Coxon, J., Barhoun, P., Parmar, D., Enticott, P. G., Hyde, C. (2018). Impaired motor inhibition in developmental coordination disorder. Brain and Cognition, 127, 23–33. doi:https://doi.org/10.1016/j.bandc.2018.09.002
- Heathcote, A., Lin, Y.-S., Reynolds, A., Strickland, L., Gretton, M., Matzke, D. (2018). Dynamic models of choice. Behavior Research Methods, 51(2), 961–985. doi:https://doi.org/10.3758/s13428-018-1067-y
- Henderson, L., Rose, P., & Henderson, S. (1992). Reaction time and movement time in children with a developmental coordination disorder. Journal of Child Psychology and Psychiatry, 33(5), 895–905. doi:https://doi.org/10.1111/j.1469-7610.1992.tb01963.x
- Henderson, S., Sugden, D., & Barnett, A. (2007). Movement Assessment Battery for Children (Examiner’s Manual) (2nd edn). London, UK: Pearson Assessment.
- Hochman, S., Henik, A., & Kalanthroff, E. (2018). Stopping at a red light: recruitment of inhibitory control by environmental cues. PLOS ONE, 13(5), e0196199. doi:https://doi.org/10.1371/journal.pone.0196199
- Huau, A., Velay, J.-L., & Jover, M. (2015). Graphomotor skills in children with developmental coordination disorder (DCD): handwriting and learning a new letter. Human Movement Science, 42, 318–332. doi:https://doi.org/10.1016/j.humov.2015.03.008
- Hyde, C., Fuelscher, I., Buckthought, K., Enticott, P. G., Gitay, M. A., Williams, J. (2014). Motor imagery is less efficient in adults with probable developmental coordination disorder: evidence from the hand rotation task. Research in Developmental Disabilities, 35(11), 3062–3070. doi:https://doi.org/10.1016/j.ridd.2014.07.042
- JASP Team. (2020). JASP (Version 0.14.1) [Computer software]. https://jasp-stats.org/
- Jilka, S. R., Scott, G., Ham, T., Pickering, A., Bonnelle, V., Braga, R. M., … Sharp, D. J. (2014). Damage to the salience network and interactions with the default mode network. The Journal of Neuroscience: The Official Journal of the Society for Neuroscience, 34(33), 10798–10807. doi:https://doi.org/10.1523/JNEUROSCI.0518-14.2014
- Kadesjö, B., & Gillberg, C. (2001). The comorbidity of ADHD in the general population of Swedish school-age children. Journal of Child Psychology and Psychiatry, and Allied Disciplines, 42(4), 487–492. doi:https://doi.org/10.1111/1469-7610.00742
- Kalsi, N., Tambelli, R., Aceto, P., & Lai, C. (2015). Are motor skills and motor inhibitions impaired in tourette syndrome? A review. Journal of Experimental Neuroscience, 9, JEN.S25095. doi:https://doi.org/10.4137/JEN.S25095
- Kirby, A., Edwards, L., Sugden, D., & Rosenblum, S. (2010). The development and standardization of the adult developmental co-ordination disorders/dyspraxia checklist (ADC). Research in Developmental Disabilities, 31(1), 131–139. doi:https://doi.org/10.1016/j.ridd.2009.08.010
- Kleiner, M., Brainard, D., Pelli, D., Ingling, A., Murray, R., & Broussard, C. (2007). What’s new in Psychtoolbox. Perception, 36(14), 1–16.
- Leonard, H. C., Bernardi, M., Hill, E. L., & Henry, L. A. (2015). Executive functioning, motor difficulties, and developmental coordination disorder. Developmental Neuropsychology, 40(4), 201–215. doi:https://doi.org/10.1080/87565641.2014.997933
- Leonard, H. C., & Hill, E. L. (2015). Executive difficulties in developmental coordination disorder: methodological issues and future directions. Current Developmental Disorders Reports, 2(2), 141–149. doi:https://doi.org/10.1007/s40474-015-0044-8
- Leotti, L. A., & Wager, T. D. (2010). Motivational influences on response inhibition measures. Journal of Experimental Psychology. Human Perception and Performance, 36(2), 430–447. doi:https://doi.org/10.1037/a0016802
- Licari, M. K., Alvares, G. A., Varcin, K., Evans, K. L., Cleary, D., Reid, S. L., … Whitehouse, A. J. O. (2020). Prevalence of motor difficulties in autism spectrum disorder: analysis of a population-based cohort. Autism Research, 13(2), 298–306. doi:https://doi.org/10.1002/aur.2230
- Logan, G. D., Cowan, W. B., & Davis, K. A. (1984). On the ability to inhibit simple and choice reaction time responses: A model and a method. Journal of Experimental Psychology. Human Perception and Performance, 10(2), 276–291. doi:https://doi.org/10.1037/0096-1523.10.2.276
- Mandich, A., Buckolz, E., & Polatajko, H. (2002). On the ability of children with developmental coordination disorder (DCD) to inhibit response initiation: The simon effect. Brain and Cognition, 50(1), 150–162. doi:https://doi.org/10.1016/S0278-2626(02)00020-9
- Maruff, P., Wilson, P., Trebilcock, M., & Currie, J. (1999). Abnormalities of imagined motor sequences in children with developmental coordination disorder. Neuropsychologia, 37(11), 1317–1324. doi:https://doi.org/10.1016/S0028-3932(99)00016-0
- Matzke, D., Curley, S., Gong, C. Q., & Heathcote, A. (2019). Inhibiting responses to difficult choices. Journal of Experimental Psychology. General, 148(1), 124–142. doi:https://doi.org/10.1037/xge0000525
- Matzke, D., Hughes, M., Badcock, J. C., Michie, P., & Heathcote, A. (2017). Failures of cognitive control or attention? the case of stop-signal deficits in schizophrenia. Attention, Perception & Psychophysics, 79(4), 1078–1086. doi:https://doi.org/10.3758/s13414-017-1287-8
- McCrimmon, A. W., & Smith, A. D. (2013). Review of the wechsler abbreviated scale of intelligence, second edition (WASI-II). Journal of Psychoeducational Assessment, 31(3), 337–341. doi:https://doi.org/10.1177/0734282912467756
- Michel, E., Roethlisberger, M., Neuenschwander, R., & Roebers, C. M. (2011). Development of cognitive skills in children with motor coordination impairments at 12-month follow-up. Child Neuropsychology, 17(2), 151–172. doi:https://doi.org/10.1080/09297049.2010.525501
- Miller, J. O., & Low, K. (2001). Motor processes in simple, go/no-go, and choice reaction time tasks: A psychophysiological analysis. Journal of Experimental Psychology. Human Perception and Performance, 27(2), 266–289. doi:https://doi.org/10.1037/0096-1523.27.2.266
- Montoro, A. P. P. N., Capistrano, R., Ferrari, E. P., Reis, M. D. S., Cardoso, F. L., Beltrame, T. S., (2016). Concurrent validation of the MABC-2 and developmental coordination disorder questionnaire-BR. Journal of Human Growth and Development, 26(1), 74–80. doi:https://doi.org/10.7322/jhgd.110421
- Noten, M., Wilson, P., Ruddock, S., & Steenbergen, B. (2014). Mild impairments of motor imagery skills in children with DCD. Research in Developmental Disabilities, 35(5), 1152–1159. doi:https://doi.org/10.1016/j.ridd.2014.01.026
- Pelli, D. G. (1997). The videoToolbox software for visual psychophysics: transforming numbers into movies. Spatial Vision, 10(4), 437–442. doi:https://doi.org/10.1163/156856897X00366
- Picazio, S., & Koch, G. (2015). Is motor inhibition mediated by cerebello-cortical interactions?. The Cerebellum, 14(1), 47–49. doi:https://doi.org/10.1007/s12311-014-0609-9
- Piek, J. P., Dyck, M. J., Francis, M., & Conwell, A. (2007). Working memory, processing speed, and set-shifting in children with developmental coordination disorder and attention-deficit–hyperactivity disorder. Developmental Medicine and Child Neurology, 49(9), 678–683. doi:https://doi.org/10.1111/j.1469-8749.2007.00678.x
- Pitcher, T. M., Piek, J. P., & Hay, D. A. (2003). Fine and gross motor ability in males with ADHD. Developmental Medicine and Child Neurology, 45(8), 525–535. doi:https://doi.org/10.1017/S0012162203000975
- Pratt, M. L., Leonard, H. C., Adeyinka, H., & Hill, E. L. (2014). The effect of motor load on planning and inhibition in developmental coordination disorder. Research in Developmental Disabilities, 35(7), 1579–1587. doi:https://doi.org/10.1016/j.ridd.2014.04.008
- Quay, H. C. (1997). Inhibition and attention deficit hyperactivity disorder. Journal of Abnormal Child Psychology, 25(1), 7–13. doi:https://doi.org/10.1023/A:1025799122529
- Querne, L., Berquin, P., Vernier-Hauvette, M.-P., Fall, S., Deltour, L., Meyer, M.-E., De Marco, G., (2008). Dysfunction of the attentional brain network in children with developmental coordination disorder: A fMRI study. Brain Research, 1244, 89–102. doi:https://doi.org/10.1016/j.brainres.2008.07.066
- R Core Team. (2019). R: A language and environment for statistical computing. Vienna, Austria. Retrieved from https://www.R-project.org/
- Rahimi-Golkhandan, S., Steenbergen, B., Piek, J. P., & Wilson, P. H. (2014). Deficits of hot executive function in developmental coordination disorder: Sensitivity to positive social cues. Human Movement Science, 38, 209–224. doi:https://doi.org/10.1016/j.humov.2014.09.008
- Reynolds, J. E., Licari, M. K., Elliott, C., Lay, B. S., & Williams, J. (2015). Motor imagery ability and internal representation of movement in children with probable developmental coordination disorder. Human Movement Science, 44, 287–298. doi:https://doi.org/10.1016/j.humov.2015.09.012
- Robert, M. P., Ingster‐Moati, I., Albuisson, E., Cabrol, D., Golse, B., Vaivre‐Douret, L., (2014). Vertical and horizontal smooth pursuit eye movements in children with developmental coordination disorder. Developmental Medicine and Child Neurology, 56(6), 595–600. doi:https://doi.org/10.1111/dmcn.12384
- Rouder, J. N., Speckman, P. L., Sun, D., Morey, R. D., & Iverson, G. (2009). Bayesian t tests for accepting and rejecting the null hypothesis. Psychonomic Bulletin & Review, 16(2), 225–237. doi:https://doi.org/10.3758/PBR.16.2.225
- Schachar, R., Logan, G. D., Robaey, P., Chen, S., Ickowicz, A., Barr, C., (2007). Restraint and cancellation: multiple inhibition deficits in attention deficit hyperactivity disorder. Journal of Abnormal Child Psychology, 35(2), 229–238. doi:https://doi.org/10.1007/s10802-006-9075-2
- Schmitt, L. M., White, S. P., Cook, E. H., Sweeney, J. A., & Mosconi, M. W. (2018). Cognitive mechanisms of inhibitory control deficits in autism spectrum disorder. Journal of Child Psychology and Psychiatry, 59(5), 586–595. doi:https://doi.org/10.1111/jcpp.12837
- Smits‐Engelsman, B. C. M., & Wilson, P. H. (2013). Noise, variability, and motor performance in developmental coordination disorder. Developmental Medicine and Child Neurology, 55(s4), 69–72. doi:https://doi.org/10.1111/dmcn.12311
- Summers, J., Larkin, D., & Dewey, D. (2008). Activities of daily living in children with developmental coordination disorder: dressing, personal hygiene, and eating skills. Human Movement Science, 27(2), 215–229. doi:https://doi.org/10.1016/j.humov.2008.02.002
- Thomas, M. A., & Christopher, G. (2017). Fatigue in developmental coordination disorder: an exploratory study in adults. Fatigue: Biomedicine, Health and Behavior, 6(1), 41–51.
- Thornton, S., Bray, S., Langevin, L. M., & Dewey, D. (2018). Functional brain correlates of motor response inhibition in children with developmental coordination disorder and attention deficit/hyperactivity disorder. Human Movement Science, 59, 134–142. doi:https://doi.org/10.1016/j.humov.2018.03.018
- Trainor, L. J., Chang, A., Cairney, J., & Li, Y. (2018). Is auditory perceptual timing a core deficit of developmental coordination disorder?. Annals of the New York Academy of Sciences, 1423(1), 30–39. doi:https://doi.org/10.1111/nyas.13701
- Tsai, C.-L. (2009). The effectiveness of exercise intervention on inhibitory control in children with developmental coordination disorder: using a visuospatial attention paradigm as a model. Research in Developmental Disabilities, 30(6), 1268–1280. doi:https://doi.org/10.1016/j.ridd.2009.05.001
- Verbruggen, F., Aron, A. R., Band, G. P., Beste, C., Bissett, P. G., Brockett, A. T., … Boehler, C. N.(2019). A consensus guide to capturing the ability to inhibit actions and impulsive behaviors in the stop-signal task. ELife, 8, e46323. doi:https://doi.org/10.7554/eLife.46323
- Verbruggen, F., & Logan, G. D. (2008a). Automatic and controlled response inhibition: associative learning in the go/no-go and stop-signal paradigms. Journal of Experimental Psychology. General, 137(4), 649–672. doi:https://doi.org/10.1037/a0013170
- Verbruggen, F., & Logan, G. D. (2008b). Response inhibition in the stop-signal paradigm. Trends in Cognitive Sciences, 12(11), 418–424. doi:https://doi.org/10.1016/j.tics.2008.07.005
- Wechsler, D. (2011). Wechsler Abbreviated Scale of Intelligence–Second Edition (WASI-II). San Antonio, TX: NCS Pearson.
- Weigard, A., Heathcote, A., Matzke, D., & Huang-Pollock, C. (2019). Cognitive modeling suggests that attentional failures drive longer stop-signal reaction time estimates in attention deficit/hyperactivity disorder. Clinical Psychological Science, 7(4), 856–872. doi:https://doi.org/10.1177/2167702619838466
- Wickham, H., François, R., Henry., L., & Müller, K. (2020). dplyr: A grammar of data manipulation. R package version 1.0.2, retrieed from https://CRAN.R-project.org/package=dply
- Wilson, P. H., Maruff, P., Butson, M., Williams, J., Lum, J., Thomas, P. R. (2004). Internal representation of movement in children with developmental coordination disorder: A mental rotation task. Developmental Medicine and Child Neurology, 46(11), 754–759. doi:https://doi.org/10.1111/j.1469-8749.2004.tb00995.x
- Wilson, P. H., Maruff, P., & Lum, J. (2003). Procedural learning in children with developmental coordination disorder. Human Movement Science, 22(4), 515–526. doi:https://doi.org/10.1016/j.humov.2003.09.007
- Wilson, P. H., & McKenzie, B. E. (1998). Information processing deficits associated with developmental coordination disorder: A meta-analysis of research findings. The Journal of Child Psychology and Psychiatry and Allied Disciplines, 39(6), 829–840. doi:https://doi.org/10.1017/S0021963098002765
- Wilson, P. H., Ruddock, S., Smits‐Engelsman, B., Polatajko, H., & Blank, R. (2013). Understanding performance deficits in developmental coordination disorder: A meta-analysis of recent research. Developmental Medicine and Child Neurology, 55(3), 217–228. doi:https://doi.org/10.1111/j.1469-8749.2012.04436.x
- Wodushek, T. R., & Neumann, C. S. (2003). Inhibitory capacity in adults with symptoms of attention deficit/hyperactivity disorder (ADHD). Archives of Clinical Neuropsychology, 18(3), 317–330. doi:https://doi.org/10.1016/S0887-6177(02)00152-X
- Wolpert, D. M., Ghahramani, Z., & Jordan, M. I. (1995). An internal model for sensorimotor integration. Science, 269(5232), 1880–1882. doi:https://doi.org/10.1126/science.7569931