
ABSTRACT
In the present study, we investigated whether the longitudinal growth trajectories of executive functions (EF) and Attention-Deficit/Hyperactivity Disorder (ADHD) symptoms are related. In addition, we investigated whether negative discipline moderated these longitudinal relations. The sample consisted of predominantly clinically referred preschoolers (N = 248, age 42–66 months at Time 1; 79.0% boys). Assessment occurred three times: at baseline, at 9 months, and at 18 months. EF was assessed with five EF tasks. ADHD symptoms (Child Behavior Checklist 1.5–5) were reported by parents. Groups of medium to high and low negative discipline were based on mother- and father-reports (Parenting Practices Inventory). Growth curve models showed that EF generally increased and ADHD symptoms generally decreased over time. Parallel process models showed that there was no relation between the change in EF and the change in ADHD symptoms over time, suggesting no co-development. However, higher EF at baseline was related to lower ADHD symptoms at baseline. This was irrespective of whether children were exposed to high or low negative discipline. Overall, the results suggest that, while EF and ADHD symptoms are related, they develop independently across the preschool years.
Attention-Deficit/Hyperactivity Disorder (ADHD) is a commonly diagnosed neurodevelopmental disorder, of which symptoms are often already present in preschoolers (American Psychiatric Association, Citation2013). ADHD diagnosis (e.g., Schoemaker et al., Citation2012) and ADHD symptoms (e.g., Schoemaker, Mulder, Deković, & Matthys, Citation2013) in preschool children are known to be associated with executive function (EF) deficits. EF are neurocognitive processes necessary for goal-directed behavior, that are essential for many areas of individuals’ well-being and functioning (Diamond, Citation2013). EF are often conceptualized as a set of three distinct, but highly related abilities: working memory (i.e., one’s ability to work with information mentally), inhibitory control (i.e., one’s ability to override internal urges), and shifting (i.e., one’s ability to shift to new mental sets; Diamond, Citation2013; Miyake & Friedman, Citation2012). Despite quite consistent reports of an association between EF and ADHD symptoms, there is no consensus on the nature of this association. Specifically, the question remains whether changes in EF are related to the changes in ADHD symptoms. Especially in preschoolers, little research has been done on this relation. Further, little is known about how children’s social context might moderate associations between EF and ADHD symptoms. Diathesis stress models (Monroe & Simons, Citation1991) suggest that associations between children’s individual characteristics and developmental outcomes are expected to be strongest in riskier environments. Therefore, stronger associations between EF and ADHD symptoms likely emerge in a riskier parenting environment characterized by higher negative discipline. In the present study, we extended on previous literature by investigating the longitudinal associations between EF and ADHD symptoms in groups of predominantly clinically referred preschoolers exposed to either medium to high or low negative discipline.
EF and ADHD
There is an ongoing debate regarding the nature of the relation between EF and ADHD symptoms. Halperin and Schulz (Citation2006) have suggested that ADHD is caused by non-cortical neural dysfunction (e.g., basal ganglia; see meta-analysis of structural neuro-imaging studies by Nakao, Radua, Rubia, & Mataix-Cols, Citation2011), present early in life. The prefrontal cortex and related neural systems may compensate for these “deeper” dysfunctions, through “top-down” executive control. Thus, Halperin and Schultz (Citation2006) do not consider the prefrontal cortex to be a direct cause of ADHD, but they consider it to play a compensatory role for “deeper” dysfunctions. Therefore, children who show the greatest improvements in EF would be the ones with the highest chance for remission from ADHD later in development. A prospective study on adults (ages 21–28) diagnosed with ADHD when they were 7–11 years old (Schulz et al., Citation2017) offers some support for this hypothesis. Adults with persistent ADHD showed reduced prefrontal activation compared to adults with remitted ADHD and adults never diagnosed with ADHD. In addition, adults with remitted ADHD showed comparable prefrontal activation compared to adults never diagnosed with ADHD (Schulz et al., Citation2017). These findings provide some evidence that appropriate functioning of the prefrontal cortex may compensate for non-cortical dysfunctions.
However, a recent systematic literature review found little support for the hypothesis by Halperin and Schulz (Citation2006) in school-aged children, adolescents, and adults (Van Lieshout, Luman, Buitelaar, Rommelse, & Oosterlaan, Citation2013). The authors concluded that changes in neurocognitive functions such as EF do not lead to changes in ADHD symptoms. EF deficits and ADHD symptoms may simply coexist due to the same biological underpinnings, but changes in EF would not necessarily predict ADHD symptom changes. Indeed, EF did not predict ADHD remittance or persistence in boys aged 7 to 17 across ten years (Biederman et al., Citation2009), or in children aged 6 to 13 across five years (McAuley, Crosbie, Charach, & Schachar, Citation2014). Changes in EF also did not predict changes in ADHD symptoms in children aged 7 to 15 across four years (Coghill, Hayward, Rhodes, Grimmer, & Matthews, Citation2014).
Nevertheless, rejecting the hypothesis that changes in EF relate to changes in ADHD symptoms may be premature. In their original hypothesis, Halperin and Schulz (Citation2006) mainly focused on explaining the reduction of ADHD symptoms in adolescence. Few studies have tested their hypothesis in early childhood and no studies have investigated specifically whether change in EF is related to change in ADHD symptoms in preschoolers (Van Lieshout et al., Citation2013). However, if EF compensates for early non-cortical deficits, the development of EF may be particularly related to the development of ADHD in preschoolers. In preschoolers, EF develops rapidly (Garon, Bryson, & Smith, Citation2008; Schoemaker, Bunte, Espy, Deković, & Matthys, Citation2014), possibly even more so than at later ages (Zelazo & Carlson, Citation2012). It is also during the preschool years that ADHD is first emerging and that trajectories may be most variable (Lahey, Pelham, Loney, Lee, & Willcut, Citation2005). With rapidly developing EF and more variability in ADHD trajectories, associations between development in EF and in ADHD symptoms may be more salient in the preschool years particularly.
Indeed, in preschoolers specifically it has been found that early EF or specific aspects thereof predicted later ADHD symptoms, even while controlling for baseline ADHD symptoms (Campbell & von Stauffenberg, Citation2009; Rajendran et al., Citation2013a; Wåhlstedt, Thorell, & Bohlin, Citation2008). However, we cannot draw conclusions on whether EF and ADHD symptoms in preschoolers with ADHD develop concurrently based on these studies. Moreover, both in the study by Campbell and von Stauffenberg (Citation2009) and the study by Wåhlstedt et al. (Citation2008) nonclinical preschool children were included. A study by Rajendran et al. (Citation2013b) did investigate co-development between neuropsychological functioning (i.e., attention/executive functioning, language, visuospatial, sensorimotor, and memory) and ADHD symptoms in preschoolers with clinical levels of ADHD). There was co-development between neurocognitive functioning and ADHD symptoms in young children from roughly 4 to 8 years old, with children with more growth in neuropsychological functioning over time having greater diminution of ADHD symptoms. These findings suggest that greater improvements in neurocognitive functions are related to improvements in ADHD symptoms. However, these findings do not allow us to draw conclusions about whether this association between neurocognitive functioning and ADHD symptoms holds for EF specifically, since a very broad index of neurocognitive functioning was used. Halperin and Schulz (Citation2006) suggested that EF specifically would be related to improvements in ADHD symptoms, as EF might compensate for non-cortical neural dysfunction. Therefore, the co-development of EF, rather than a broad index of neurocognitive functioning, and ADHD symptoms should be investigated.
Moderating role of parenting
While EF and ADHD symptoms have been found to be associated to one another (Schoemaker et al., Citation2012), hardly any previous studies have investigated how environmental factors such as parenting might moderate the relation between EF and ADHD. However, there is theoretical and empirical reason to believe that this may be the case. According to diathesis stress models, child characteristics such as EF and environmental factors such as parenting interact in predicting developmental outcomes (Monroe & Simons, Citation1991). Specifically, diathesis stress models posit that associations between children’s characteristics and developmental outcomes are expected to be strongest in riskier environments. Considering the major role of parents in preschoolers’ social environment (Laible, Thompson, & Froimson, Citation2015), this may be particularly true for young children. A relatively slow development of EF may be more strongly related to the development of ADHD symptoms when children are in an environment characterized by negative and inconsistent parenting, compared to an environment with more adequate parenting. A negative parenting environment, after all, provides little structure and support for the child, making a relatively slow EF development that much more detrimental. Negative parental discipline (a parenting style marked by harsh and inconsistent discipline, such as discipline in the form of yelling, and threatening punishment, but not following through) specifically may be of great importance when looking at ADHD. This type of parenting has been found to be a predictor of externalizing behavior (Blader, Citation2006; Mrug & Windle, Citation2008) and to be an important treatment target in psychosocial interventions for externalizing behavior, including ADHD (Daley et al., Citation2014; Wyatt Kaminski, Valle, Filene, & Boyle, Citation2008). Negative parental discipline may therefore be an especially relevant moderator in the relation between EF and ADHD symptoms.
To our knowledge, no studies directly investigated the moderating effect of negative parental discipline on the relation between EF and ADHD symptoms. However, some empirical findings from the literature on childhood temperament, investigating similar concepts, do suggest that negative parental discipline may interact with EF in the prediction of ADHD outcomes. Specifically, previous findings suggest that relations between childhood temperamental factors such as effortful control (a concept closely related to EF; Nigg, Citation2016) and outcomes such as externalizing behavior are moderated by negative parental discipline. Children have been found to display more externalizing problems when they were low on effortful control compared to when they were high on effortful control, but only if they were exposed to high inconsistent parental discipline (Lengua, Citation2008). Further, at (very) low levels of parental responsiveness, children low on effortful control displayed higher levels of externalizing problems compared to children high on effortful control (Slagt, Dubas, & Van Aken, Citation2016). Other negative parenting dimensions (e.g., hostility and negative dominance) also appear to moderate the relations between difficult temperament/poor effortful control and externalizing problems (Pace, D’Urso, & Zappulla, Citation2018; Ryan & Ollendick, Citation2018; Van Aken, Junger, Verhoeven, van Aken, & Deković, Citation2007). Whereas none of these studies specifically looked at ADHD symptoms, findings are likely similar for ADHD symptoms, since externalizing behavior generally encompasses ADHD symptoms in early childhood (Liu, Citation2004) and symptoms of ADHD and other externalizing disorders are strongly related (Sterba, Egger, & Angold, Citation2007). Negative parental discipline may therefore be an important moderator in the relation between EF and ADHD symptoms.
The present study
Our first aim was to investigate the 18-month longitudinal associations between EF and ADHD symptoms in predominantly clinically referred preschoolers. It was expected that higher initial levels of EF would be related to higher initial levels of ADHD symptoms, as EF and ADHD symptoms have previously been found to be associated (e.g., Schoemaker et al., Citation2012, Citation2013). It was expected that EF would generally increase across time, as was previously found in a study with the present dataset (Schoemaker et al., Citation2014). Previous findings regarding the general stability of ADHD symptoms are somewhat mixed, but most point to either relative stability or slight decreases of ADHD symptoms or diagnosis (e.g., Harvey, Lugo-Candelas, & Breaux, Citation2014; Rajendran et al., Citation2013b), including one study with the present dataset (Bunte, Schoemaker, Hessen, Van der Heijden, & Matthys, Citation2014). We therefore expected ADHD symptoms to either generally stay relatively stable or slightly decrease. It was further expected that there would be co-development of EF and ADHD symptoms over time. Specifically, increases in EF are expected to be related to decreases in ADHD symptoms, as having stronger increases in EF would allow for more compensation of deeper ADHD-related deficits, resulting in decreases or at least less increases in ADHD symptoms over time (Halperin & Schulz, Citation2006).
Our second aim was to investigate whether mothers’ and fathers’ negative discipline moderates the longitudinal associations between changes in EF and changes in ADHD symptoms. Diathesis-stress models (Monroe & Simons, Citation1991) suggest that associations between child characteristics and adverse development are highest in riskier environments. Therefore, in a parenting context characterized by higher negative discipline, a stronger association between EF and ADHD symptoms was expected compared to a parenting context characterized by lower negative discipline.
We employed a latent variable approach to measure children’s EF. This was done because EF tasks are known to be “impure”: any specific EF task also measures non-EF processes (Miyake & Friedman, Citation2012). Therefore, a latent variable approach is necessary, in which several tasks measure EF components. For preschoolers, it is unclear whether EF is best conceptualized as a single construct or as separate components. Several studies that tested the factor structure of EF in preschoolers across time found that a unitary construct best represents EF (Hughes, Ensor, Wilson, & Graham, Citation2009; Willoughby, Blair, Wirth, & Greenberg, Citation2010). Whereas previous studies with the present study’s sample found that EF was best conceptualized using two separate components of working memory and inhibitory control (Schoemaker et al., Citation2014, Citation2012), the factor structure was never tested longitudinally. Therefore, we tested the factor structure of EF again, this time across time, to determine whether EF is best conceptualized as a unitary construct or as separate EF components in the study’s sample.
Method
Participants
Preschoolers’ data came from a longitudinal study conducted at the Outpatient Clinic for Preschool Children with Behavioral Problems, Department of Child and Adolescent Psychiatry, University Medical Center Utrecht (UMCU), The Netherlands (Schoemaker et al., Citation2014). Clinically referred children (n = 190) were included if they scored at or above the 90th percentile of the Attention Problems subscale or the Aggressive Behavior subscale of the CBCL1.5–5 (Achenbach & Rescorla, Citation2000; one CBCL form per child, filled out by either one parent or jointly by two parents). Children were diagnosed according to DSM-IV-TR criteria (American Psychiatric Association, Citation2000). For this, the procedure of best-estimate diagnosis was used, that is two clinicians unfamiliar with the child consider the information about the child, discuss all findings, and reach consensus. Diagnostic consensus was reached between a child psychiatrist and a clinical psychologist using the following data sources: scores within the clinical range on the Attention Problems scale of the CBCL and the Child Teacher Report Form; the symptoms reported on the Kiddie Disruptive Behavior Schedule (Keenan et al., Citation2007), a semistructured DSM-IV based parent interview for the assessment of ADHD in preschool children; the scores on the Child Global Assessment Schedule (Schaffer et al., Citation1983), a measure of the impairment of the functioning of the child, filled out by the parents as well as the teacher/caregiver; the observation of the child’s behavior using the Disruptive Behavior Diagnostic Observation Schedule (Bunte et al., Citation2013; Wakschlag et al., Citation2008), a structured observation that evaluates the child’s behavior during tasks systematically varying in the level of challenge and support.
At time one, 61 children were diagnosed with ADHD, 34 with Oppositional Defiant Disorder/Conduct Disorder (ODD/CD), 52 with both, and 43 referred children were not initially diagnosed. The sample additionally included 58 TD children, recruited from elementary schools and daycare centers. TD children were excluded if they scored at or above the 90th percentile of the Attention Problems subscale or the Aggressive Behavior subscale of the CBCL1.5–5. In both groups, children were excluded if they had an IQ below 70 or if they were diagnosed with another mental disorder than ADHD or ODD/CD. This resulted in a final sample of 248 preschoolers. The inclusion of children with ADHD, children with ODD/CD, TD children, and referred but not diagnosed children was done because ADHD exists on a continuum (Lubke, Hudziak, Derks, Van Bijsterveldt, & Boomsma, Citation2009) and ADHD symptoms and ODD/CD symptoms are highly correlated (Sterba et al., Citation2007). Using this diverse sample increased variability in ADHD symptoms.
Data was collected across three time points, with a nine-month interval between each measurement occasion. At time one, children were between 42 and 66 months (M = 54.57, SD = 7.60), 196 (79.0%) of the children were male, and children had an average IQ of 104.01 (SD = 12.91). Parental education level, for mothers and fathers respectively, was: 5.2% and 4.0% no high school diploma, 33.5% and 30.1% high school diploma, 24.6% and 25.0% vocational school diploma, 35.9% and 33.8% college diploma, and 0.8% and 6.5% unknown.
Attrition was low (8.1% of the children dropped out at T2 or T3) and children that dropped out after the first time point were still included in the final sample. There were no significant differences on age, sex, and the model variables between participants who missed at least one time point, except for the score on the Snack Delay task at T1, t(231) = 2.03, p = .043. Children who dropped out (M = −0.84, SD = 1.22) scored significantly lower than those who did not (M = −.15, SD = 1.10).
Procedure
At all three time points, assessments were done in a single morning session, lasting two hours including breaks. At the first assessment, IQ was estimated using the average of the scores on the Raven Colored Progressive Matrices (Raven, Court, & Raven, Citation1998) and the Peabody Picture Vocabulary Test-III-NL (Dunn & Dunn, Citation2005). Next, EF tasks were administered while a parent filled out questionnaires in the same room. Tasks were administered in a quiet room in a fixed order by a trained master’s student, and video-recorded. Parents received nominal financial compensations after each assessment and children received two small presents. The study was approved by the Medical Ethical Review Committee of the University Medical Center Utrecht.
Measures
Child EF
EF measures were adapted from the tasks used in Wiebe et al. (Citation2011). For each task, children completed practice trials to ensure they understood it. The task battery included tasks for working memory, inhibitory control, and cognitive flexibility. However, measures of cognitive flexibility (Extradimensional Reversal and Shape School – switch and inhibit switch condition) were not included in the current study, because of floor effects in this young age group. A previous study with the same data found no ceiling effects (i.e., more than 75% of the children achieving a maximum score) on any of the EF tasks (Schoemaker et al., Citation2014). Scores on the EF tasks were standardized prior to the analyses. Standardization was performed across the full sample and across time points, in order to preserve the relative differences in means across time.
Go/No-Go task. In this computerized task intended to measure inhibitory control, children were instructed to catch as many fish (Go stimuli, 75 trials) as possible by pressing a button when a fish appeared. They had to inhibit their response of pressing a button when a shark appeared (No-Go stimuli, 25 trials). Auditory feedback was provided when appropriately catching a fish or inappropriately catching a shark. Stimuli were presented for 1500 ms, with an inter-stimulus interval of 1000 ms. The variable used was the d-prime: the standardized difference between the hit rate and false alarm rate, which corrects for response biases common in children with relatively poor attentional deployment (i.e., preschoolers). This was calculated by subtracting the z-score value of the hit-rate (i.e., correct Go trials) from the z-score value of the false alarm rate (i.e., incorrect No-Go trials).
Modified Snack Delay. This newly developed task integrates the motivational context from the original Snack Delay paradigm (Kochanska, Murray, Jacques, Koenig, & Vandegeest, Citation1996) with the motor-inhibitory control demands of NEPSY Statue (Korkman, Kirk, & Kemp, Citation1998) in order to measure inhibitory control. Children had to stand still and keep their hands on a mat, without talking. A glass with a treat underneath and a bell were placed in front of them. Instructions were given that children could move and eat the treat when the instructor rang the bell. During 10 minutes, the instructor progressively distracted the child. Afterward, trained coders rated hand movement within 5 second intervals. No hand movement was given a score of 1, some hand movement 0.5, and lots of movement 0. Twenty-percent of the videos were double coded to establish inter-rater reliability (mean inter-rater agreement was 95%, 97.6%, and 96.6%, respectively for the first, second, and third assessment). The variable used was the total score of hand movement (range 0–48).
Shape School-Inhibit Condition. This computerized task contained cartoon characters in different colors, expressions, and shapes and intended to measure inhibitory control. Children had to name the color of characters with happy faces and suppress this color naming response for characters with sad/frustrated faces. The variable used was the number of correct responses (e.g., N = 6 of the total 18 trials).
Delayed Alternation. This task intended to measure working memory. Children had to find a treat underneath one of two identical cups. After retrieving it correctly, the treat went to the opposite side in the next trial. During the trials, there was a 10 second delay, during which the treat was hidden out of sight and the child was distracted by the examiner. A maximum of 16 trials was administered, or the trials were ended if children made 8 consecutive correct responses. The variable used was the number of correct retrievals divided by the number of trials.
Nine Boxes. This task also intended to measure working memory. Children had to find “Barbapapa” characters hidden in nine different colored boxes, all with different shapes on the lid. Each trial, children were allowed to open one box. Boxes were then shuffled out of the child’s sight during a 10 second interval. Trials were administered until children found all characters or made 5 consecutive mistakes (i.e., 20 trials maximum). The variable used was the number of correct retrievals, divided by the number of trials.
ADHD symptoms
ADHD symptoms were represented by scores on the Attention Problems subscale (nine items) of the Child Behavior Checklist (CBCL)1.5–5 (Achenbach & Rescorla, Citation2000). Parents reported on their children’s ADHD-related behaviors, as rated on a 3-point scale: (0 = Not true, 1 = Somewhat/sometimes true, 2 = Very/often true). On these scales, variables were represented by T-scores (transformed scores ranging from 50 to 100, with SD norm group = 10). Higher scores represent more problem behavior. Cronbach’s alphas ranged from .81 to .82. Prior to the analyses, scores were standardized across the full sample and across time points.
Negative discipline
To assess parenting, the Harsh and inconsistent discipline scale from The Parenting Practices Inventory (PPI; Webster-Stratton, Citation2001) was used. Parents answered 15 questions about their discipline strategies (e.g., “Raise your voice”) on a 7-point Likert scale (1 = Not (likely) at all to 7 = Always/very likely). Of the 248 children included in the study, 248 mothers and 225 fathers reported on their parenting behavior for at least one time point. Cronbach’s alphas ranged between .84 and .85 for mothers and between .79 and .81 for fathers. However, mother and father reports of negative discipline correlated significantly (rwave 1 = .30, p < .001; rwave 2 = .26, p < .001; rwave 1 = .31 p < .001). Internal consistency was adequate when mothers’ and fathers’ items were taken together in each wave (Cronbach’s alpha wave 1 = .84, Cronbach’s alpha wave 2 = .84, Cronbach’s alpha wave 3 = .86). Mother and father report across the three time-points were therefore collapsed to create one score representing negative discipline.
Parents reported an average of 2.77 (SD = 0.55) on negative discipline across the three timepoints. Subsequently, this scale was used to divide parents into two categories: low negative discipline (an average score below the mean of mothers and fathers together across the three timepoints, n = 141) and medium to high negative discipline (an average score equal to or above the mean of mothers and fathers across the three timepoints, n = 107).
Medication and psychosocial treatment
Several children received treatment after the first assessment. The number of months that children received medication and the number of psychosocial treatment sessions in between each time point were registered. No children received pharmacotherapy for their behavioral problems before the study. After the first time point, 75 children received medication: methylphenidate (n = 49 after T1, n = 71 after T2), atomoxetine (n = 3 after T2) and risperidone (n = 1 after T2). If children received methylphenidate or atomoxetine, parents were asked to stop medication 48 hours before assessments. A total of 173 (73.9%) children and their families received psychosocial treatment during their participation (i.e., individual counseling at home or at the outpatient clinic, and/or participation in the Incredible Years Parent Program; Webster-Stratton, Citation2001).
Statistical analyses
Factor structure and measurement invariance of EF across time
It was tested whether a one-factor model or a two-factor model (i.e., working memory and inhibitory control) of EF across time fitted the data better, using Mplus 8.2 (Muthén & Muthén, Citation2017). EF latent variables were allowed to correlate over time. Residuals of the observed EF task scores were also allowed to correlate over time. A non-significant difference in fit between the two models indicates that most parsimonious model (the one-factor model) should be chosen. We subsequently tested for metric invariance across time (i.e., equality constraints on factor loadings over time) against the unconstrained model, followed by scalar invariance (i.e., equality constraints over time on intercepts and factor loadings) against the metric model.
To account for non-normally distributed data, a maximum likelihood estimator with robust standard errors (MLR) was used. Model fit was considered acceptable if the comparative fit index (CFI) and the Tucker-Lewis Index (TLI) were above .90, and root-mean-square error (RMSEA) was below .08 (Byrne, Citation2012). Chi-square difference testing was used to assess significance of model fit change in nested model comparison. Because the estimator was MLR, the Sattora-Bentler Scaled Chi-Square Difference (TRd) test was used. This was calculated using the scaling correction factor (scf).
Univariate growth curves of EF and ADHD symptoms
Univariate growth curves for each of the outcome variables were estimated. Because the children varied considerably in age within the measurement waves, we estimated growth models with individual varying times of observation (i.e., the TSCORES option in Mplus). By doing this, biases are avoided in the growth factor variances, which could occur when fixed time intervals are applied to a sample that varies substantially in age (Mehta & West, Citation2000). Because of the use of individually varying times of observations, normal fit indices were not available. Therefore, Akaike Information Criterion (AIC) and Bayesian Information Criterion (BIC) were used to compare models. Higher BIC and AIC values indicate a worse model fit for the restricted model. The BIC index penalizes model complexity and is therefore considered a superior fit index to AIC. Decreases in BIC values larger than 10 indicate serious model improvements (Raftery, Citation1995). Considering the high number of preschoolers with a (comorbid) ODD diagnosis, ODD diagnosis was included as a control variable in the univariate and the multivariate models (i.e., a predictor of the intercept and slope of EF and ADHD symptoms). We did this only if ODD diagnosis significantly predicted either EF or ADHD symptoms to keep the models as parsimonious as possible. Due to the multilevel structure that defines the TSCORES option in Mplus, standardized coefficients were not available. For all models, we therefore reported the unstandardized coefficients.
Multivariate growth curves (parallel process model)
In a parallel process model, the two growth models of EF and ADHD symptoms are estimated simultaneously. The intercept and slope of EF and ADHD are allowed to covary, while controlling for ODD-diagnosis. Again, this was done while accounting for the individually varying times of observation with the TSCORES option in Mplus. Co-development of EF and ADHD symptoms is indicated when the slopes of EF and ADHD are significantly correlated.
Multigroup parallel process model
Multigroup parallel process models were performed to test for moderating effects of parents’ negative discipline (medium to high vs. low). These models were first run completely unconstrained across groups. Subsequently, a series of models was tested by fixing parameters to be equal across groups, one at a time (i.e., EF and ADHD variances, intercepts and linear slope of EF, intercept and slope of ADHD, correlations between intercepts and slopes). Each model was compared to the previous model, using AIC and BIC (lower AIC and BIC for the more constrained model indicates that the more constrained model is preferred). Parameters that were identified to differ between the groups were estimated freely in the final multigroup model.
Results
Factor structure
Descriptive statistics for the separate EF tasks can be found in Appendix A. There were no significant differences between the models of EF across time with a one-factor structure and a two-factor structure, Δχ2(TRd) = 7.72, Δdf = 7, p = .358. Therefore, we chose the model with the one-factor structure of EF. This model fitted the data well, χ2(72) = 64.86, p = .712, scf = 1.03, RMSEA = .00, CFI = 1.00, TLI = 1.01.
displays the estimated correlations, means and standard deviations of the latent variables with the z-scores of ADHD symptoms. Latent EF variables correlated, both concurrently and longitudinally, negatively with ADHD symptoms. Effect sizes were medium to large. Medication use was positively associated with ADHD symptoms and EF at all time points (small to medium effects). Number of treatment sessions was associated with ADHD symptoms at all time points (small to medium effects), but not with EF. Children in the medium to high negative discipline group showed more ADHD symptoms across the three timepoints than children in the low negative discipline group (see ). Children did not significantly differ in EF between groups across the three timepoints.
Table 1. Descriptive Statistics and Estimated Correlations of the Model Variables (N = 248).
Table 2. Independent Samples t-tests Comparing Low and Medium to high Negative Discipline Groups
In order to describe the general trends of EF and attention problems over time, one-way repeated measures ANOVAs were performed. EF significantly increased over time (λ = .40, F(2, 233) = 176.91, p < .001, η2 = .60), while attention problems significantly decreased over time (λ = 82, F(2, 211) = 23.84, p < .001, η2 = .18). Follow-up comparisons for both tests showed that each pairwise difference was significant p < .001-.002. Results show that EF significantly increased and ADHD symptoms significantly decreased across time, compared to each previous timepoint.
Measurement invariance in EF across time
The one-factor model of EF across time was used as the unconstrained model to test measurement invariance across time. A full metric model differed significantly from the unconstrained model, Δχ2(TRd) = 20.11, Δdf = 8, p = .010. After consulting the modification indices, the factor loading of Shape School at T1 was estimated freely. This partial metric model did not significantly differ from the unconstrained model, Δχ2(TRd) = 6.46, Δdf = 7, p = .487. A scalar model with the intercept of Shape School at T1 estimated freely differed significantly from the metric model, Δχ2(TRd) = 26.38, Δdf = 7, p < .001. After consulting the modification indices, the intercept of Snack Delay at T1 was estimated freely. This partial scalar model did not differ significantly from the metric model, Δχ2(TRd) = 5.35, Δdf = 6, p = .499, suggesting that partial measurement invariance holds across time for EF. The fit of this final model was good, χ2(85) = 76.68, p = .729, scf = 1.03, RMSEA = .00, CFI = 1.00, TLI = 1.01. This resulted in the measurement model depicted in .
Figure 1. Standardized coefficients of the longitudinal measurement model of EF. NB = Nine Boxes, DA = Delayed Alternations, GNG = Go/No-Go, SD = Snack Delay, SS = Shape School-Inhibitory condition. *p < .05, **p < .001
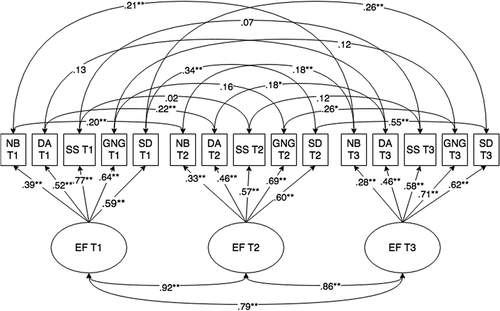
When we proceeded with the analyses, the latent variables caused inflated correlations across timepoints when other variables were included in the model (a common issue with Confirmatory Factor Analysis; Asparouhov & Muthén, Citation2009). It was therefore decided to run the latent EF models for each timepoint separately and save the effects coded factor scores from these separate models (i.e., constraining the set of indicator intercepts to sum to zero and the set of loadings to average 1 in order to maintain the factor metrics; Little, Slegers, & Card, Citation2006). Using effects coding was necessary to maintain the factor metrics of at each wave.
Univariate (separate) growth curves of EF and ADHD symptoms
Models with an intercept and a linear slope resulted in substantially lower AIC and BIC values compared to intercept-only models for both EF (ΔAIC = −238.75, ΔBIC = −228.21) and ADHD symptoms (ΔAIC = −55.22, ΔBIC = −43.68), indicating that adding a linear slope improves the univariate models for EF and ADHD symptoms. Because inspection of the means indicated that the growth of EF might be quadratic, a quadratic slope was added to the EF model. Because there were only three measurement occasions, the quadratic slope variance was fixed to 0, in order to make model estimation possible. It is common to restrict the quadratic slope variance to zero, even in models with more measurement occasions, because the variance of the quadratic slope can rarely be estimated (Tofighi & Enders, Citation2007). This resulted in a better fitting model compared to the model with only an intercept and a linear slope (ΔAIC = −96.58, ΔBIC = −93.07), indicating that adding a quadratic slope improved the univariate EF model. ODD diagnosis did not significantly predict EF intercept (b = −0.08, p = .363) or linear slope (b = −0.02, p = .599), so ODD diagnosis was omitted as a predictor in the final univariate EF model. ODD diagnosis did significantly predict ADHD symptom intercept (b = 0.40, p = .013), but not the linear slope (b = 0.06, p = .417). It was decided to use the model with ODD diagnosis as a control variable as the final univariate model for ADHD symptoms.
In the final univariate models, EF showed an average increase that decelerated over time (intercept = 1.06, p < .001; linear slope = 0.93, p < .001; quadratic slope = −0.15, p < .001). The intercept and the slope were significantly correlated, cov = −0.05, p = .017, indicating that higher initial level of EF was associated with a lower rate of change in EF. Individuals differed significantly in EF levels at baseline (variance intercept = 0.21, p < .001), but not in the rate by which EF changed over time (variance linear slope = 0.01, p = .293). However, the traditional distribution of the test statistics used in most structural equation modeling software such as Mplus results in too-conservative hypothesis tests for boundary parameters such as intercept and slope variances in growth models (i.e., inaccurate and too large p values; Dominicus, Skrondal, Gjessing, Pedersen, & Palmgren, Citation2006; Stoel, Garre, Dolan, & van den Wittenboer, Citation2006). Therefore, non-significant intercept or slope variance in growth models cannot immediately be interpretated as reflecting a lack of variance. To check whether the non-significant EF slope variance really did reflect a lack of substantial variance, we calculated the individual slopes of EF for participants with an EF slope score of two standard deviations above and two standard deviations below the average slope. In this way, we estimated the range of slope values for most children in the sample (95.4%). See Appendix B for a more detailed explanation and the resulting calculations.
Overall, individual EF slopes were estimated to fall in between 0.906 and 1.620 for 95.4% of the children in this sample (Appendix B). In comparison, the total range of EF slopes across waves was 2.780 (i.e., −2.040–0.740). This means that the individual slope range is 25.7% of the total EF range in this sample. Consequently, there seems to be substantial variation in the slopes of EF. Rate of change by which EF changes over time appeared to differ substantially across individuals.
ADHD symptoms showed an average decrease over time (intercept = 0.29, p = .008; slope = −0.25, p < .001). The intercept and the slope were not significantly correlated, b = −0.04, p = .442, indicating that the initial level of ADHD symptoms was not associated with the rate of change in ADHD symptoms. Individuals differed significantly in ADHD symptoms at baseline (variance intercept = 0.78, p < .001), but not in the rate by which ADHD symptoms changed over time (variance linear slope = 0.02; p = .490). Again, due to too conservative p-values, non-significant slope variance could not immediately be interpretated as reflecting a lack of slope variance.
Individual ADHD slopes were estimated to fall in between −3.068 and −1.808 for 95.4% of the children in this sample (see Appendix B). In comparison, the total range of ADHD scores across waves was 3.17 (i.e., −1.260–1.910). This means that the individual slope range is 29.5% of the total EF range in this sample. Consequently, there seems to be substantial variation in the slopes of ADHD. Rate of change by which ADHD symptoms change over time appeared to differ substantially across individuals.
Multivariate growth curves (parallel process model)
After determining the shape of growth in ADHD symptoms and EF, multivariate growth curve models were estimated. The parallel process model showed similar results for the mean slopes and intercepts of both EF and ADHD symptoms as the univariate models (see ). The negative correlations of the intercepts indicated that higher EF at baseline was associated with lower ADHD symptoms at baseline. The intercept of EF did not correlate with the slope of ADHD symptoms, and the intercept of ADHD symptoms did not correlate with the slope of EF. The linear slopes of EF and ADHD symptoms did not significantly correlate with each other. Thus, although EF and ADHD levels were associated with each other at baseline, no evidence for co-development of ADHD and EF was found.
Table 3. Results of the multivariate growth curve (parallel process) model using EF and ADHD symptoms
Multigroup parallel process model
displays the model fit indices and model comparisons for the multigroup parallel process models with negative discipline as a grouping variable. A fully constrained model fitted the data better than a fully unconstrained model. Releasing coefficients individually resulted in only one significant increase in model fit, namely the model in which the mean and variance of the intercept of ADHD was allowed to differ between groups (Model 7). This was the final multigroup parallel process model. The results are displayed in . Children exposed to medium to high negative discipline showed more ADHD symptoms at the first measurement occasion, compared to children exposed to low negative discipline. Further, initial levels of ADHD symptoms differed less across children in the medium to high negative discipline group, compared to the low negative discipline group. Growth factor correlations for the multigroup models are displayed in . There appeared to be no co-development in either the low or the medium to high negative discipline group.
Table 4. Model fit indices and model comparison tests for the multigroup models
Table 5. Results of the Multigroup Parallel Process Model (PPM) using EF and ADHD symptoms
Discussion
In the present study, we investigated whether longitudinal growth trajectories of EF and ADHD symptoms are related to each other. In addition, we investigated whether negative discipline moderates these longitudinal relations. It was expected that there would be co-development of EF and ADHD symptoms over time, with stronger increases in EF being related to decreases in ADHD symptoms. We also expected that parenting characterized by higher negative discipline would strengthen associations between change in EF and change in ADHD symptoms. In a sample of predominantly clinic-referred preschool children, we found that EF generally increased over time and that ADHD symptoms generally decreased over time. The rate by which EF and ADHD symptoms changed also differed substantially across individuals. Higher EF at baseline was related to lower ADHD symptoms at baseline. However, we found no relation between change in EF and change in ADHD symptoms over time, suggesting there was no co-development. Although children exposed to medium to high negative discipline showed more ADHD symptoms at the first measurement occasion, compared to children exposed to low negative discipline, the relation between change in EF and change in ADHD symptoms did not differ between children exposed to medium to high and low negative discipline.
Individual trajectories of EF and ADHD symptoms
The finding that EF generally increases over time is in line with our hypothesis, theory of EF development (Diamond, Citation2013) as well as previous studies showing that EF develops rapidly during the preschool years (see Garon et al., Citation2008 for an overview). Our findings also suggested that the growth in EF abilities becomes less strong over time as children get older, which is what a previous study with the present dataset already suggested (Schoemaker et al., Citation2014). This is also in line with previous findings that inhibitory control (a specific aspect of effortful control) increases over time, with this increase generally decelerating (Geeraerts et al., Citation2020).
The fact that ADHD symptoms generally decreased is consistent with some previous findings (Bunte et al., Citation2014; Rajendran et al., Citation2013b). In the current sample, the fact that most of the preschoolers were under care may have contributed to this general decrease in symptoms. While we controlled for medication use and psychosocial treatment in between the different measurement occasions, this would still have affected the general trajectory of ADHD symptom development.
Lack of co-development between EF and ADHD symptoms
Overall, our findings offer no support for the hypothesis by Halperin and Schulz (Citation2006) that improvements in EF relate to decreases in ADHD symptoms. Neither baseline EF nor the growth trajectory of EF predicted changes in ADHD symptoms over time. Our findings contradict previous findings, in which co-development was found between neuropsychological functioning and ADHD symptoms in young children from 4 to 8 years old (Rajendran et al., Citation2013b). In our study, the period of time across which EF and ADHD symptoms were assessed was relatively short (i.e., three assessments across 18 months), compared to previous studies such as Rajendran et al. (Citation2013b; i.e., four assessments across roughly four years). This relatively short time span may have limited our ability to detect variability in EF and ADHD symptom development.
Another explanation for these contradicting findings might be the difference in measurements. Rajendran et al. (Citation2013b) looked at a broad measure of neuropsychological functioning and not EF specifically. This broad measure included measures of attention, which is very closely related to ADHD symptoms. This may have inflated any effects. However, when looking at EF (i.e., higher neurocognitive functions), the current study indicates that there is no co-development with ADHD symptoms, even though EF and ADHD symptoms are related at baseline. This is in line with the conclusions from a recent literature review on the role of neurocognitive functioning in the persistence of ADHD (Van Lieshout et al., Citation2013), which found insufficient evidence for the hypothesis that improvements in EF relate to decreases in ADHD symptoms in school-aged children, adolescents, and adults. Our findings suggest that this may be similar in the preschool years and that, while EF and ADHD symptoms are related, the compensatory role of EF on ADHD development is not present in the preschool years.
Lack of a moderating role of parenting
Co-development between EF and ADHD also did not emerge for children who were exposed to medium to high negative discipline. This is not in line with diathesis stress models (Monroe & Simons, Citation1991), which suggest that associations between individual vulnerabilities and adverse outcomes are expected to become stronger in risky environments. However, it is possible that diathesis stress models are not the appropriate theoretical frameworks to describe the role of the environment in the associations between EF and ADHD symptom trajectories, and that these association do emerge if we look at parenting environment in a different way. A recent study concluded that, instead of a diathesis stress model, a vantage sensitivity model (which posits that some individuals show heightened sensitivity to exclusively positive environmental influences) appeared to be the best framework to describe how parenting practices and inhibitory control interact to predict ADHD symptoms (Rioux et al., Citation2020). Specifically, negative parenting characteristics did not moderate the relation between inhibitory control and ADHD symptoms, but positive parenting characteristics did. Only for children with high levels of inhibitory control, higher positive parenting predicted lower ADHD symptoms. These findings suggest that at least one aspect of EF (inhibitory control) might have a compensatory role for ADHD symptoms, but only if children grow up in a positive parenting environment. Future research should investigate whether co-development between EF and ADHD symptoms indeed emerges in more positive parenting environments.
Strengths and limitations
An important strength of the present study is that data from multiple sources was used, including laboratory assessment and parenting report. Moreover, both mothers’ and fathers’ discipline strategies were considered to assess the moderating role of parenting in associations between EF and ADHD symptoms. This gives a more complete estimation of the parenting environment that children were exposed to than if we had used only mother-reported parenting, which many studies rely on (Martin, Ryan, & Brooks-Gunn, Citation2007). Another strength of the present study is the use of the heterogeneous sample of predominantly clinically referred and diagnosed preschoolers. The use of latent variables to measure EF was also a strength of the present study. Because of the “impurity” of EF tasks, this approach can be used to acquire a more accurate estimation of EF compared to a single EF task (Miyake & Friedman, Citation2012).
Some limitations of the present study should also be kept in mind. First, the use of parent-report to assess negative parental discipline may have led to an underestimation of negative discipline due to social desirability and biases related to self-report methods (Morsbach & Prinz, Citation2006). However, observational methods may also lead to more socially desirable behavior when participants are aware of being observed. Hence, future research should aim to include multiple methods to measure parenting behavior. Second, we focused on a very broad estimation of negative discipline and aggregated data of both mothers and fathers across the 18-months that the study was conducted. Because we used this broad estimation, we can only draw conclusions about the moderating role of parenting in a very general sense (i.e., general parenting environment across the duration of the study). Third, EF tasks were administered during a relatively short period of time (three times within 18 months) and we therefore cannot rule out the possibility of practice effects causing some of the EF increases. Lastly, no causal conclusions can be draw from the present study. In future research, experimental designs in the form of randomized controlled trails for interventions could be conducted (e.g., if an intervention specifically designed to improve EF in preschoolers with ADHD also reduces their ADHD symptoms, this could provide stronger indications of causality).
Conclusion
Taken together, our findings suggest that EF do not play a compensatory role in the development of ADHD as hypothesized by Halperin and Schulz (Citation2006). This is in line with conclusions in the review by Van Lieshout et al. (Citation2013). Although EF and ADHD symptoms are related to each other (i.e., children with lower EF typically show more ADHD symptoms), EF and ADHD symptoms develop independently of each other. This was the case, irrespective of whether children were exposed to medium to high or low negative discipline. Future studies should pay more attention to the positive parenting environment, because a vantage sensitivity model, rather than a diathesis stress model, may better describe how parenting practices and EF interact in predicting ADHD symptoms (Rioux et al., Citation2020). Our findings fit within the broader line of research demonstrating that EF and ADHD are indeed related, but develop independently.
Acknowledgments
S.B. Geeraerts is part of the Consortium on Individual Development (CID). CID is funded through the Gravitation program of the Dutch Ministry of Education, Culture, and Science and the Netherlands Organization for Scientific Research (NWO grant number 024.001.003).
Disclosure statement
No potential conflict of interest was reported by the authors.
Additional information
Funding
References
- Achenbach, T. M., & Rescorla, L. A. (2000). Manual for the ASEBA preschool forms and profiles. Burlington: University of Vermont, Research Center for Children, Youth, and Families.
- American Psychiatric Association. (2013). Diagnostic and statistical manual of mental disorders: DSM-5. Washington, D.C: Author.
- Asparouhov, T., & Muthén, B. (2009). Exploratory structural equation modeling. Structural Equation Modeling: A Multidisciplinary Journal, 16(3), 397–438. doi:https://doi.org/10.1080/10705510903008204
- Association, A. P. (2000). Diagnostic and statistical manual of mental disorders (4th ed., Text Revision ed.). Washington, DC: Author.
- Biederman, J., Petty, C. R., Ball, S. W., Fried, R., Doyle, A. E., Cohen, D., … Faraone, S. V. (2009). Are cognitive deficits in attention deficit/hyperactivity disorder related to the course of the disorder? A prospective controlled follow-up study of grown up boys with persistent and remitting course. Psychiatry Research, 170(2–3), 177–182. doi:https://doi.org/10.1016/j.psychres.2008.09.010
- Blader, J. C. (2006). Which family factors predict children’s externalizing behaviors following discharge from psychiatric inpatient treatment? Journal of Child Psychology and Psychiatry, 47(11), 1133–1142. doi:https://doi.org/10.1111/j.1469-7610.2006.01651.x
- Bunte, T. L., Laschen, S., Schoemaker, K., Hessen, D. J., van der Heijden, P. G. M., & Matthys, W. (2013). Clinical usefulness of observational assessment in the diagnosis of DBD and ADHD in preschoolers. Journal of Clinical Child and Adolescent Psychology, 42(6), 749–761. doi:https://doi.org/10.1080/15374416.2013.773516
- Bunte, T. L., Schoemaker, K., Hessen, D. J., Van der Heijden, P. G. M., & Matthys, W. (2014). Stability and change of ODD, CD and ADHD diagnosis in referred preschool children. Journal of Abnormal Child Psychology, 42(7), 1213–1224. doi:https://doi.org/10.1007/s10802-014-9869-6
- Byrne, B. M. (2012). Structural equation modeling with Mplus: Basic concepts, applications, and programming. New York, NY: Taylor & Francis.
- Campbell, S. B., & von Stauffenberg, C. (2009). Delay and inhibition as early predictors of ADHD symptoms in third grade. Journal of Abnormal Child Psychology, 37(1), 1–15. doi:https://doi.org/10.1007/s10802-008-9270-4
- Coghill, D. R., Hayward, D., Rhodes, S. M., Grimmer, C., & Matthews, K. (2014). A longitudinal examination of neuropsychological and clinical functioning in boys with attention deficit hyperactivity disorder (ADHD): Improvements in executive functioning do not explain clinical improvement. Psychological Medicine, 44(5), 1087–1099. doi:https://doi.org/10.1017/S0033291713001761
- Daley, D., van der Oord, S., Ferrin, M., Danckaerts, M., Doepfner, M., Cortese, S., & Sonuga-Barke, E. J. S. (2014). Behavioral interventions in Attention-Deficit/Hyperactivity Disorder: A meta-analysis of randomized controlled trials across multiple outcome domains. Journal of the American Academy of Child & Adolescent Psychiatry, 53(8), 835–847.e5. doi:https://doi.org/10.1016/j.jaac.2014.05.013
- Diamond, A. (2013). Executive functions. Annual Review of Psychology, 64(1), 135–168. doi:https://doi.org/10.1146/annurev-psych-113011-143750
- Dominicus, A., Skrondal, A., Gjessing, H. K., Pedersen, N. L., & Palmgren, J. (2006). Likelihood Ratio Tests in Behavioral Genetics: Problems and Solutions. Behavior Genetics, 36(2), 331–340. doi:https://doi.org/10.1007/s10519-005-9034-7
- Dunn, L. M., & Dunn, L. M. (2005). Peabody picture vocabulary test (III-NL) [Dutch version by L. Schichtling]. Amsterdam, The Netherlands: Hartcourt Assessment.
- Garon, N., Bryson, S. E., & Smith, I. M. (2008). Executive function in preschoolers: A review using an integrative framework. Psychological Bulletin, 134(1), 31–60. doi:https://doi.org/10.1037/0033-2909.134.1.31
- Geeraerts, S. B., Endendijk, J. J., Deković, M., Huijding, J., Deater‐Deckard, K., & Mesman, J. (2020). Inhibitory control across the preschool years: Developmental changes and associations with parenting. Child Development. Advance online publication. doi: https://doi.org/10.1111/cdev.13426.
- Halperin, J. M., & Schulz, K. P. (2006). Revisiting the role of the prefrontal cortex in the pathophysiology of attention-deficit/hyperactivity disorder. Psychological Bulletin, 132(4), 560–581. doi:https://doi.org/10.1037/0033-2909.132.4.560
- Harvey, E. A., Lugo-Candelas, C. I., & Breaux, R. P. (2014). Longitudinal changes in individual symptoms across the preschool years in children with ADHD. Journal of Clinical Child & Adolescent Psychology, 44(4), 580–594. doi:https://doi.org/10.1080/15374416.2014.886253
- Hughes, C., Ensor, R., Wilson, A., & Graham, A. (2009). Tracking executive function across the transition to school: A latent variable approach. Developmental Neuropsychology, 35(1), 20–36. doi:https://doi.org/10.1080/87565640903325691
- Keenan, K., Wakschlag, L. S., Danis, B., Hill, C., Humphries, M., Duax, J., & Donald, R. (2007). Further evidence of the reliability and validity of DSM-IV ODD and CD in preschool children. Journal of American Academy of Child and Adolescent Psychiatry, 46(4), 457–468. doi:https://doi.org/10.1097/CHI.0b013e31803062d3
- Kochanska, G., Murray, K., Jacques, T. Y., Koenig, A. L., & Vandegeest, K. A. (1996). Inhibitory control in young children and its role in emerging internalization. Child Development, 67(2), 490–507. doi:https://doi.org/10.1111/j.1467-8624.1996.tb01747.x
- Korkman, M., Kirk, U., & Kemp, S. (1998). NEPSY: A developmental neuropsychological assessment. Boston, MA: The Psychological Association.
- Lahey, B. B., Pelham, W. E., Loney, J., Lee, S. S., & Willcutt, E. (2005). Instability of the DSM-IV subtypes of ADHD from preschool through elementary school. Archives of General Psychiatry, 62(8), 896. doi:https://doi.org/10.1001/archpsyc.62.8.896
- Laible, D., Thompson, R. A., & Froimson, J. (2015). Early Socialization: The influence of close relationships. In J. Grusec & P. Hastings (Eds.), Handbook of Socialization (2nd ed. ed., pp. 35–59). New York, NY: Guilford Press.
- Lengua, L. J. (2008). Anxiousness, frustration, and effortful control as moderators of the relation between parenting and adjustment in middle-childhood. Social Development, 17(3), 554–577. doi:https://doi.org/10.1111/j.1467-9507.2007.00438.x
- Little, T. D., Slegers, D. W., & Card, N. A. (2006). A non-arbitrary method of identifying and scaling latent variables in SEM and MACS models. Structural Equation Modeling: A Multidisciplinary Journal, 13(1), 59–72. doi:https://doi.org/10.1207/s15328007sem1301_3
- Liu, J. (2004). Childhood externalizing behavior: Theory and implications. Journal of Child and Adolescent Psychiatric Nursing, 17(3), 93–103. doi:https://doi.org/10.1111/j.1744-6171.2004.tb00003.x
- Lubke, G. H., Hudziak, J. J., Derks, E. M., Van Bijsterveldt, T. C. E. M., & Boomsma, D. I. (2009). Maternal ratings of attention problems in ADHD: Evidence for the existence of a continuum. Journal of the American Academy of Child & Adolescent Psychiatry, 48(11), 1085–1093. doi:https://doi.org/10.1097/chi.0b013e3181ba3dbb
- Martin, A., Ryan, R. M., & Brooks-Gunn, J. (2007). The joint influence of mother and father parenting on child cognitive outcomes at age 5. Early Childhood Research Quarterly, 22(4), 423–439. doi:https://doi.org/10.1016/j.ecresq.2007.07.001
- McAuley, T., Crosbie, J., Charach, A., & Schachar, R. (2014). The persistence of cognitive deficits in remitted and unremitted ADHD: A case for the state-Independence of response inhibition. Journal of Child Psychology and Psychiatry, 55(3), 292–300. doi:https://doi.org/10.1111/jcpp.12160
- Mehta, P. D., & West, S. G. (2000). Putting the individual back into individual growth curves. Psychological Methods, 5(1), 23–43. doi:https://doi.org/10.1037/1082-989x.5.1.23
- Miyake, A., & Friedman, N. P. (2012). The nature and organization of individual differences in executive functions. Current Directions in Psychological Science, 21(1), 8–14. doi:https://doi.org/10.1177/0963721411429458
- Monroe, S. M., & Simons, A. D. (1991). Diathesis-stress theories in the context of life stress research: Implications for the depressive disorders. Psychological Bulletin, 110(3), 406–425. doi:https://doi.org/10.1037/0033-2909.110.3.406
- Morsbach, S. K., & Prinz, R. J. (2006). Understanding and improving the validity of self-report of parenting. Clinical Child and Family Psychology Review, 9(1), 1–21. doi:https://doi.org/10.1007/s10567-006-0001-5
- Mrug, S., & Windle, M. (2008). Mediators of neighborhood influences on externalizing behavior in preadolescent children. Journal of Abnormal Child Psychology, 37(2), 265–280. doi:https://doi.org/10.1007/s10802-008-9274-0
- Muthén, L. K., & Muthén, B. O. (2017). Mplus User’s Guide (6th ed. Sixth Edition ed.). Los Angeles, CA: Muthén & Muthén.
- Nakao, T., Radua, J., Rubia, K., & Mataix-Cols, D. (2011). Gray matter volume abnormalities in ADHD: Voxel-based meta-analysis exploring the effects of age and stimulant medication. American Journal of Psychiatry, 168(11), 1154–1163. doi:https://doi.org/10.1176/appi.ajp.2011.11020281
- Nigg, J. T. (2016). Annual Research Review: On the relations among self-regulation, self-control, executive functioning, effortful control, cognitive control, impulsivity, risk-taking, and inhibition for developmental psychopathology. Journal of Child Psychology and Psychiatry, 58(4), 361–383. doi:https://doi.org/10.1111/jcpp.12675
- Pace, U., D’Urso, G., & Zappulla, C. (2018). Adolescent effortful control as moderator of father’s psychological control in externalizing problems: A longitudinal study. The Journal of Psychology, 152(3), 164–177. doi:https://doi.org/10.1080/00223980.2017.1419160
- Raftery, A. E. (1995). Bayesian model selection in social research. Sociological Methodology, 25, 111–164. doi:https://doi.org/10.2307/271063
- Rajendran, K., Rindskopf, D., O’Neill, S., Marks, D. J., Nomura, Y., & Halperin, J. M. (2013a). Neuropsychological functioning and severity of ADHD in early childhood: A four-year cross-lagged study. Journal of Abnormal Psychology, 122(4), 1179–1188. doi:https://doi.org/10.1037/a0034237
- Rajendran, K., Trampush, J. W., Rindskopf, D., Marks, D. J., O’Neill, S., & Halperin, J. M. (2013b). Association between variation in neuropsychological development and trajectory of ADHD severity in early childhood. American Journal of Psychiatry, 170(10), 1205–1211. doi:https://doi.org/10.1176/appi.ajp.2012.12101360
- Raven, J. C., Court, J. H., & Raven, J. (1998). Raven Coloured Progressive Matrices. Oxford, England: Oxford Psychologist Press.
- Rioux, C., Murray, J., Castellanos-Ryan, N., Séguin, J. R., Tremblay, R. E., & Parent, S. (2020). Moderation of parenting by inhibitory control in the prediction of the common and unique variance of hyperactivity-impulsivity and inattention. Development and Psychopathology, 32(3), 909–921. doi:https://doi.org/10.1017/s0954579419000774
- Ryan, S. M., & Ollendick, T. H. (2018). The Interaction between child behavioral inhibition and parenting behaviors: Effects on internalizing and externalizing symptomology. Clin Child Fam Psychol Rev, 21(3), 320–339. doi:https://doi.org/10.1007/s10567-018-0254-9
- Schaffer, D., Goud, M. S., Brasic, J., Ambrosini, P., Fisher, P., Bird, H., & Aluwhalia, S. (1983). A children’s global assessment scale (C-GAS). Archives of General Psychiatry, 40(11), 1228–1231. doi:https://doi.org/10.1001/archpsyc.1983.01790100074010
- Schoemaker, K., Bunte, T., Espy, K. A., Deković, M., & Matthys, W. (2014). Executive functions in preschool children with ADHD and DBD: An 18-month longitudinal study. Developmental Neuropsychology, 39(4), 302–315. doi:https://doi.org/10.1080/87565641.2014.91187
- Schoemaker, K., Bunte, T., Wiebe, S. A., Espy, K. A., Deković, M., & Matthys, W. (2012). Executive function deficits in preschool children with ADHD and DBD. Journal of Child Psychology and Psychiatry, 53(2), 111–119. doi:https://doi.org/10.1111/j.1469-7610.2011.02468.x.
- Schoemaker, K., Mulder, H., Deković, M., & Matthys, W. (2013). Executive functions in preschool children with externalizing behavior problems: A meta-analysis. Journal of Abnormal Child Psychology, 41(3), 457–471. doi:https://doi.org/10.1007/s10802-012-9684-x
- Schulz, K. P., Li, X., Clerkin, S. M., Fan, J., Berwid, O. G., Newcorn, J. H., & Halperin, J. M. (2017). Prefrontal and parietal correlates of cognitive control related to the adult outcome of attention-deficit/hyperactivity disorder diagnosed in childhood. Cortex, 90, 1–11. doi:https://doi.org/10.1016/j.cortex.2017.01.019
- Slagt, M., Semon Dubas, J., & van Aken, M. A. G. (2016). Differential susceptibility to Parenting in middle childhood: Do impulsivity, effortful control and negative emotionality indicate susceptibility or vulnerability? Infant and Child Development, 25(4), 302–324. doi:https://doi.org/10.1002/icd.1929
- Sterba, S., Egger, H. L., & Angold, A. (2007). Diagnostic specificity and nonspecificity in the dimensions of preschool psychopathology. Journal of Child Psychology and Psychiatry, 48, 1005–1013. doi:https://doi.org/10.1111/j.1469-7610.2007.01770.x
- Stoel, R. D., Garre, F. G., Dolan, C., & van den Wittenboer, G. (2006). On the likelihood ratio test in structural equation modeling when parameters are subject to boundary constraints. Psychological Methods, 11(4), 439–455. doi:https://doi.org/10.1037/1082-989x.11.4.439
- Tofighi, D., & Enders, C. K. (2007). Identifying the correct number of classes in growth mixture models. In G. R. Hancock (Ed.), Advances in latent variable mixture models (pp. 317-341). Charlotte, NC: Information Age.
- Van Aken, C., Junger, M., Verhoeven, M., van Aken, M. A. G., & Deković, M. (2007). The interactive effects of temperament and maternal parenting on toddlers’ externalizing behaviours. Infant and Child Development, 16(5), 553–572. doi:https://doi.org/10.1002/icd.529
- Van Lieshout, M., Luman, M., Buitelaar, J., Rommelse, N. N. J., & Oosterlaan, J. (2013). Does neurocognitive functioning predict future or persistence of ADHD? A systematic review. Clinical Psychology Review, 33(4), 539–560. doi:https://doi.org/10.1016/j.cpr.2013.02.003
- Wåhlstedt, C., Thorell, L. B., & Bohlin, G. (2008). ADHD symptoms and executive function impairment: Early predictors of later behavioral problems. Developmental Neuropsychology, 33(2), 160–178. doi:https://doi.org/10.1080/87565640701884253
- Wakschlag, L. S., Briggs-Gowan, M. J., Hill, C., Danis, B., Leventhal, B. L., Keenan, … Carter, A. S. (2008). Observational assessment of preschool disruptive behavior, part II: Validity of the disruptive behavior diagnostic observation schedule (DB-DOS). Journal of the American Academy of Child & Adolescent Psychiatry, 47(6), 632–641. doi:https://doi.org/10.1097/chi.0b013e31816c5c10
- Webster-Stratton, C. (2001). Parenting practices interview: Unpublished assessment instrument. Retrieved from http://www.son.washington.edu/centers/parenting-clinic/forms.asp.
- Wiebe, S. A., Sheffield, T., Nelson, J. M., Clark, C. A. C., Chevalier, N., & Espy, K. A. (2011). The structure of executive function in 3-year-olds. Journal of Experimental Child Psychology, 108, 436–452. doi:https://doi.org/10.1016/j.jecp.2010.08.008
- Willoughby, M. T., Blair, C. B., Wirth, R. J., & Greenberg, M. (2010). The measurement of executive function at age 3 years: Psychometric properties and criterion validity of a new battery of tasks. Psychological Assessment, 22(2), 306–317. doi:https://doi.org/10.1037/a0018
- Wyatt Kaminski, J., Valle, L. A., Filene, J. H., & Boyle, C. L. (2008). A meta-analytic review of components associated with parent training program effectiveness. Journal of Abnormal Child Psychology, 36(4), 567–589. doi:https://doi.org/10.1007/s10802-007-9201-9
- Zelazo, P. D., & Carlson, S. M. (2012). Hot and cool executive function in childhood and adolescence: Development and plasticity. Child Development Perspectives, (6), 354–360. doi:https://doi.org/10.1111/j.1750-8606.2012.00246.x