Abstract
Hemoglobin (Hb) is an oligomeric protein, composed of four monomeric subunits. Hb molecule may undergo dissociation from a single native tetramer to two dimmers, which is called hemoglobin dissociation. In this article the dissociation of bovine Hb is studied by measurment of the average MW of the samples using the multiangle laser light-scattering method. Advanced multiangle laser light-scattering technique is a powerful method to determine the absolute molecular weights of the protein in solution. Two different methods, microbatch multiangle light-scattering (MALS) and on-line size-exclusion high-performance liquid chromatography light scattering with refractive index detector, are used to measure the average molecular weight of bovine Hb in different concentration respectively. The results of the two methods are agreed well. From the results, it can be concluded that the average molecular weigh of bovine Hb will be about 54 kDa when the bovine Hb concentration is more than 1.5 mg/mL, and will be about 36 kDa when the concentration is less than 0.03 mg/mL. The other conclusion, which can be derived from these results, is that the dissociation of bovine Hb is related with the pH and the tetramer appears to be more stable in the pH range of 6–9.
Introduction
Hemoglobin is the natural oxygen carrier of the red blood cell. It is a complex protein, made up of four subunit polypeptide chains, 2α and 2β. 1α and 1β combine to form a stable αβ “dimer” and two dimers are more loosely associated to form the complete hemoglobin “tetramer.” When hemoglobin is free in the plasma, it rapidly dissociates to αβ dimers, which are rapidly oxidized and subsequently cleared by the kidney. High plasma concentration will result in kidney toxicity as seen, for example, in “crush” injury. Furthermore, cell-free hemoglobin exerts oncotic pressure in addition to other plasma proteins, and its oxygen affinity is different from that inside the red cell. Therefore, one of the requirements of hemoglobin-based blood substitutes is the suppression of dissociation of Hb tetramer into dimmers.
In the last few decades particular attention has been paid to the roles of pH (Atha and Riggs, Citation[[1976]]; Chu and Ackers, Citation[[1981]]; Hanlon et al., Citation[[1971]]; Khaleque and Sawicki, Citation[[1988]]; Lunelli et al., Citation[[1994]]; Merrett, Citation[[1966]]; Rollema et al., Citation[[1980]]; Schönert and Stoll, Citation[[1988]]), ionic strength (Chu and Ackers, Citation[[1981]]; Lunelli et al., Citation[[1994]]; Norén et al., Citation[[1974]]; Merrett, Citation[[1966]]; Schönert and Stoll, Citation[[1988]]) and the ligand (Benesch and Kwong, Citation[[1995]]; Yamaguchi and Adachi, Citation[[2002]]) on the hemoglobin dissociation process. First evidence of hemoglobin dissociation was obtained from osmotic pressure and ultracentrifuge studies. More recently, sedimentation (Hanlon et al., Citation[[1971]]), gel filtration (Mahieu and Sebille, Citation[[1985]]), osmotic pressure (Schönert and Stoll, Citation[[1988]]) and stop-flow (Berjis and Sharma, Citation[[1991]]) have also been introduced under a variety of conditions. However, all these methods have some limitations. For example, the determination of sedimentation equilibria is time-consuming and extensive corrections are required for the “bouyance” term; furthermore, this method also requires the use of expensive equipment. The gel filtration method will require larger amounts of hemoglobin samples that are not easily obtained for site-specific hemoglobin mutants (Berjis and Sharma, Citation[[1991]]). The precision of osmotic pressure and stop-flow method is not very high.
In this article we describe a multiangle laser light scattering method, which can overcome many of the limitations associated with the above techniques. Recent improvements in instrumentation have made the light-scattering (LS) technique a powerful method to determine the absolute molecular weights of proteins and polypeptides that once were considered impossible to be measured by LS. In our work two different methods, microbatch multiangle light-scattering (MALS) and on-line size-exclusion high-performance liquid chromatography light scattering with refractive index detector (SEC-LS/RI), are used to study the bovine hemoglobin (bHb) dissociation.
Materials and Methods
Pure bovine hemoglobin was provided by Beijing Kaizheng Biotech Developing Ltd. (Beijing, China). Bovine serum albumin (BSA monomer) was purchased from Sigma (St. Louis, MO). Hemoglobin was dissolved in 0.15 M NaCl and 0.05 M Na2HPO4 − NaH2PO4 buffer, pH 2–11. Its concentration was determined by hemin. On-line connection of advanced laser LS devices with HPLC equipment can provide quick and accurate molecular weight determinations of proteins and characterize protein–protein interaction in solution (Kendrick et al., Citation[[2001]]; Wen et al., Citation[[1996]]). Determinations of the molecular weight of native proteins by such LS systems agree well with known molecular weights based on sequence (Kendrick et al., Citation[[2001]]; Wen et al., Citation[[1996]]). Molecular weight calculated by SEC-LS/RI method is based on determinations from scattered light intensity using concentration obtained from RI. A Hewlett Packard Model 1100 HPLC system (Bellevue, WA) was connected to a Wyatt Optilab differential refractometer (RI) (Santa Barbara, CA) and a Wyatt DAWN EOS laser light scattering (LS) instrument (Santa Barbara, CA). When using the on-line SEC-LS/RI method, the detectors were connected in the order of LS-RI. Both the LS and RI instruments operated at a wavelength of 690 nm. The light scattering instrument output was connected to the RI detector such that the signals from the two detectors can be simultaneously collected with Wyatt Astra software. For hemoglobin a Tosohaas (Montgomeryville, PA) G4000SW SEC column was used with a mobile phase of 0.15 M NaCl, 0.05 M phosphate, pH 7.0 (PBS), delivered at a flow rate 0.5 mL/min. Hemoglobin was dissolved in PBS to a concentration of ca. 4 mg/mL and inject volumes were 100 μL.
Molecular weight measurement by microbatch MALS is based on determinations from scattered light intensity using various concentration of proteins in solution. Yamaguchi has used this method to analyze the hemoglobin dissociation (Yamaguchi and Adachi, Citation[[2002]]). This method only uses the LS detector if the samples’ dn/dc have been known. All stock solutions were previously filtered through a 0.22-μm filter. The filter solvent and sample solution were then filtered through 0.2-μm filter tips (Whatman international, Maidstone, England) and equilibrated at room temperature. The solution was delivered to a flow cell inlet by pushing a syringe.
The basic light-scattering equation is (
, where Rθ is the excess measured Rayleigh ratio, e.g., excess intensity of light scattered at angle θ, c is the solute concentration in g/mL,
is the weight-average molecular weight, A2 is the second virial coefficient in mol/g2, and K* is an optical parameter equal to
. In the equation of K*, λ0 is the wavelength of the light in vacuum, n0 is the refractive index for the solvent used (the value of 1.333 was applied for aqueous buffers used in this study), dn/dc is the refractive index increment of solute, and NA is Avogadro's number.
The dn/dc of BSA and bovine hemoglobin is 0.185 and 0.190, respectively (Yamaguchi and Adachi, Citation[[2002]]). The function P(θ) equals to [1 + 16 π/3λ2sin2 (θ/2) + ···]. At a low concentration, the virial coefficient term is negligible. The term 16π/3λ2
sin2(θ/2) will be negligible if the light scattering can be measured at small angles. Furthermore, this term will generally be negligible at all angles for proteins with
1/2 < 15 nm, which is true for a folded polypeptide with M < 5 × 10⁷ (Wen, Citation[[1996]]). Under these conditions, the above basic LS equation can be simplified to K* c/R (θ) = 1/
, which is Debey plot. Astra software automatically prepares the Debey plot from the read LS signals and calculates the molecular weight.
Results
Determination of Molecular of BSA
We evaluated the accuracy of these two methods using proteins with a range of molecular weights similar to those of tetrameric hemoglobin. We chose BSA for this purpose, since its molecular weight of 67 kDa was close to that of fully associated hemoglobin tetramers.
Microbatch MALS Method
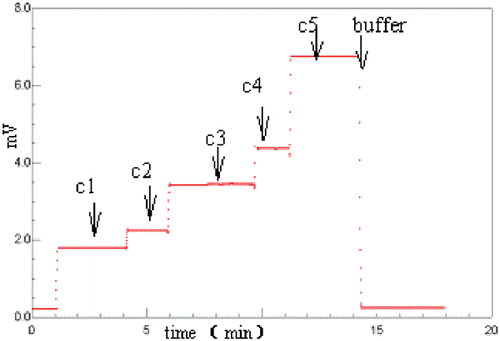
In this method, when BSA concentrations were increased, the LS signals increased ().
Figure 1. LS signals of BSA at different concentration. c1 to c5 is 0.4748, 0.5953, 0.9427, 1.196, 1.909 mg/mL, respectively. (View this art in color at www.dekker.com.)
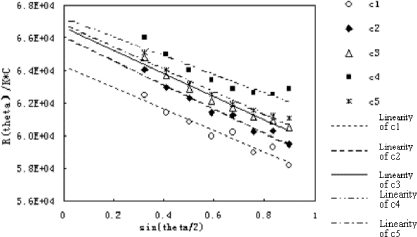
Molecular weight of BSA at each concentration was calculated by the Debey plot based on signals collected by the Dawn EOS detector (). The molecular weights were distributed within a range from 64–67 kDa. The lower of the first concentration may be due to the operation error.
Online SEC-LS/RI Method
In this method, when RI signals were increased, the LS signals increased () too. The molecular weight of BSA at each concentration was calculated by the Debey plot based on signals collected by both the Dawn EOS detector and the Optilab RI detector (). The molecular weights were distributed within a range from 64 to 67 kDa.
Figure 3. SEC chromatogram of BSA. Ten microliters of 4 mg/mL BSA was injected onto a G4000SW column (Tossohaas) with PBS as eluant at 0.5 mL/min flow rate. The solid line is the RI signal and the dashed line is the LS signal. (View this art in color at www.dekker.com.)
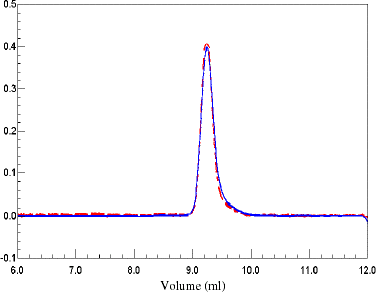
Figure 4. RI signals and MW of BSA. Molecular weights were calculated by Debey plot. The molecular weights were in the range from 64–67 kDa. (View this art in color at www.dekker.com.)
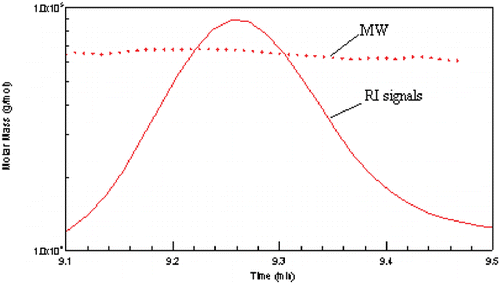
Based on the results of these two methods, it was found that the molecular weights were agreed well. When the concentrations were too low, the molecular weights were slightly decreased, which maybe due to the instruments error. The fact that these relatively constant values were independent of concentrations indicates that BSA does not have the property to dissociate or associate readily under the experimental conditions employed.
Dimer–Tetramer Dissociation of bHb in Different Concentrations
Hemoglobin is a tetremeric protein made of two pairs of subunits that can dissociate into dimmers depending on its global charge and ionic strength but dissociates into monomers with difficulty (Yamaguchi and Adachi, Citation[[2002]]).
Microbatch MALS Method
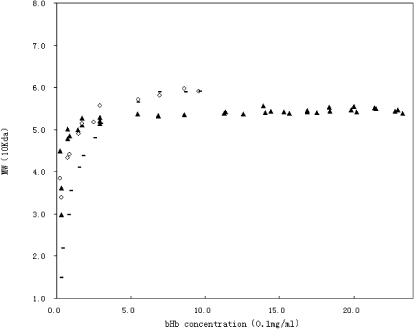
The LS signals reflected by bHb increased when concentrations increased. Molecular weight of bHb at each concentration was calculated by Debey plot based on signals collected by the LS detector. The molecular weights of bHb were dependent on concentrations. At higher concentrations the molecular weight of bHb was close to 55 kDa, while at lower concentrations the molecular weight of bHb was nearly 32 kDa. This result was close to Hb A (Yamaguchi and Adachi, Citation[[2002]]). This was consistent with properties of dimer–tetramer equilibration of hemoglobin tetramers. The relationship between concentration and average molecular is plotted in .
Figure 5. Molecular weight as a function of concentration of bHb using and methods. ▴ represents the molecular weights calculated from microbatch MALS data; ♦ represents the molecular weights calculated from the first half of peak of online SEC-LS/RI data; and −represents the molecular weights calculated from the second half of peak of online SEC-LS/RI data.
Online SEC-LS/RI Method
Molecular weight of bHb at each concentration was calculated by Debey plot based on signals collected by the LS and RI detector. At higher concentrations the molecular weight of bHb was close to 55 kDa, while at lower concentrations the molecular weight of bHb was nearly 32 kDa. This result was close to the result of microbatch MALS method. The relationship between concentration and the average molecular is plotted in . The data of the first half of peak () is similar to the data of microbatch MALS method (), though the second half peak is different, which may be due to the characteristics of SEC HPLC.
Figure 6. SEC chromatogram of bHb. One hundred microliters of 4 mg/mL bHb was injected onto a G4000SW column (Tossohaas) with PBS as eluant at 0.5 mL/min flow rate. The solid line is the RI signal and the dashed line is the LS signal. (View this art in color at www.dekker.com.)
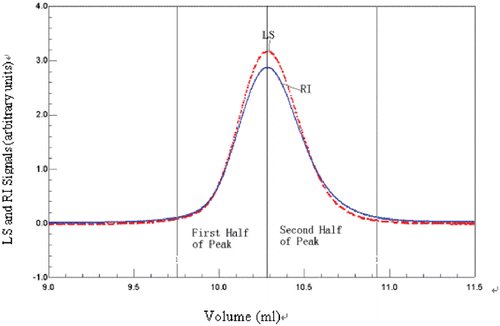
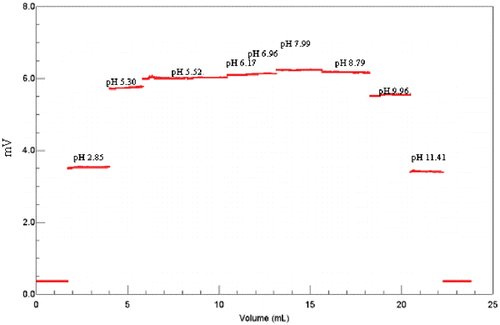
Figure 7. Light-scattering signals of bHb at different pH. BHb concentration is 1.85 mg/mL in different buffer. The buffer is 0.15 M NaCl and 0.05 M phosphate, and the pH ranges from 2.85 to 11.41 (2.85, 5.30, 5.52, 6.17, 6.96, 7.99, 8.79, 9.96, 11.71, respectively). (View this art in color at www.dekker.com.)
Dimer–Tetramer Equilibration of bHb in Different pH
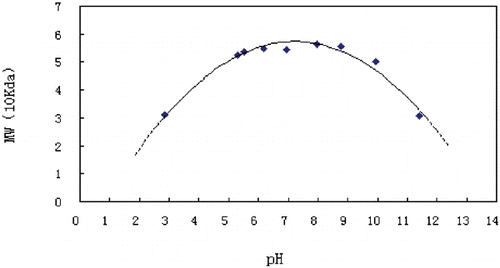
Because of the limitations in the pH range for the column, we chose the microbatch MALS method to study the bHb dissociation in different pH. At similar concentrations the molecular weights were increased when pH range is from 2.85 to 5.30 and 11.41 to 8.79. When pH range is from 5.30 to 8.79, the change of molecular weight is very small (). Molecular weight of bHb at each pH was calculated by Debey plot based on signals collected by the LS detector (). It shows that bHb is more stable at pH range from 6 to 9.
Discussion
Comparing these two methods, when using BSA samples, since the concentration doesn’t affect the BSA molecular weight, the results of these two methods are agree very well. When using bHb samples, as shown in , the results of these two methods have some slight difference. Using online SEC-LS/RI method, when the hemoglobin concentration is less than 0.3 mg/mL, the molecular weight at the first half of peak is 0.5 kDa higher than the second one, and the results of the microbatch MALS method is more close to the first one. While at the concentration higher than 0.3 mg/mL, the first and second peak of online SEC-LS/ RI method is almost the same, but all are higher than the microbatch MALS method. The above results show that the molecular weight varies with the concentration sensitively when the hemoglobin concentration is less than 0.3 mg/mL, which implies that all the tetramers and dimers are not very stable. When the concentration is less than 0.03 mg/mL, the molecular will be less than 36 kDa, which shows that the solution mainly contains the dimers. When the concentration is more than 1.5 mg/mL, the molecular weight of online SEC-LS/RI is 60 kDa, while the microbatch MALS is steady in about 54 kDa. The difference between the two methods and between the first peak and the second may be related with the characters of the SEC column. Since the sample contains tetramers and dimers, the column will separate the initial tetramers and dimers when the sample enters it. But once the sample inject to the column, the column will not be able to deal with the fast dissociation equilibration of Hemoglobin (Mahieu and Sebille, Citation[[1985]]). This will cause the increasing of the dimers at the second half especially at the end of the peak. Since the summit and the first of the peak mainly reflect the dissociation of tetramer, the molecular weight calculated by the summit of peak is large than microbatch MALS.
From the above analysis, it can be concluded that the solution will mainly contains the dimers when the bHb concentration is less than 0.03 mg/mL, and the molecular weight of hemoglobin will be steady in 54 kda when bHb concentration is more than 1.5 mg/mL in our experiment conditions. So, it is suggested that the online SEC-LS/RI method is better for the measurement of tetramer, while the microbatch method is more suitable for the analysis of dissociation of bHb solution.
Acknowledgments
Contract grant sponsor: National High-tech program.
References
- Atha D. H., Riggs A. Tetramer–dimer dissociation in hemoglobin and the Bohr effect. J. Biol. Chem. 1976; 251: 5537–5543, [PUBMED], [INFOTRIEVE]
- Benesch R. E., Kwong S. Coupled reactions in hemoglobin. J. Biol. Chem. 1995; 270: 13785–13786, [PUBMED], [INFOTRIEVE], [CROSSREF]
- Berjis M., Sharma V. S. Double mixing stopped-flow method for the study of equilibrium and kinetics of dimer–tetramer association of hemoglobins: studies on Hb Carp, Hb A, and Hb Rothschild. Anal. Biochem. 1991; 196: 223–228, [PUBMED], [INFOTRIEVE], [CROSSREF]
- Chu A. H., Ackers G. K. Mutual effects of protons, NaCl, and oxygen on the dimer–tetramer assembly of human hemoglobin. J. Biol. Chem. 1981; 256: 1199–1205, [PUBMED], [INFOTRIEVE]
- Hanlon S. The dissociation of bovine hemoglobin at acid pH. Biochim. Biophys. Acta 1971; 229: 359–367, [PUBMED], [INFOTRIEVE]
- Kendrick B. S., Kerwin B. A. Online size-exclusion high-performance liquid chromatography light scattering and differential refractometry methods to determine degree of polymer conjugation to proteins and protein–protein or protein–ligand association states. Anal. Biochem. 2001; 299: 136–146, [PUBMED], [INFOTRIEVE], [CROSSREF]
- Khaleque M. A., Sawicki C. A. Photolysis method for determination of the tetramer–dimer dissociation constant of deoxyhemoglobin. J. Biochem. Biophys. Met. 1988; 16: 41–48, [CROSSREF]
- Lunelli L., Zuliani P., Baldini G. Evidence of hemoglobin dissociation. Biopolymers 1994; 34: 747–757, [PUBMED], [INFOTRIEVE], [CSA]
- Mahieu J. P., Sebille B. Determination of the dissociation constant of oligomeric proteins by size-exclution high-performance liquid chromatography: application to human haemoglobin. J. Chromatogr. 1985; 327: 313–325, [PUBMED], [INFOTRIEVE], [CROSSREF]
- Merrett T. Observations on the dissociation of oxy-, deoxy- and ferrihemoglobin in relation to pH and ionic strength by the Sephadex method. Biochim. Biophys. Acta 1966; 124: 389–394, [PUBMED], [INFOTRIEVE]
- Norén I. B. E. On the tetramer–dimer equilibrium of carbon monoxyhemoglobin in 2 M sodium chloride. Biochemistry 1974; 13: 1683–1686
- Rollema H. S. pH changes accompanying the association of isolated α and β chains of human hemoglobin. J. Biol. Chem. 1980; 255: 2756–2760, [PUBMED], [INFOTRIEVE]
- Schönert H., Stoll B. Eur. Osmotic pressure measurements of the ligand-linked dissociation equilibrium of human oxyhemoglobin. J. Biochem. 1988; 176: 319–325
- Wen J. Size-exclusion chromatography with on-line light-scattering, absorbance, and refractive index detectors for studying proteins and their interactions. Anal. Biochem. 1996; 240: 155–166, [PUBMED], [INFOTRIEVE], [CROSSREF]
- Yamaguchi T., Adachi K. Hemoglobin equilibrium analysis by the multiangle laser light-scattering method. Biochem. Biophys. Res. Com. 2002; 290: 1382–1387, [PUBMED], [INFOTRIEVE], [CROSSREF], [CSA]
