Abstract
The method to determine the average molecular weight and distribution of molecular weight of the PEGylated hemoglobin (PEG-bHb) and their molecular weight of polypeptides in PEG-bHb with UV absorbance (UV), light scattering (LS) and refractive index (RI) detectors is described in this paper. The results indicate that when molar ratio of PEG to hemoglobin is 7:1, the average molecular weight of PEG-bHb (MCP is 95 kDa, the average molecular weigh of protein moiety in PEG-bHb (MP) is 68 kDa, and their distribution is from 48-157 kDa and 44-121 kDa, respectively when the molar ratio is 10:1, the MCP is 106 kDa, the MP is 70 kDa, and their distribution is from 56-216 kDa, 49-135 kDa, respectively when the molar ratio is 13:1, the MCP is 73 kDa, and their distribution is from 81-272 kDa and 41-144 kDa, respectively. It has been proved that this method is a simple and reliable way for the determination of average molecular weight and distribution of molecular weight of PEGlyted hemoglobin. This experiment also suggests that there exists not only aggregation in the frontal of elution peak of PEG-bHb, but dissociation of tetramer of hemoglobin into dimmer in the tail of elution peak, and the degree of aggregation is depended on the molar ratio of PEG to hemoglobin due to the present of diol PEG and the dissociation is dependant on the concentration of hemoglobin.
INTRODUCTION
A number of hemoglobin-based oxygen carriers (HBOC) are currently under development all over the world, and because of its renal toxicity, short circulation time in body and too great affinity to oxygen, hemoglobin itself cannot be used for HBOC without modification [Citation[1-4]]. The limitation can be overcome by increasing molecular weight with polyethylene glycol (PEG) modification [Citation[4], Citation[3]]. After being modified with PEG, the biological properties of hemoglobin are related with the number of PEG bound to surface, so the molecular weight and the distribution of molecular weight are important to evaluate the quality of PEG conjugated hemoglobin. The most common methods used for determining the molecular weight of biopolymers include osmometry [Citation[6]], analytical ultracentrifugation [Citation[7], Citation[8]], mass spectrometry [Citation[9]] and denaturing polyacrylamide gel electrophoresis (SDS-PAGE). Osmometry and analytical ultracentrifugation are time consuming, and only the average molecular weight could be obtained. Mass spectrometry and SDS-PAGE could not overcome the hemoglobin dissociation from tetramers into dimers. SE-HPLC is another simple and fast method for estimating the molecular weight of a protein in its native form based on its elution position, which depends on hydrodynamic radius of the protein [Citation[10], Citation[11]]. The PEGylated hemoglobin (PEG-bHb) has a much larger effect volume than that of compact native protein since the conformation of PEG in the surface of protein is most likely to be a quasi-random coil with number of helical sections [Citation[4], Citation[10]]. It has been reported that a protein molecular weight is nearly ten times larger than that of PEG of a similar hydrodynamic volume [Citation[10]]. That is to say, molecular weight of PEG-bHb is not proportional to its elution position if the calibration standard is native protein. So conventional SE-HPLC is not suitable for determining the molecular weight of PEG-bHb.
In the 1940s, Einstein et al. developed the Light Scattering Theory, and they found the light-scattering intensity was proportional to the product's molecular weight an concentration in solution. When SE-HPLC is used with and on-line light scattering detector, the molecular weight measured is independent of the elution position. It has been proved that this method is a simple, accurate and reliable technique for determining the absolute molecular weight of protein [Citation[12-15],] and glycoprotein [Citation[16-18]], for determining the stoichiometry of protein-ligand conjugations [Citation[19], Citation[20]] and charactering protein-protein interactions in solutions [Citation[21]]. In this article we describe a protocol to determine the molecular weight of PEG-bHb and charactering aggregation-dissociation state of hemoglobin in PEG-bHb from the light scattering signal combined with refractive index and UV absorbance signals as online concentration detectors.
PRINCIPLE
The basic theory of light scattering was perfectly described by J. Wyatt [Citation[22]] and Jie Wen et al. [Citation[19]] As the concentration of protein is low enough during column chromatography, and the gration of PEG-bHb is smaller than the increment wavelength (molecular dimension < 1/20 λ), combining the LS and RI signals collected from the multi-angle laser light-scattering detector and refractive index detector respectively, the molecular weight of PEG-bHb could be expressed as follows:
Where MCP is the molecular weight of PEG-bHb, LS here is the area signal of 90° of multi-angle laser light-scattering; RI is the signal of refractive index; KRI and KLS are the instrument calibration constants of light-scattering detector and refractive index detector respectively; (dn/dc)CP is the refractive increment as a function of concentration of PEG-bHb, and the value could be determined with RI and UV signals [Citation[17]].
Where the RI and UV are area signals of refractive index and UV absorbance respectively; (dn/dc)P and (dn/dc)C are (dn/dc) value of hemoglobin and PEG, ε P is the extinction coefficient of hemoglobin at 280 nm; KUV/KRI is the instrument calibration constant. Combining Eq. 1 and Eq. 2, we could determine the average molecular weight of PEG-bHb and their distribution across the elution peak.
Since PEG has no absorbance at 280 nm, by using the LS, RI and UV signals, the molecular weight of polypeptide in PEG-bHb could be determined as in the following equation, which has been cited by Takagi Toshio [Citation[12]] to calculate the protein moiety in glycoprotein.
The instrument calibration constants KRI/KLS and KUV/KRI could be determined with a standard protein such as bovine serum albumin, in which (dn/dc)P is 0185 ml/g, ε P is 0.666ml/cm.mg [Citation[17]], and molecular weight is 67 kDa, respectively. By the LS and RI signals, the KRI/KLS could be expressed as follows:By the UV and RI signals, the KUV/KRI could be written as:
So by collecting the LS, RI and UV signals, the KRI/KLS and KUV/KRI could be obtained.
MATERIALS AND METHODS
Preparation of PEG-bHb
Purification of stroma free hemoglobin of bovine was mainly referred to in the literature [Citation[24]]. The fresh, whole bovine blood was washed with saline three times (3000 g, 4°C, 10 min), and the packed red blood cells were lysed slowly by adding 10 mM sodium phosphate (pH 7.0). The stroma was removed through 0.45 µm membrane cartridges (Pall Technology Corp., USA), and the solution was diafiltered through 100 kDa membrane to remove any stroma particles. And then the filtered solution was concentrated to 100 mg/ml through 30 kDa membrane cartridge. Then we obtained the stroma free bovine hemoglobin.
Stoma free hemoglobin was mixed with actived monomethyl PEG (Fluca Technology Corp., USA) at different molar ratios (actived PEG: bHb = 1:7, 1:13, which were named F1, F2 and F3, respectively) and stirred for 30 minutes at 4°C. The unactive mPEG was removed by 50 kDa ultrafiltration membrane cartridges (Pall Technology Corp., USA) the PEG-bHb was concentrated to 60 mg/ml and stored at 4°C for use.
Size-exclusion High Performance Liquid Chromatography with Multiple Detection Systems
A Hewlett Packard model 1100 HPLC system with a UV detector was connected to a Multi-angle Laser Light-Scattering detector (DAWN EOS, λ 690 nm., Wyatt Technology Corp., USA) and Refractive Index detector (OPTILAB DSP, λ 690 nm., Wyatt Technology Corp., USA). The delay volume between light scattering and refractive index detector was 0.125 ml, and the value between UV absorbance and refractive index detector was 0.015 ml. The column was GF-250 (25 cm × 9.4 mm ID., Agilen Technology Corp., USA). The mobile phase was composed of phosphate-buffer saline (10 mM sodium phosphate, 150 mM NaCl PH 7.0), filtered with 0.2 µm filter and degassed, and delivered at a flow rate of 1 ml/min.
Determination of the Instrument Calibration constant KRI/KLS, KUV/KRI.
The BSA (Sigma) was dissolved to 10 mg/ml with mobile phase and filtered with 0.2 µm tip filter. When all the base lines of the LS, RI and UV were stable, 20 µl of protein solution was injected into the GF-250 column with HPLC pump and the eluent was monitored with these three detectors and the signals of LS, RI and UV were collected and processed by ASTRA software (Wyatt Technology Corp., USA). By using Eqs. (4) and (5), the KRI/KLS and KRI/KUV values could be obtained.
Determination of the Average Molecular Weight of PEG-bHb and the Distribution of Molecular Weight
The PEG-bHb stock solutions were also diluted to 5 mg/ml with mobile phase and filtered through 0.2 µm tip filter. The injection volume was 10 µl. Data from LS, RI and UV were collected with ASTRA software. By using the UV and RI signals of the elution peaks, the (dn/dc)CP value could be determined on-line according to Eq. (2), and the average MCP could be determined according to Eq. (1); MP could be obtained by using the LS, RI and UV signals according to Eq. (3). To determine the distribution of MCP and MP, these peaks were split into 9 slices (0.2 min increments) with ASTRA software. With the UV and RI signals of each slice, the (dn/dc)CP of each slice could be determined on-line according to Eq. (2). Combining Eq. (1) the MCP of each slice would be obtained; by using the LS, UV and RI signals of each slice, the MP of each slice could be obtained. Then, distribution of MCP and MP of PEG-bHb with different elution time was obtained.
RESULTS
The Results of KRI/KLS and KUV/KRI
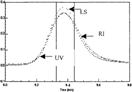
The elute pattern of BSA is shown in . The peak between two solid vertical lines was the region selected for calculating the instrument calibration constant. The (dn/dc) value of hemoglobin and PEG were 0.19 ml/g [Citation[23]] and 0.133 ml/g [Citation[20]] respectively; the extinction coefficient of hemoglobin was 1.8 ml/(cm.mg) at 280 nm. The areas of LS, RI and UV signal of selected peak were 0.04178 volts.min, 0.00966 volts.min and 0.00839 volts.min respectively, according to Eq. 4 and Eq. 5, the value of KUV/KRI was 0.2413, and KRI/KLS was 26.496.
Figure 1 HPLC elution profile of BSA. The LS, RI and UV were the signals of laser light-scattering, refractive index and UV absorbance collected with Astra software, respectively.
The Average Molecular Weight of PEG-bHb
The chromatograms profile of F1, F2 and F3 were plotted in , and , the peaks between two solid vertical lines were the region selected for calculating the molecular weight and their distribution, and their molecular weight was shown in . The results showed that when the molar ratio was 7:1, the average MCP of was 95 kDa, the MP was 68 kDa, and the weight ratio of PEG to hemoglobin was 39% in PEG-bHb; when the MP was 68 kDa, and the weight ratio of PEG to hemoglobin was 39% in PEG-bHb; when the molar ratio was 10:1, the average MCP was 106 kDa, MP was 70 kDa, and the weight ratio of PEG to hemoglobin was 51%; when the molar ratio was 13:1, the average MCP was 131 kDa, MP was 73 kDa, and the weight ratio of PEG to hemoglobin was 80%. These results also indicated that the MCP, MP and MC/MP were increased with the increasing of the ratio of PEG to hemoglobin during the modification.
Figure 2 HPLC elution profile of PEG-bHb as the molar ratio of PEG to bHb was 7:1. The LS, RI and UV were the signals of laser light-scattering, refractive index and UV absorbance collected with Astra software, respectively.
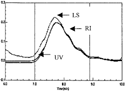
Figure 3 HPLC elution profile of PEG-bHb as the molar ratio of PEG to bHb was 10:1. The LS, RI and UV were the signals of laser light-scattering, refractive index and UV absorbance collected with Astra software, respectively.
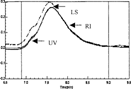
Figure 4 HPLC elution profile of PEG-bHb as the molar ratio of PEG to bHb was 13:1. The LS, RI and UV were the signals of laser light-scattering, refractive index and UV absorbance collected with Astra software, respectivley.
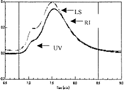
Table 1 The average MCP and MP of three different PEG-bHb
The Distribution of Molecular Weight
The results of molecular weight vs elution time of F1 are shown in . It indicated that not only the MCP but also the MP were not consistent with the elution time. When the elution time was 7.0–7.2 min, the MCP of F1 was 157 kDa, the MP was 121 kDa, and the MCP was 100 kDa, the MP was 179 kDa as elution time was 7.2–7.4; these results indicated that there existed an aggregation of hemoglobin because values of MP were more than 64 kDa in the PEG-bHb. When the elution time was 7.6–8.8, the MCP distributed within a rang from 80 kDa, and the MP changed from 54 kDa to 44 kDa. It suggested that the hemoglobin tetramer partly disassociated to dimer in the peak tail, and the degree of dissociation was more obvious with the extension of elution time.
Table 2 Relationship between molecular weight and elution time of F1
This distribution of molecular weight of F2 and F3 are shown in and . Similar to the results of F1, there also existed an aggregation of hemoglobin in PEG-bHb in the frontal of elution peaks and dissociation of tetramer to dimer in the peaks tail.
Table 3 Relationship between molecular weight and elution time of F2
Table 4 Relationship between molecular weight and elution time of F3
It has been demonstrated in , and that when the molar ratio of PEG to hemoglobin increased, the MCP in the frontal of elution peaks was increased (100–157 kDa for F1, 134–216 kDa for F2, and 174–272 kDa for F3), and the MP in the same elution position was also increased (79–121 kDa for F1, 85–135 kDa for F2, and 96–144 kDa for F3). These results suggested that the aggregation was related with the molar ratio of PEG to hemoglobin, and the more molar ratio of PEG to hemoglobin, the more aggregation of hemoglobin in PEG-bHb. These results also indicated two factors responsible for the increased MCP in the frontal of elution peaks of the three different PEG-bHb; one was the numbers of PEG attached to the surface of hemoglobin, and the other was the degree of aggregation of hemoglobin.
DISCUSSION
Calibration constants KUV/KRI and KRI/KLS were important to determine the molecular weight of PEG-bHb (MCP) and the molecular weight of protein moiety in the PEG-bHb (MP), and the calibration constant value could be determined by conventional method with the instrinic Rayleigh scattering pure solvent such as toluene, but it needed a switch between toluene and aqueous buffers, which was inconvenient and could cause precipitation of salts in the detector cells. In this experiment, we determined the value by using a standard protein (BSA) with SE-HPLC combining the LS, RI and UV signals. By determining these values every week with BSA, we found that this method was very simple, and the data from this method were very relible.
The (dn/dc) value could be determined with (dn/dc) instrument by using a series of samples at different concentration, and this method was sufficient when the sample to be determined was homogeneous. When the hemoglobin was modified with PEG, the PEG-bHb was heterogeneous, and the (dn/dc)CP was not consistent since there were different numbers of PEG in the surface of hemoglobin, so this method was fit for determining the average molecular weight of PEG-bHb, but was not appropriate for its distribution. By combining UV and RI signals, we could determine not only the (dn/dc)CP of PEG-bHb, but also the (dn/dc)CP at various elution position of elution peaks on-line, so we could determine the average molecular weight of PEG-bHb and distribution molecular weight. By using this method, the average molecular weight of F1, F2 and F3 were 96 kDa, 103 kDa and 131 kDa respectively, and their molecular weight distributed within a range from 48–157 kDa, 56–216 kDa and 81–272 kDa respectively.
Combining the LS, RI and UV signals on-line, we could determine the content of the protein moiety in PEG-bHb. By using this method, the average Mp of F1, F2 and F3 were 68, 70 and 73 kDa respectively; in front of elution peaks, the Mp were 79–121 kDa and 96–144 kDa respectively. These results suggested that there existed an aggregation of hemoglobin, and the degree of aggregation depended on the molar ratio of PEG to hemoglobin. We had determined the molecular weight of PEG with SE-HPLC combining LS and RI signals, and there were two fractions whose molecular weight were 5 kDa and 10 kDa, respectively (). It had been reported by Barbara Selisko et al. [Citation[25]] that commercial M-PEG (5 kDa) were often contaminated by PEG whose molecular weight was 10 kDa with free hydroxyl groups at each end, which resulted in cross-linking between proteins during the modification. We founded similar results in our experiments. In the tail of elution peaks, the MP were less than the molecular weight of native hemoglobin (64 kDa). It had been reported [Citation[26], Citation[27]] that the degree of dissociation was mainly affected by the concentration of hemoglobin, and this conclusion was also demonstrated in our experiment (), that the molecular weight of native bovine hemoglobin was 59 kDa as the elution time was from 9–9.8 min. When the elution time was from 9.8–10.5 min, the value dropped to the value of 46 kDa. So it suggested that the MP less than the molecular weight of native hemoglobin was mainly due to the dissociation of tetremar into dimer chromatography when the concentration was low.
Figure 5 Molecular weight vs elution time of actived mPEG. The dashed lines represent the signal of laser, and the solid lines represent the signal of refractive index.
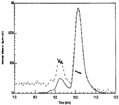
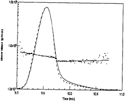
Figure 6 Molecular weight vs elution time of native bovine hemoglobin. The dashed lines represent the signal of laser, and the solid lines represent the signal of refractive index.
Contract grant sponsor: National High-tech Program.
REFERENCES
- Feola, M., Simoni, J., Canizarro, P.C. (1998). Toxicity of polymerized hemoglobin solutions. Surgery. Gynecology & Obstetrics. 166: 211–222.
- Shoemaker, S.A., Gerber, M.J. (1994). Initial clinical experience with a rationally designed, genetically engineered recombinant human hemoglobin. Art. Cells, Blood Subs., and Immobil. Biotech. 22(3): 457–465.
- Gulati, A., Barve, A., Sen, A.P. (1998). Pharmacology of hemoglobin therapeutics. J. Lab. Clin. Med. 133(2): 112–119. [CSA], [CROSSREF]
- Haney, C.R., Buehler Pharm, P.W., Gulati, A. (2000). Purification and chemical modifications of hemoglobin in developing hemoglobin based oxygen carriers. Advan. Drug. Deliver. Review 40: 153–169. [CSA], [CROSSREF]
- Conover, C.D., Linberg, R., Shun, K.L., Shorr, R.G. (1999). The ability of polyethylene glycol conjugated bovine hemoglobin (PEG-bHb) to adequately deliver oxygen in both exchange transfusion and top-load rat models. Art. Cells, Blood Subs., and Immobil. Biotech. 27(2): 93–107. [CSA]
- Vandegriff, K.D., McCarthy, M., Rohlfs, R., Winslow, R.M. (1997). Colloid osmotic properties of modified hemoglobins chemically cross-linked versus polyethylene glycol surface-conjugated. Biophs. Chemistry. 69: 23–30. [CSA], [CROSSREF]
- Fairman, R., Fendrson, W., Hail, M.E., Wu, Y.L. (1999). Molecular weight of CTLA-4 and CD80 by sedimentation. Anal. Biochem. 270: 270–286. [CROSSREF]
- Chiancone, E., Gilbert, G.A. (1965). Dissociation of hemoglobin into subunits. I. Oxyhemoglobin: effect of acetic acid. J. Biol. Chem. 240: 3866–3867. [PUBMED], [INFOTRIEVE]
- Smith, R.D., Loo, A. (1990). New developments in biochemical mass spectrometry: electrospray ionization. Anal. Chem. 62: 882–893. [PUBMED], [INFOTRIEVE]
- Kunitani, M., Dollinger, G., Johnson, D., Kresin, L. (1991). On-line characterization of polyethylene glycol-modified proteins. J. Chromatogr. 588: 125–137. [CROSSREF]
- Kunitani, M., Kresin, L. (1993). High-performance liquid chromatographic analysis of carbohydrate mass composition glyciproteins. J. Chromatogr. 632: 19–28. [CROSSREF]
- Maezawa, S., Takagi, T. (1983). Monitoring of the elution from a high-performance gel chromatography column by a spectrophotometer, a low-anger light scattering photometer and a precision differential refractometer as a versatile way to determine protein molecular weight. J. Chromatogr. 280: 124–130. [CROSSREF]
- Takagi, T. (1990). Application of low-angle laser light scattering detection in the field of biochemistry. J. Chromatogr. 506: 409–416. [CROSSREF]
- Dollinger, G., Cunico, B., Kunitani, M., Johson, D., Jones, R. (1992). Practical on-line determination of biopolymer molecular weight by high performance liquid chromatography with classical light-scattering detection. J. Chromatogr. 592: 215–228. [CROSSREF]
- Oliva, A., Llabers, M., Farina, J.B. (2001). Comparative study of protein molecular weights by size-exclusion chromatography and laser-light scattering. J. Pharm: Biomed. Anal. 25: 833–841. [CROSSREF]
- Arakawa, T., Langley, K.E., Kameyama, K., Takagi, T. (1992). Molecular weight of glycosylated and nonglycosylated forms of recombinant human stem cell factor determined by low-angle laser light scattering. Anal. Biochem. 230: 53–57. [CROSSREF]
- Kato, A., Kameyama, K., Takagi, T. (1992). Molecular weight determination and compositional analysis of dextran-protein conjugates using low-angle laser light scattering technique combined with high-performance gel chromatography. Biochim. Biophys. Acta. 1159: 22–28. [PUBMED], [INFOTRIEVE]
- Arakawa, T. Wen, J. (2001). Determination of carbohydrate contents from excess light scattering. J. Anal. Biochem. 299: 158–161. [CROSSREF]
- Wen, J., Arakawa, T., Philo, J.S. (1996). Size-exclusion chromatography with on-line light-scattering, absorbance, and refractive index detectors for studying proteins and their interaction. Anal. Biochem. 240: 155–166. [PUBMED], [INFOTRIEVE], [CROSSREF]
- Kendrik, B.S., Kerwin, B.A., Chang, B.S., Philo, J.S. (2001). Online ssize-exclusion high-performance liquid chromatography light scattering and differential refractometry methods to determine degree of polymer conjugation to proteins and protein-protein or protein-lignad association states. Anal. Biochem. 299: 134–136.
- Philo, J., Talvenheomo, J., Wen, J. (1994). Interactions of neurotrophin-3 (NT-3), brain-derived neurotrophic factor (BDNF), and the NT-3.BDNF heterodimer with the extracellular domains of the TrkB and TrkC receptors. J. Boi. Chem. 269: 27840–27846.
- Wyatt, P.J. (1993). Light scattering and absolute characterization of macromolecules. Anal. Chem. Acta. 272: 1–40. [CROSSREF]
- Franck, Z. (1996). The multi-hemoglobin system of the hydrothermal vent tube worm Riftia pachyptila. J. Bio. Chem. 271: 8869–8874. [CROSSREF]
- Everse, J. (1995). Methods of Enzyme, 231.
- Babara, S., Cristinna, D., Derek, F. (1993). Analysis and purification of monometh-oxy-polyethylene glycol by vesicle and gel permeation chromatography. J. Chromatogr. 641: 71–179. [CROSSREF]
- Yamaguchi, T., Adachi, K. (2002). Hemoglobin equilibrium analysis by the multiangle laser light-scattering method. Biotech. Biophys. Res. Communi. 290: 1382–1387. [CROSSREF]
- Lunelli, L., Zuliani, P., Baldini, G. (1994). Evidence of hemoglobin dissociation. Biopolymers. 4: 747–757. [CROSSREF]