Abstract
A bank of surgically resected human lung tissues frozen at − 70°C after being inflated with support medium for cutting frozen tissue and a separate group inflated with fixative and embedded in paraffin has been established for studies of chronic obstructive pulmonary disease. The present report concerns the quality of RNA that can be extracted from these frozen and fixed tissue samples and from cells obtained from them by laser capture microdissection. The results show that the RNA yield was 257 ± 183 ng/mg and 77 ± 56 ng/mg from randomly selected frozen and paraffin‐embedded tissue, respectively. Intact 18S and 28S rRNA subunits were present in 11/23 frozen and 2/6 paraffin‐embedded specimens. The 375‐bp actin and 296‐bp glyceraldehdye 3‐phosphate dehydrogenase targets were amplified by reverse transcription‐PCR from both sources and the 983‐bp glyceraldehdye 3‐phosphate dehydrogenase and 499‐bp nonhousekeeping integrin‐linked kinase targets from frozen tissue. The minimal amount of RNA required for reverse transcription‐PCR of 296‐bp glyceraldehdye 3‐phosphate dehydrogenase target was 29 pg from frozen tissue when RNA subunits were present and 144 pg when these subunits were absent compared to 0.8 ng from paraffin‐embedded tissue. Ten laser pulses were required to laser capture sufficient cells from frozen tissue to detect amplification of the 375‐bp actin target while more pulses were required for equivalent amplification from paraffin‐embedded tissue. Storage time had no detectable effect on RNA quality. We conclude that both frozen and paraffin‐embedded tissues as well as laser‐captured cells are suitable for gene expression studies but frozen tissue offered greater sensitivity.
Introduction
Chronic obstructive pulmonary disease (COPD) is a term that includes chronic bronchitis Citation[[1]], airways obstruction Citation[[2]]Citation[[3]]Citation[[4]], emphysematous lung destruction Citation[[5]], the vascular complications associated with pulmonary hypertension Citation[[6]]Citation[[7]]Citation[[8]] and exacerbations of acute disease that frequently require hospitalization. The tobacco smoking habit is the single most important risk factor for COPD but there is not a tight correlation between the total accumulated dose of smoking and disease progression. Additional risk factors include age, gender, environmental pollution, occupation, socioeconomic status, birth weight, recurrent infections, allergy and genetic constitution Citation[[9]]. The National Heart Lung and Blood Institute is currently in the process of establishing a Lung Tissue Research Consortium for COPD and idiopathic pulmonary fibrosis in order to provide the pulmonary community with the type of resource that has been helpful in investigating other complex diseases Citation[[10]].
Over the past 24 years our laboratory has established a patient registry and lung tissue bank and reported studies on cigarette smoke‐induced lung inflammation in relation to lung function and COPD Citation[[11]]Citation[[12]]Citation[[13]]. We have also conducted studies on the role of latent adenoviral infection in the pathogenesis of COPD Citation[[14]]Citation[[15]]Citation[[16]] and correlated lung histology with computed tomographic images Citation[[16]]Citation[[17]]Citation[[18]]. In this communication we share our experience in establishing this registry and tissue bank and report our results concerning the value of the stored lung tissue for studies of gene expression using RT‐PCR and laser capture microdissection.
Materials and Methods
Patient Enrollment
Since 1979 all patients who have made a decision to proceed with lung resection for the treatment of a lung tumor are invited to participate in this patient registry and tissue bank. Those who agree, after the purpose of the study has been explained to them, provide written consent that allows their clinical information, preoperative lung function tests, thoracic CT scans, and smoking and occupational histories to be collected into a patient registry and the lung tissue that remains following pathological examination of the resected specimen to be retained in a tissue bank. Patient confidentiality is maintained by using encrypted unique identifiers for each person and restricting access to the data to a single data manager. All studies based on the patient registry and tissue bank must be approved in advance by an oversight committee that meets weekly to discuss research into lung structure and function. The progress of studies based on the registry and tissue bank is also monitored by the oversight committee by having the scientists present their progress at regular intervals. These studies were also approved by the University of British Columbia/Providence Research Ethics Board.
Specimen Handling
The procedures followed for collecting the specimen and obtaining the samples required for pathological diagnosis are described elsewhere Citation[[11]]. From 1979 until 1993 the tissue (n = 407) remaining after the pathological examination of the specimen was fixed by inflation with formalin and randomly sampled blocks of fixed tissue were processed into paraffin and stored. Since 1993 the resected specimens (n = 145) have been inflated with a support medium to allow cutting of frozen tissue: either Optimal Cutting Temperature compound (OCT) (Tissue‐Tek, Sakura Finetek, USA Inc., Torrance, CA) or CryoMatrix (Shandon, Pittsburgh, PA), and rapidly frozen over liquid nitrogen. Two‐cm‐thick slices were cut in the plane of the preoperative CT scan and these frozen slices were sampled with a power‐driven hole‐saw to obtain tissue cores of 1‐cm diameter and 2‐cm length that were stored at − 70°C until use. The remainder of the frozen lung slices were then warmed to room temperature in 10% formalin and samples of this fixed tissue were embedded in paraffin and stored at room temperature Citation[[19]].
Cell Lines
In some cases bronchial epithelial cells were harvested using standard techniques Citation[[20]] prior to inflating the lung with the support medium for frozen tissue and these were used for short‐term in vitro studies or were flash frozen for future use. In the present study, primary human bronchial epithelial cells, referred to as HBE cells, were obtained from portions of the bronchial tree remote from the tumor and treated with 0.1% protease (Type 4, Sigma, Oakville, ON) in Minimal Essential Medium then cultured with Bronchial Epithelial Cell Growth Medium (Clonetics, San Diego, CA) Citation[[21]].
A549 cells, a human alveolar type II‐like cell line derived from a patient with bronchioalveolar carcinoma (American Type Culture Collection, Manassas, VA), were cultured in Minimal Essential Medium supplemented with 10% fetal bovine serum, MEM Vitamin Solution, and 0.29 mg/ml glutamate (Gibco, Burlington, ON).
Removal of OCT from Tissue Before RNA Extraction
To obtain an accurate weight of the frozen tissue that was inflated with OCT prior to freezing, optimal methods for removing the OCT, while at the same time preserving the RNA integrity, were required. To determine this optimal method sequential sections cut from the same tissue block were rinsed for 15 minutes in either 50% formamide, 70% ethanol, 35% ethanol, 0.5% SDS, PBS or diethyl pyrocarbonate‐treated water before weighing and RNA extraction. All the solutions were prepared with diethyl pyrocarbonate‐treated water. An unrinsed section served as a control.
RNA Extraction
RNA from cultured cells or from frozen lung tissue that had been randomly selected from the tissue bank was extracted with TRIzol (Gibco) or RNeasy Mini/Midi Kits (Qiagen, Mississauga, ON) following manufactures' recommendations. With either method, cultured cells suspended in lysis buffer were passed through a 26‐gauge needle five times, while frozen tissue sections or blocks were washed with 70% ethanol in diethyl pyrocarbonate‐treated water to remove the OCT before homogenizing in lysis buffer using the Tissue Tearor (Model 985370, Biospec Products, Inc., Bartlesville, OK) at top speed for 20 seconds to 2 minutes. Randomly selected paraffin‐embedded lung tissue was dewaxed in xylene, washed with isopropanol then 70% ethanol before homogenizing for 2 minutes in TRIzol as above.
Size and Quality Analysis of Extracted RNA
RNA was analyzed with the RNA 6000 Nano Assay Kits using the Agilent 2100 Bioanalyzer. Data were processed by the Bio‐sizing software version A.02.10 Sl270 (Agilent Technologies, Caliper Technologies Corp., Palo Alto, CA). The 260/280 ratio was determined from absorbance curves from the Lambda 2 UV/VIS spectrometer (Perkin Elmer Corp., Analytical Instruments, Norwalk, CT).
Cloning of β‐Actin and Glyceraldehdye 3‐Phosphate Dehydrogenase (GAPDH) cDNAs to be Used as Hybridization Probes
RNA extracted from A549 cells was reverse transcribed to synthesize cDNA according to the manufacture's recommendations in reactions containing the Moloney murine leukemia virus (M‐MLV) reverse transcriptase (Gibco), total RNA, RNaseOUT (Gibco) and random hexamers or anchored Oligo(dT)25 (Amersham Biosciences, Baie d'Urfé, Quebec). This cDNA was amplified by PCR of a 320‐bp β‐actin cDNA target with the forward primer 5′‐aggggaattcTGGACTTCGAGCAAGAGATG‐3′ and reverse primer 5′‐aggggatccGATCTTCATTGTGCTGGGTG‐3′. The primer sequences in uppercase correspond to nucleotides 662 to 681 and 981 to 962, respectively, of the β‐actin mRNA sequence (GenBank accession number NM_001101) where the nucleotide numbering in our case begins at the translation start site. The sequences in lower case of the forward and reverse primers contain the underlined recognition sites of the restriction enzymes, EcoRI and BamHI, respectively. The 226‐bp GAPDH target was amplified with the forward primer 5′‐agagaattcTGAGTACGTCGTGGAGTCCA‐3′ and reverse primer 5′‐aaaggatccGTTGTCATGGATGACCTTGG‐3′ corresponding to nucleotides 276 to 295 and 501 to 482, respectively, of its mRNA (GenBank accession number NM_002046). The nucleotide numbering and the upper and lower case designations follow the criteria given for the β‐actin primers. The EcoRI/BamHI fragments from the two PCR products were cloned into the pBluescript SK(+) plasmid (Stratagene, La Jolla, CA) to produce plasmids referred to as pBS‐actin and pBS‐GAPDH, respectively. These cloned cDNAs were confirmed by DNA sequencing (NAPS Unit, University of British Columbia).
Reverse Transcription (RT)‐PCR and Detection of PCR Products
RNA extracted from cells and lung tissue was used to synthesize first strand cDNA as described above for cloning β‐actin and GAPDH cDNAs. The resulting cDNA was used to amplify a 375‐bp actin, 296‐ and 983‐bp GAPDH and 499‐bp integrin‐linked kinase (ILK) intron spanning targets using primers () selected from coding sequences of the human β‐actin, GAPDH or ILK genes (GenBank accession number NT_007819, J04038 and AF244139, respectively). PCR of these targets and for the cloning of the 320‐bp β‐actin and 226‐bp GAPDH probes (see above) with either AmpliTaq Gold polymerase (Applied Biosystems, Foster City, CA) or HotStar Taq (Qiagen) was performed on the Genetic Thermal Cycler (GL Applied Research Inc., Grayslake, IL). All PCR reactions with the AmpliTaq Gold contained 25 mM dNTPs, 1.0 mM MgCl2, 0.25 mM of each primer, 2.5 µl of 10 × buffer provided by the manufacturer, 0.05 units polymerase and 20 µl of the cDNA or DNA at the concentrations to be tested, all in a final volume of 25 µl. PCR reactions with HotStar Taq were the same except that 5 µl of the 5 × Q solution supplied with the HotStar Taq to facilitate amplification of difficult templates was included in the reaction. For PCR with the AmpliTaq Gold polymerase, thermocycling was the following: one cycle at 94°C for 3 minutes then 35 cycles of 94°C for 30 seconds, 58°C for 30 seconds, and 72°C for 1 minute followed by one cycle at 72°C for 10 minutes. The same cycling regime was used with the HotStar Taq except the first cycle was at 95°C for 15 minutes. PCR products were analyzed on 1% to 1.5% agarose gels. In some cases, the amount of PCR product on the gel was quantified by a densitometric analysis of the inverse image of the ethidium bromide‐stained bands using the Scion Image program (Scion Corporation, Frederick, MD).
Table 1. PCR Primers Used for RT‐PCR
Sequenced RT‐PCR products were used as positive controls and water replacing the RNA in the cDNA synthesis step or the cDNA template in the PCR was used as negative controls. RT‐PCR in the absence of reverse transcriptase was used to distinguish between amplification of reverse transcribed cDNA and amplification of contaminating genomic DNA. Also, primers were designed to amplify targets spanning introns. If PCR products were detected in the absence of reverse transcription or if product lengths reflected inclusion of these introns, the RT‐PCR was repeated on samples treated with DNase I (Ambion, Austin, TX). Only results from samples free of genomic DNA contamination are reported below.
Confirmation of RT‐PCR Products by Southern Blotting with Sequence Confirmed Probes
The 320‐bp actin and 226‐bp GAPDH cloned cDNAs were labeled with fluorescein by random priming, hybridized to Southern blotted PCR products, and detected by chemiluminescence according to manufacturer's recommendations (ECL Random Prime Labeling and Detecting Systems, Amersham Biosciences).
Laser Capture Microdissection (LCM)
Cells were captured from 6‐ to 8‐µm sections of frozen or paraffin‐embedded tissue stained with hematoxylin and eosin Citation[[22]] by LCM (Laser Capture Microdissection System, PixCell II, Arcturus Engineering Inc., Mountain View, CA) using 7.5‐ to 15‐µm diameter laser spots at 50‐ to 100‐mV threshold voltage and 50hyphen; to 80‐mW pulse power. Captured cells were immediately processed for RNA extraction with TRIzol.
Statistical Analysis
A regression analysis of the yield of RNA per mg of frozen lung tissue versus number of years of tissue storage before the RNA was extracted, together with an analysis of variance on the regression data, was undertaken to determine whether storage time affected RNA yield. Similarly, this regression analysis was applied to the densities of the bands representing the RT‐PCR products of RNA from tissues stored frozen for various times. The PCR products included the 296‐ and 983‐bp GAPDH and the 499‐bp ILK targets and the 499‐bp ILK product corrected by that of the 296‐bp GAPDH housekeeping gene product from the same RNA preparation. To determine whether the method of tissue preservation, that is, inflating with OCT and subsequent freezing at − 70°C or fixing in formalin and embedding in paraffin, affected RNA yields a comparison of the yields from these lung tissues was made by a one‐tailed t‐test assuming equal variances. In all analyses, p ≤ 0.05 was considered significant.
Results
Yields of the Extracted RNA
RNA extraction methods were first tested on A549 cells. Analysis on the Agilent 2100 Bioanalyzer showed that 52 ± 20 ng of total RNA was extracted from 1000 A549 cells with either the RNeasy Kit or with TRIzol. No significant difference was found between the two methods (data not presented). Multiple cryosections or blocks of frozen tissue weighing from 2 to 150 mg yielded 257 ± 183 ng of total RNA per mg of tissue (average ± SD, n = 23) by either of these two methods. Although there was considerable variation in the yields, a regression analysis of the RNA per mg tissue plotted against the number of years in storage ranging from two to nine years, that is, from 1993 to 2001, gave an r value of 0.213 with a p = 0.3178 from the analysis of variance indicating that the yield was not affected by storage time. TRIzol extraction of multiple sections of paraffin‐embedded tissue weighing 50 to 70 mg after deparaffinization yielded 77 ± 56 ng of RNA per mg of tissue (average ± SD, n = 6). This yield was significantly lower than the yield from the frozen tissue (p ≤ 0.01).
RNA Purity
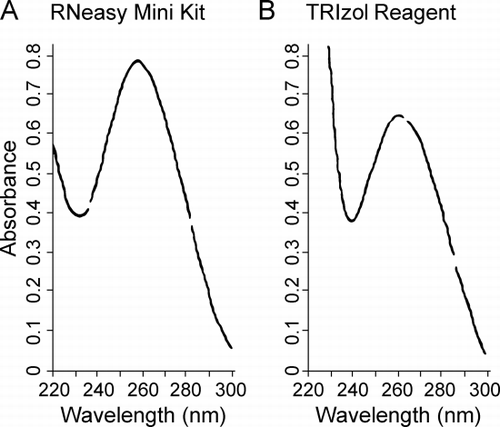
Enough RNA was extracted from 18 of the 23 frozen lung samples to carry out an additional analysis by spectroscopy and measure absorbance between 220 and 300 nm. Absorbance curves with a single peak at 260 nm were observed for samples from frozen tissue prepared with the RNeasy Mini Kit () or with TRIzol (). In 16 of the 18 frozen lung samples examined in this manner the ratio of the absorbance at 260 nm to that at 280 nm was greater than 1.80 and for all 18 samples the average ratio was 1.92 ± 0.24 (average ± SD). RNA from cultured cells gave results similar to that in and . RNA extracted with TRIzol from the paraffin‐embedded tissue gave curves similar to that in .
Figure 1. Purity of the extracted RNA. RNA from lung tissue frozen in Optimal Cutting Temperature compound was analyzed by UV absorbance between 220 and 300 nm. (A) RNA extracted with RNeasy Mini Kit. (B) RNA extracted with TRIzol reagent. Both show single peaks at 260 nm.
RNA Size Analysis
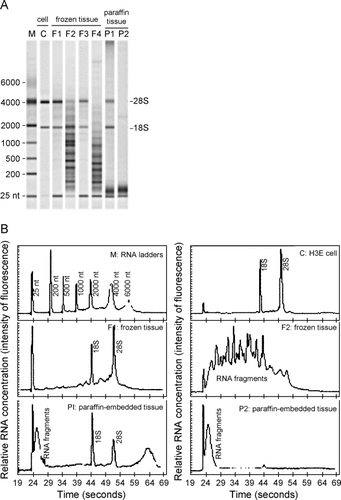
All the RNA samples extracted above from the cultured cells or tissues were analyzed on the Agilent 2100 Bioanalyzer. Selected examples of the results from this analysis are shown in . RNA extracted from HBE cells had sharp bands (, lane C) or peaks (, panel C) representing the 28S and 18S ribosomal RNAs. Similar results were obtained from A549 cells (data not shown). No difference in the results of this analysis was found between RNA samples extracted with TRIzol or the RNeasy Mini Kit (data not shown). Eleven of the 23 RNA samples extracted from frozen tissue had at least one intact ribosomal RNA subunit (, lanes F1 and F3; , panel F1), although the presence of the 25 nucleotide band and the smearing between the 18 and 28S bands, not seen in HBE cell RNA, indicated some degradation. Of the eleven, seven had both 18 and 28S ribosomal subunits and the average ratio of 28S ribosomal RNA to that of the 18S was 1.47 ± 0.70 compared to 1.95 ± 0.17 (average ± S.D., respectively). The remaining samples from the frozen tissue contained degraded ribosomal RNA (, lanes F2 and F4; , panel F2). While RNA subunits were present in 2/6 samples from paraffin‐embedded tissue (dT)a5, indications of RNA degradation were found in the same samples (, lane P1; , panel P1). The remaining paraffin‐embedded samples contained severely degraded RNA (, lane P2; , panel P2). Confirmation of the presence of the 28S and 18S ribosomal RNA bands was made when some of these RNA samples from the A549 cells, the frozen tissue and paraffin‐embedded tissue were analyzed on 1% agarose gels (data not shown).
Figure 2. RNA size analysis. RNA was analyzed on the Agilent 2100 Bioanalyzer. (A) Representative results of the analysis displayed in a gel electrophoresis format. RNA extracted with TRIzol from human bronchial epithelial (HBE) cells (lane C), frozen tissues (lanes F1–F4), and paraffin‐embedded tissues (lanes P1–P2). Lane M is an RNA ladder as size markers with the nucleotide sizes on the left and the expected positions of the 28 and 18S ribosomal RNA indicated on the right of the gel. (B) Representative results displayed in chromatographic format. Panels are labeled as the lanes in (A) and correspond to the same RNA samples as in (A), except F3 and F4 are not shown.
Confirmation of PCR Products
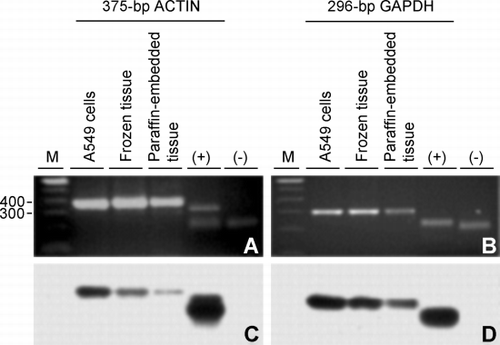
The RT‐PCR with the primers for the 375‐bp actin and 296‐bp GAPDH targets amplified products of the expected size from all three RNA sources, that is, from A549 cells and from frozen and paraffin‐embedded tissues ( and , respectively). After Southern hybridization with the corresponding sequence confirmed actin or GAPDH probes from pBS‐actin or pBS‐GAPDH, respectively (see Materials and Methods), chemiluminescence results confirmed that the PCR products represented those expected from the PCR targets ( and ). The positive controls, restriction fragments carrying the corresponding cDNA from pBS‐actin and pBS‐GAPDH, respectively, hybridized with the expected probe ( and , lanes marked as “+”), while the negative controls, cDNA fragments from the noncorresponding plasmid, did not hybridize ( and , lanes marked as “−”). The 375‐bp actin RT‐PCR product from the frozen tissue was also confirmed by restriction enzyme digestion (data not shown).
Figure 3. Confirmation of RT‐PCR products by Southern hybridization. (A) Agarose gel of the 375‐bp actin RT‐PCR product amplified from RNA extracted from A549 cells, frozen lung tissue and paraffin‐embedded lung tissue and, as positive and negative controls of hybridization, a partial restriction digest of pBS‐actin (lane +) and the purified restriction fragment carrying the sequence confirmed glyceraldehyde 3‐phosphate dehydrogenase (GAPDH) cDNA from pBS‐GAPDH (lane −), respectively. (B) Same as in A except the 296‐bp GAPDH product was amplified and controls are the GAPDH cDNA from pBS‐GAPDH (lane +) and the purified restriction fragment carrying the sequence confirmed actin cDNA from pBS‐actin (lane −). (C) Film detecting chemiluminescence after Southern transfer of (A) and hybridization with the actin cDNA from pBS‐actin used above. (D) Same as in (C) except the gel in (B) was transferred followed by hybridization with cDNA from pBS‐GAPDH used above. Lane M is a 100‐bp DNA ladder with bp sizes indicated at the left of (A).
RNA Integrity by RT‐PCR
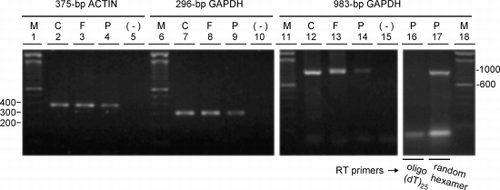
The quality of the RNA for RT‐PCR was tested on the total RNA extracted from A549 cells and the randomly selected cores of frozen tissue or blocks of paraffin‐embedded tissue. Equal amounts of total RNA from representative samples were used as template for cDNA synthesis from oligo(dT)25 primers. The cDNA was then used as template for PCR using three pairs of primers to amplify the 375‐bp actin, 296‐bp GAPDH and 983‐bp GAPDH targets. RNA from all three sources amplified the three targets to varying levels (). The RNA from the A549 cells and the frozen tissue amplified the 375‐bp actin and 296‐bp GAPDH targets similarly. The paraffin‐embedded tissue gave consistently lower amounts of all three products, most notably the longer 983‐bp GAPDH product (, lane 14). Interestingly, amplification of this target from the paraffin‐embedded tissue was improved when reverse transcription was primed from random hexamers rather than from oligo(dT)25 (, compare lane 16 to 17). Densitometric inspection of the bands representing the products of the 375‐bp actin and 296‐bp GAPDH targets on the ethidium‐stained agarose gels showed that the amplification efficiency from these two pairs of primers was similar (data not shown).
Figure 4. Integrity of RNA extracted from frozen versus paraffin‐embedded tissue. RNA extracted from (C) A549 cells, (F) frozen tissue, and (P) paraffin‐embedded tissue was analyzed by RT‐PCR using primer pairs specifying the 375‐bp actin, 296‐bp glyceraldehyde 3‐phosphate dehydrogenase (GAPDH) and 983‐bp GAPDH targets. Ethidium bromide‐stained gels of the 375‐bp actin (lanes 2–5), 296‐bp GAPDH (lanes 7–10) and 983‐bp GAPDH (lanes 12–15, 16, 17) products are shown and include the respective negative controls (−) where the cDNA was replaced by distilled water in the PCR reactions. cDNA was synthesized from equal amounts of RNA as template using oligo (dT)25 as the primer for reverse transcriptase except for lane 17 where random hexamers were used. (M) 100‐bp DNA ladders with bp sizes indicated at the left of the gel for the 375‐bp actin and 296‐bp GAPDH targets and at the right for the 983‐bp GAPDH target.
RNA Integrity Versus Storage Time of Frozen Tissue
Ten cases of frozen lung tissue were selected from those entered into the tissue bank from 1995 to 2001 to reflect different storage times at − 70°C. Equal amounts of RNA extracted with TRIzol from these tissue samples were used for the amplification of the 296‐bp or 983‐bp GAPDH targets ( and , respectively) by RT‐PCR. Successful amplification was observed in all ten samples tested although in one case from 1998 a very faint band was observed after amplification of the longer 983‐bp GAPDH target (, 7th lane from left). A regression analysis of the densities of the bands representing the PCR products of the 296‐ and 983‐bp GAPDH targets versus storage time gave an r = 0.223 and 0.278 with p = 0.54 and 0.44, respectively.
Figure 5. RNA integrity versus tissue storage time. Ethidium bromide‐stained agarose gels of (A) the 296‐bp glyceraldehyde 3‐phosphate dehydrogenase (GAPDH), (B) 983‐bp GAPDH and (C) 499‐bp integrin‐linked kinase (ILK) RT‐PCR products amplified from equal amounts of RNA extracted from frozen lung tissues that were selected to span entry dates into the tissue bank between 1995 to 2001. (−) negative control where cDNA was replaced with distilled water in the PCR reactions; (M) size markers with the corresponding bp sizes indicated at the left of the gels.
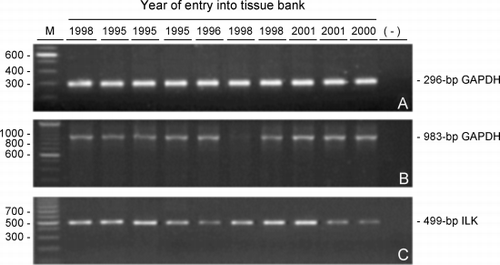
Because mRNA from housekeeping genes such as GAPDH may be more abundantly represented in the RNA population than those of other genes, we tested the expression of the ILK gene using primers to amplify a 499‐bp ILK target () from the same ten RNA samples tested above. The expected 499‐bp product was amplified in all samples tested () but, in contrast to a housekeeping gene, specifically the 296‐bp GAPDH target, where the level of amplification was fairly constant from tissues stored over the six year range, greater variation in amplification levels was observed with the 499‐bp ILK target (). However, that this variation did not appear to reflect the time in storage was confirmed when a regression analysis of the density of the ILK product, either uncorrected or corrected by that of 296‐bp GAPDH product, over time gave an r = 0.146 and 0.205 with p = 0.69 and 0.57, respectively.
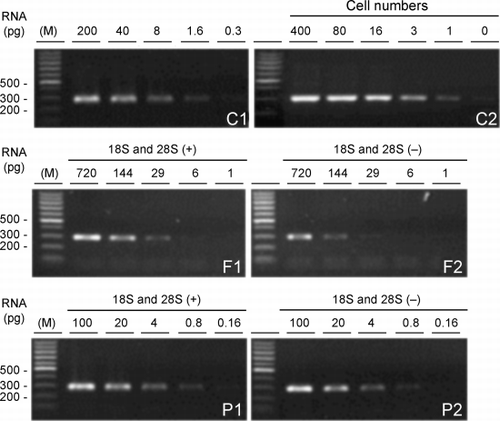
Minimal RNA Requirement for RT‐PCR
RNA from A549 cells and the samples shown in representing each of the two different processes used to archive lung tissue, that is, tissue frozen in OCT and paraffin‐embedded tissue, was serially diluted 5‐fold and used for RT‐PCR to determine the minimal amount of RNA required for detectable amplification of the 296‐bp GAPDH target. The minimal amount of RNA required from tissue frozen in OCT was 29 pg when ribosomal RNA subunits were intact (, F1) and 144 pg when these subunits were absent (, F2). For the paraffin‐embedded tissue at least 0.8 ng RNA, either with or without ribosomal RNA subunits, was necessary for detectable amplification (, P1 and P2). In comparison, when RNA from A549 cells that served as controls was serially diluted 5‐fold or when decreasing numbers of these cells were used for RNA extraction, 1.6 pg of RNA or RNA from one cell was adequate to detect the 296‐bp GAPDH PCR product on ethidium bromide‐stained agarose gels (, C1 and C2). When the 375‐bp actin or 499‐bp ILK targets were tested less than ten A549 cells were required (data not shown)
Figure 6. Minimal requirement of total RNA for RT‐PCR. Initial RNA concentrations were determined by the Agilent 2100 Bioanalyzer. Ethidium bromide‐stained agarose gels of the 296‐bp glyceraldehyde 3‐phosphate dehydrogenase (GAPDH) product from RNA from A549 cells (C1) and from the samples shown in representing each of the two different tissue sources, frozen tissue with (F1) or without (F2) ribosomal RNA subunits and paraffin‐embedded tissue with (P1) or without (P2) ribosomal RNA subunits are shown where the RNA was serially diluted 5‐fold before RT‐PCR. The amount of RNA used for RT‐PCR is indicated above the gels. Similarly, RNA extracted from decreasing numbers of A549 cells (C2) was amplified. Leftmost lanes in each gel (M) are size markers with bp sizes indicated at the left of the gels.
Removal of OCT from Frozen Tissue
Following RNA extraction with TRIzol, RT‐PCR of the 375‐bp actin target showed that amplification of this target from the sections rinsed with any of the tested solutions was similar to that of the unrinsed sections (data not shown). From the solutions tested, 70% ethanol was chosen for the rinsing step in the present study.
RT‐PCR with RNA Extracted from LCM‐Captured Cells
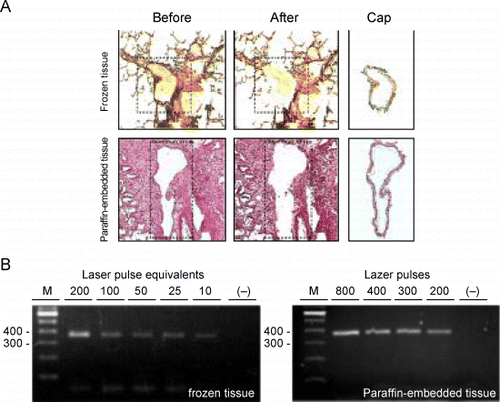
Airway cells in a cryosection of frozen tissue or a section of paraffin‐embedded tissue were captured by LCM and transferred to an LCM cap for further RNA extraction. A cluster of a few cells or even a single cell could be consistently captured (data not shown). Representative images before the capture (, left column), after the capture (, middle column) and of the captured tissue (, right column) from frozen and paraffin‐embedded tissue (, top and bottom rows, respectively) demonstrate that the epithelial layer of an airway could be isolated for RNA extraction.
Figure 7. RT‐PCR of RNA extracted from cells obtained by laser capture microdissection (LCM). A. Representative micrographs of tissue sections stained with hematoxylin and eosin and captured cells processed by LCM. Top row represents a section of frozen lung tissue; bottom row: paraffin‐embedded lung tissue. Leftmost column represents sections before transfer of cells by LCM. The dashed line outlines the areas from which the cells will be transferred. Middle column represents the same sections after LCM. Note that the layer of airway tissue is absent. Rightmost column represents the cells that were captured onto the caps. The bar in the bottom right micrograph is representative of the magnification on all six micrographs and equals 200 µm. B. On the left is an agarose gel of the 375‐bp actin RT‐PCR products from 2‐fold serial dilutions of RNA that was extracted from airway cells captured with 200 laser pulses from frozen lung tissue and on the right, of RNA extracted from cells captured from paraffin‐embedded lung tissue using decreasing numbers of laser pulses. The lanes marked “−” represent RT‐PCR of the distilled water negative control. The leftmost lanes in each gel (M) are size markers with bp sizes indicated to their left. (Full color version available online.)
To determine if the processing time during the preparation of the tissue for LCM and during LCM itself affected RT‐PCR results, the total time taken to cut, mount onto slides, stain with hematoxylin and eosin, dehydrate in xylene, and to process sequential cryosections of frozen tissue by LCM was monitored. RT‐PCR of the 375‐bp actin target from RNA extracted from the captured cells showed that under our conditions of preparation and LCM processing amplification of this target was unaffected for up to a total of 60 minutes of processing time (data not shown).
To obtain an estimate of the minimum amount of tissue captured by LCM that was required for detectable levels of RT‐PCR amplification, different numbers of laser pulses were applied to the sections of lung tissue. The images taken before and after LCM () demonstrated that the targeted tissue was effectively captured. RNA extracted with TRIzol from the captured cells was analyzed by RT‐PCR of the 375‐bp actin target and the PCR products were visualized on agarose gels stained with ethidium bromide. It was estimated that for cryosections the number of laser pulses applied was similar to the number of the LCM‐captured cells under optimal conditions of transfer, which in this case was 7.5‐µm laser spot size, 50‐mV threshold voltage, and 50‐mW pulse power. A representative sample of RNA from cells captured from 8‐µm cryosections using 200 of these laser pulses was serially diluted 2‐fold and tested by RT‐PCR. The results showed that amplification of the β‐actin target from RNA of cells captured by an equivalent to 10 pulses or 10 cells was detectable (, left panel, 6th lane from left). For paraffin‐embedded tissue different numbers of laser pulses were applied to 8‐µm sequential sections from a tissue block and the RNA extracted from the captured cells was tested by RT‐PCR. Compared to frozen tissue, more laser pulses were required for an equivalent amplification of the β‐actin target from paraffin‐embedded tissue (, right panel).
Discussion
Quantitative analysis of lung histology requires the lung to be either inflated with fixative and processed into paraffin tissue blocks Citation[[23]] or inflated with a support medium for cutting frozen tissue (OCT or Cryomatrix) and rapidly frozen over liquid nitrogen to obtain samples that can be used to cut histological sections Citation[[24]]. The purpose of the present study was to determine the feasibility of extracting RNA of suitable quality to investigate gene expression from tissue prepared by either method and stored, in one case, as paraffin blocks for up to 20 years and, in the other, as frozen cores of tissue for up to ten years. The results discussed below show that RNA extracted from tissue stored in either form can be used for studies of gene expression by RT‐PCR. Although we did not compare formalin fixation to rapid freezing in the same lungs, our results show that inflating the lung with a support medium for cutting frozen tissue and rapidly freezing the entire specimen as soon as possible after its removal from the patient provides several clear advantages over formalin‐fixed tissue obtained from archival sources.
RNA extraction methods use guanidine thiocyanate as a protein denaturant Citation[[25]] and both the TRIzol reagent and the RNeasy Mini Kit represent major RNA purification options based on this reagent Citation[[26]]. To select a method suitable for extracting RNA from the tissue in our bank, we compared the purity of RNA extracted with TRIzol to that extracted with the RNeasy Mini Kit and used the UV‐absorbance curve generated between 230 to 300 nm as the criterion of purity of the extracted RNA. Both methods gave satisfactory results from cultured cells and frozen lung tissue. While paraffin‐embedded tissue was only tested by TRIzol extraction, the purity of the RNA extracted by this method was comparable to that from frozen tissue.
Conventional methods used to analyze RNA integrity such as agarose gel electrophoresis require µg quantities of RNA for adequate detection but a recently developed molecular size analysis system, the Agilent 2100 Bioanalyzer based on electrophoresis through microchannels, allows size and concentration to be determined at the same time on ng quantities of RNA. Using this more sensitive analysis tool we determined that the RNA yield per weight of tissue was greater from frozen cores than from the paraffin‐embedded tissue. Based on the detection of the ribosomal subunits, half the frozen cores provided intact RNA, whereas only a third of the paraffin‐embedded samples contained these subunits. The higher quality of the RNA as reflected by the presence of the ribosomal subunits was confirmed by RT‐PCR of a 296‐bp GAPDH target where almost five times less RNA was required for successful amplification when these subunits were present than when they were absent.
The RNA extracted from both frozen and paraffin‐embedded lung tissue supported RT‐PCR of the mRNAs that we tested. Surprisingly, RNA extracted from most of the samples of the paraffin‐embedded tissue was amplified despite the fact that its quality and quantity were lower than those from frozen tissue. Initially, the quality of the RNA as measured on the Agilent 2100 Bioanalyzer showed that the RNA integrity, judged by the presence of ribosomal RNA subunits, was lower for the embedded tissues. This lower quality was reflected in the reduced levels of amplification of the 983‐bp GAPDH target from RNA extracted from this tissue when reverse transcription was primed with oligo(dT)25. Interestingly, we found that in the case of the RNA extracted from the embedded samples, priming with oligo(dT)25 was less effective than priming with random hexamers. Presumably because RNA from this source is fragmented to a greater degree than that from frozen tissue, the site of priming by oligo(dT)25, that is the polyA tail of the mRNA, is more likely to be absent or, if present, is physically separated from the sites of subsequent PCR priming. Additional quantitative studies are warranted before the generalization can be made that random priming is more effective than priming with oligo(dT) for RT‐PCR of RNA from paraffin‐embedded tissue.
The yield of RNA per weight of tissue was also lower from the paraffin‐embedded tissue than from frozen tissue. Although the yield of RNA per wet weight of frozen tissue cannot be directly compared to that of the dehydrated tissue that had been embedded in paraffin then deparaffinized, the following argument can be made in support of the lower yield from the paraffin‐embedded material. Since the weight of the tissue after paraffin embedding would be a fraction of its original weight, the yield of RNA per weight of tissue should have been further reduced had a correction for the loss in weight due to dehydration been made. Further differences in the RNA recovered from the two sources are reflected in the finding that samples from the paraffin‐embedded tissue required more LCM captured cells to attain the same level of amplification of the 375‐bp β‐actin target than that from frozen tissue. This difference could be attributed to differences in RNA yield or integrity or both. Overall, the results comparing these two lung tissue sources of RNA suggest that frozen lung is superior to paraffin‐embedded tissue for studying gene expression by RT‐PCR.
That lung tissue frozen in OCT is a good source of RNA for expression studies is further supported by our other results. A comparison of the amplification of the 296‐ and 983‐bp targets of the abundant GAPDH housekeeping mRNA to that of the 499‐bp ILK mRNA showed that RT‐PCR was effective over a range of target sizes and expression levels with the minimal amount of starting RNA required for the 296‐bp GAPDH target being in the 6 to 29 pg range. Neither the integrity of RNA, based on the near consistent amplification of the RT‐PCR targets ranging in size from 296‐ to 983‐bp, nor its yield was affected by the time the tissue was stored in the frozen state. Although greater sample to sample variation in levels of amplification of the 499‐bp ILK target was found compared to that of the 296‐bp GAPDH target, ILK product was consistently present. The greater variation in RT‐PCR of ILK could be attributed to its lower levels of expression or larger size compared to this GADPH target. Alternatively, this variability could reflect a real difference in the expression of this gene in the different lung specimens. This possibility is supported by studies showing that ILK gene expression can differ with disease state Citation[[27]], despite the fact that its promoter, like that of housekeeping genes, has no TATA box and is GC rich Citation[[28]]. Results from our LCM studies, as noted above, showed that the sensitivity of RT‐PCR on RNA isolated from the captured cells was greater when the starting material was frozen rather than paraffin‐embedded. Together, these results suggest that inflating the lung with a support medium for cutting frozen tissue and rapidly freezing the entire specimen as soon as possible after it is removed from the patient provides the best opportunity to analyze gene expression, particularly at the cellular level.
While a standardized protocol for tissue collection has been used from 1979 to the present, differences in disease state, surgical procedure, and features of processing and storage of tissue that are beyond our control could affect tissue RNA integrity. This source of variation can be minimized in COPD because the heterogeneous nature of the disease provides the opportunity to compare normal and diseased tissue within the lung of a single patient. The procedure described here of rapidly freezing the lung samples after inflating them with a support medium for cutting frozen tissue provides the opportunity to compare gene expression to quantitative histology. Furthermore, the combination of immunostaining to identify specific cell types in adjacent tissue from the same lung with the more recently developed LCM technology Citation[[29]]Citation[[30]]Citation[[31]]Citation[[32]] to isolate specific airway cells allows the extraction of RNA from these cells for subsequent analysis on high‐density oligonucleotide microarrays Citation[[33]]Citation[[34]]Citation[[35]]. In this manner our procedure could provide an important tool for determining the differences in gene expression between regions of the same lung of patients with COPD, for example, to compare regions of diseased to normal lung as assessed by morphological and histological analyses of the same tissue.
Previous studies of COPD based on this tissue bank with its associated patient registry have emphasized the importance of the inflammatory process in the pathogenesis of chronic bronchitis Citation[[1]], small airway obstruction Citation[[11]] and emphysema Citation[[16]]. They have also shown that this peripheral lung inflammatory process is amplified in patients with severe emphysema compared to those with similar age and smoking history who have maintained normal lung function Citation[[16]]. The precise reason for the amplification of the inflammatory response in smokers who develop disease is not known and could be related to either host or environmental factors. Although our RT‐PCR analyses were not strictly quantitative, partly due to the fact that we are dealing with the expression of housekeeping genes and consequently lacking a valid reference RNA, this report, nonetheless, demonstrates that our stored frozen tissue provides high‐quality RNA for gene expression studies in the human lung where normal and diseased regions of the same lung can be compared. It also shows that individual cells from both airways and parenchyma can be isolated for analysis of gene expression and the results examined in relation to histology. Such studies of gene expression in this tissue should provide insight into the heterogeneous nature of both the airway and parenchymal disease within the same patient and lead to a better understanding of the marked difference in the response to tobacco smoke exposure between individuals. Also the suitability of this tissue for quantitative histology with comparisons to lung function and CT scans Citation[[16]]Citation[[24]], provides an approach to translating basic research findings directly into the clinical setting.
Acknowledgments
We thank Kate Blood (Gene Array Facility, The Prostate Centre at Vancouver General Hospital, Vancouver, Canada) for RNA analysis on Agilent 2100 Bioanalyzer. RNA from HBE cells was prepared by Dr. Emiko Ogawa (McDonald Research Laboratories, University of British Columbia).
References
- Mullen J BM, Wright J L, Wiggs B, Pare P D, Hogg J C. Reassessment of inflammation in the airways of chronic bronchitis. Br Med J 1985; 291: 1235–1239
- Hogg J C, Macklem P T, Thurlbeck W M. Site and nature of airways obstruction in chronic obstructive lung disease. N Engl J Med 1968; 278: 1355–1360, [PUBMED], [INFOTRIEVE]
- Niewoehner D E, Kleinerman J, Reisst D B. Pathologic changes in the peripheral airways of young cigarette smokers. New Engl J Med 1974; 291: 755–758, [PUBMED], [INFOTRIEVE]
- Cosio M, Ghezzo M, Hogg J C, Corbin R, Loveland M, Dosman J, Macklem P T. The relation between structural changes in small airways and pulmonary function tests. New Engl J Med 1978; 298: 1277–1281, [PUBMED], [INFOTRIEVE]
- Snider G L, Kleinerman J L, Thurlbeck W M, Bengally Z H. Definition of emphysema. Report of a National Heart, Lung and Blood Institute, Division of Lung Diseases. Am Rev Respir Dis 1985; 132: 182–185
- Wright J L, Lawson L, Pare P D, Hooper R O, Peretz D I, Nelems J M, Schultzer M, Hogg J C. The structure and function of the pulmonary vasculature in mild chronic obstructive pulmonary disease. Am Rev Respir Dis 1983; 128: 702–707, [PUBMED], [INFOTRIEVE]
- Barbera J A, Riverola A, Roca J, Ramirez J, Wagner P D, Ros D, Wiggs B R, Rodriguez‐Roisin R. Pulmonary vascular abnormalities and ventilation–perfusion relationships in mild chronic obstructive pulmonary disease. Am J Respir Crit Care Med 1994; 149: 423–429, [PUBMED], [INFOTRIEVE], [CSA]
- Peinado V I, Barbera J A, Abate P, Ramirez J, Roca J, Santos S, Rodriguez‐Roisin R. Inflammatory reaction in pulmonary muscular arteries of patients with mild chronic obstructive pulmonary disease. Am J Respir Crit Care Med 1999; 159: 1605–1611, [PUBMED], [INFOTRIEVE], [CSA]
- Pride N B, Burrows B. Development of impaired lung function: natural history and risk factors. Chronic Obstructive Pulmonary Disease, P MA Calverly, N B Pride. Chapman & Hall, London 1995; 69–91
- Croxton T L, Weinmann G G, Senior R M, Wise R A, Crapo J D, Buist A S. Clinical research in chronic obstructive pulmonary disease: needs and opportunities. Am J Respir Crit Care Med 2003; 167: 1142–1149, [PUBMED], [INFOTRIEVE], [CROSSREF], [CSA]
- Hogg J C, Wright J L, Wiggs B R, Coxson H O, Opazo Saez A, Pare P D. Lung structure and function in cigarette smokers. Thorax 1994; 49: 473–478, [PUBMED], [INFOTRIEVE]
- Aubert J D, Dalal B I, Bai T R, Roberts C R, Hayashi S, Hogg J C. Transforming growth factor beta 1 gene expression in human airways. Thorax 1994; 49: 225–232, [PUBMED], [INFOTRIEVE]
- Bosken C H, Hards J, Gatter K, Hogg J C. Characterization of the inflammatory reaction in the peripheral airways of cigarette smokers using immunocytochemistry. Am Rev Respir Dis 1992; 145: 911–917, [PUBMED], [INFOTRIEVE], [CSA]
- Matsuse T, Hayashi S, Kuwano K, Keunecke H, Jefferies W A, Hogg J C. Latent adenoviral infection in the pathogenesis of chronic airways obstruction. Am Rev Respir Dis 1992; 146: 177–184, [PUBMED], [INFOTRIEVE], [CSA]
- Elliott W M, Hayashi S, Hogg J C. Immunodetection of adenoviral E1A proteins in human lung tissue. Am J Respir Cell Mol Biol 1995; 12: 642–648, [PUBMED], [INFOTRIEVE], [CSA]
- Retamales I, Elliott W M, Meshi B, Coxson H O, Pare P D, Sciurba F C, Rogers R M, Hayashi S, Hogg J C. Amplification of inflammation in emphysema and its association with latent adenoviral infection. Am J Respir Crit Care Med 2001; 164: 469–473, [PUBMED], [INFOTRIEVE], [CSA]
- Coxson H O, Mayo J R, Behzad H, Moore B J, Verburgt L M, Staples C A, Paré P D, Hogg J C. Measurement of lung expansion with computed tomography and comparison with quantitative histology. J Appl Physiol 1995; 79: 1525–1530, [PUBMED], [INFOTRIEVE]
- Coxson H O, Rogers R M, Whittall K P, D'Yachkova Y, Pare P D, Sciurba F C, Hogg J C. A quantification of the lung surface area in emphysema using computed tomography. Am J Respir Crit Care Med 1999; 159: 851–856, [CSA]
- Elliott W M, Wong E, Lee A, Moore B, Wilson J, McManus B, Hogg J C, Hegele R, Pare P. The iCAPTUR4E Registry: for the study of heart, lung and blood vessel disease. Biotech Histochem 2002; 77: 161
- Gruenert D C, Basbaum C B, Widdicombe J H. Long‐term culture of normal and cystic fibrosis epithelial cells grown under serum‐free conditions. In Vitro Cell Dev Biol 1990; 26: 411–418, [PUBMED], [INFOTRIEVE]
- Higashimoto Y, Keicho N, Elliott W M, Hogg J C, Hayashi S. Effect of adenovirus E1A on ICAM‐1 promoter activity in human alveolar and bronchial epithelial cells. Gene Expr 1999; 8: 287–297, [PUBMED], [INFOTRIEVE], [CSA]
- Bancroft J D, Stevens A. Theory and Practice of Histological Techniques4th ed. Churchill Livingstone, New York 1996
- Thurlbeck W M. The internal surface area of non‐emphysematous lung. Am Rev Respir Dis 1967; 95: 765–773, [PUBMED], [INFOTRIEVE]
- Coxson H O, Hogg J C, Mayo J R, Behzad H, Whittall K P, Schwartz D A, Hartley P G, Galvin J R, Wilson J S, Hunninghake G W. Quantification of idiopathic pulmonary fibrosis using computed tomography and histology. Am J Respir Crit Care Med 1997; 155: 1649–1656, [PUBMED], [INFOTRIEVE], [CSA]
- Chomczynski P, Sacchi N. Single‐step method of RNA isolation by acid guanidinium thiocyanate‐phenol‐chloroform extraction. Anal Biochem 1987; 162: 156–159, [PUBMED], [INFOTRIEVE], [CROSSREF]
- Dolter K E, Braman J C. Small‐sample total RNA purification: laser capture microdissection and cultured cell applications. Biotechniques 2001; 30: 1358–1361, [PUBMED], [INFOTRIEVE], [CSA]
- Sandhu H, Dehnen W, Roller M, Abel J, Unfried K. mRNA expression patterns in different stages of asbestos‐induced carcinogenesis in rats. Carcinogenesis 2000; 21: 1023–1029, [PUBMED], [INFOTRIEVE], [CROSSREF]
- Melchoir C, Kreis S, Janji B, Kieffer N. Promoter characterization and genomic organization of the gene encoding integrin‐linked kinase 1. Biochim Biophys Acta 2002; 1575: 117–122
- Jin L, Tsumanuma I, Ruebel K H, Bayliss J M, Lloyd R V. Analysis of homogeneous populations of anterior pituitary folliculostellate cells by laser capture microdissection and reverse transcription‐polymerase chain reaction. Endocrinology 2001; 142: 1703–1709, [PUBMED], [INFOTRIEVE], [CROSSREF], [CSA]
- Murakami H, Liotta L, Star R A. IF‐LCM: laser capture microdissection of immunofluorescently defined cells for mRNA analysis. Kidney Int 2000; 58: 1346–1353, [PUBMED], [INFOTRIEVE], [CROSSREF]
- Fend F, Emmert‐Buck M R, Chuaqui R, Cole K, Lee J, Liotta L A, Raffeld M. Immuno‐LCM: laser capture microdissection of immunostained frozen sections for mRNA analysis. Am J Pathol 1999; 154: 61–66, [PUBMED], [INFOTRIEVE]
- Alevizos I, Mahadevappa M, Zhang X, Ohyama H, Kohno Y, Posner M, Gallagher G T, Varvares M, Cohen D, Kim D, Kent R, Donoff R B, Todd R, Yung C M, Warrington J A, Wong D T. Oral cancer in vivo gene expression profiling assisted by laser capture microdissection and microarray analysis. Oncogene 2001; 20: 6196–6204, [PUBMED], [INFOTRIEVE], [CROSSREF], [CSA]
- Ohyama H, Zhang X, Kohno Y, Alevizos I, Posner M, Wong D T, Todd R. Laser capture microdissection‐generated target sample for high‐density oligonucleotide array hybridization. Biotechniques 2000; 29: 530–536, [PUBMED], [INFOTRIEVE], [CSA]
- Alevizos I, Mahadevappa M, Zhang X, Ohyama H, Kohno Y, Posner M, Gallagher G T, Varvares M, Cohen D, Kim D, Kent R, Donoff R B, Todd R, Yung C M, Warrington J A, Wong D T. Oral cancer in vivo gene expression profiling assisted by laser capture microdissection and microarray analysis. Oncogene 2001; 20: 6196–6204, [PUBMED], [INFOTRIEVE], [CROSSREF], [CSA]
- Betsuyaku T, Griffin G L, Waston M A, Senior R M. Laser capture microdissection and real‐time reverse transcriptase/polymerase chain reaction of bronchiolar epithelium after bleomycin. Am J Respir Cell Mol Biol 2001; 25: 278–284, [PUBMED], [INFOTRIEVE], [CSA]