Abstract
The energy saving resulting from the equalization of Fermi energies of a crystal and its melt is added to the Gibbs free-energy change ΔG2ls associated with a crystal formation in glass-forming melts. This negative contribution being a fraction ε ls(T) of the fusion heat is created by the electrostatic potential energy −U0 resulting from the electron transfer from the crystal to the melt and is maximum at the melting temperature Tm in agreement with a thermodynamics constraint. The homogeneous nucleation critical temperature T2, the nucleation critical barrier ΔG2ls∗/kBT and the critical radius R∗2ls are determined as functions of εls(T). In bulk metallic glass forming melts, εls(T) and T2 only depend on the free-volume disappearance temperature T0l, and εls(Tm) is larger than 1 (T0l>Tm/3); in conventional undercooled melts εls(Tm) is smaller than 1 (T0l>Tm/3). Unmelted intrinsic crystals act as growth nuclei reducing ΔG2ls∗/kBT and the nucleation time. The temperature-time transformation diagrams of Mg65Y10Cu25, Zr41.2Ti13.8Cu12.5Ni10Be22.5, Pd43Cu27 Ni10P20, Fe83B17 and Ni melts are predicted using classic nucleation models including time lags in transient nucleation, by varying the intrinsic nucleus contribution to the reduction of ΔG2ls∗/kBT. The energy-saving coefficient ε nm(T) of an unmelted crystal of radius Rnm is reduced when Rnm ≪R∗2ls; εnm is quantified and corresponds to the first energy level of one s-electron moving in vacuum in the same spherical attractive potential −U0 despite the fact that the charge screening is built by many-body effects.
Introduction
Transformations such as liquid–solid or solid–liquid always induce changes in the conduction electron number per unit volume and sometimes per atom. The equalization of Fermi energies of a tiny particle having a radius smaller than a critical value and its melt produces an unknown energy saving −εv equal to a fraction εls of the fusion heat per unit volume. All crystal nucleation models describe the crystallization without taking account of ε v in metallic alloys [Citation1–3]; they have predicted that unmelted crystals are absent above the melting temperature Tm and that the solidification is governed by a homogeneous nucleation if extrinsic nuclei are absent. The unknown contribution −ε v has recently been added to the Gibbs free-energy change ΔG2ls(θ) associated with a nucleus formation in 38 liquid elements; the new critical energy barrier and the new surface energy are compatible with ε ls0=εls(θ=0) =0.217, where θ=T/Tm −1; in this model, tiny intrinsic crystals can survive above the melting temperature and act as heterogeneous nuclei for crystallization of a melt above a unique homogeneous nucleation critical temperature T2=Tm/3 or θ2=−2/3. The thermal variation of ε ls is an even function of θ having a maximum value εls0 for T=Tm; εls is equal to zero for θ=−2/3 or T=Tm/3 in agreement with the disappearance temperature T0l=Tm/3 or θ0l=−2/3 of the free volume in liquid elements [Citation4–6].
The same analysis is applied to metallic glass-forming melts because large values of εls0 induced by large relative changes ΔEF/EF of the Fermi energy EF are expected for two reasons: (i) a solidified eutectic alloy is composed of solid particles having compositions, densities and Fermi energies different from that of the melt [Citation7] and (ii) conduction-electron weak-localization effects are stronger in undercooled melts than in crystallized alloys [Citation8–10].
The θ2 dependence of the electronic energy saving coefficients εls(θ) of crystals reaching the critical size is determined on the basis of a thermodynamic constraint at the melting temperature. The glass-forming ability of any metallic melt is determined on the basis of the amplitude of εls0.
The unmelted crystal contribution ΔGnm to the free-energy change associated with crystal formation is dependent on its radius Rnm and on its own energy saving coefficient εnm0; ΔGnm reduces the critical energy barrier and is used as an adjustable parameter to calculate a temperature-time transformation (TTT) diagram in agreement with the experimental results in Mg65Y10Cu25, Zr41.2Ti13.8Cu12.5Ni10 Be22.5, Pd43Cu27 Ni10P20 and Fe83B17 taking account of time lags in transient nucleation [Citation11–18]. Direct observations of mean range order (MRO) regions in a conventional glass Fe83B17 are also used to test the model validity by assuming that these regions correspond to unmelted crystals. At low radius Rnm≪R2ls, εnm0 is much smaller than εls0.
The free-electron transfer e·n·Δz creates a crystal charge screened by conduction electrons moving around spherical crystals and by an electrostatic potential energy −U0, n being the number of atoms in the crystal and Δz the charge number excess per atom. Quantum effects are expected to reduce the electronic energy saving as compared with the potential energy. The first quantified energy level of a conduction electron moving in vacuum in the same spherical attractive potential well −U0 is compared with the experimental energy saving εv obtained in a metallic melt despite the fact that, in a metal, the charge screening is built by many-body effects.
Metallic glasses are quenched with cooling rates Rc varying from 106 to 0.004 K s−1 and depending on the elements involved in their composition [Citation7, Citation10–12, Citation19]. Above the glass temperature Tg, the first crystallization at a temperature Tx is produced in the undercooled liquid region using a heating rate Rh (K s−1) from the glass state; the transformation curves T
(t) have a nearly parabolic behavior with a nose temperature Tn(tn). The critical cooling rate
applied to the melt without crystallization and the heating rate Rh(K s−1) strongly depend on the presence of heterogeneous nuclei as recently confirmed for some Pd–Ni–Cu–P alloys; Rcc can be decreased by three orders of magnitude [Citation17, Citation20] during temperature cycling of samples from the glass state to a liquid state far above Tm.
Main results of a revisited crystal nucleation model
The classic growth nucleation model, in its present state, cannot be used to calculate the TTT curves because it predicts a large increase and a divergence of the energy barrier when T approaches the melting temperature [Citation1, Citation2, Citation11, Citation12, Citation21]. The new analysis of liquid undercooling experiments leads to the following formulae (1–6) [Citation4–6]; the Gibbs free-energy change for a crystal formation given by (Equation11 ) takes account of the energy saving εv related to the equalization of the particle Fermi energy to that of the melt
1
Here R is the crystal radius; the surface energy σ2ls [Citation1], ΔGv and εv are as expressed as follows
2
Here ΔHm is the fusion enthalpy per mole, Vm is the molar volume, α2ls is defined by (Equation6
6 ), ln[Kls(θ)]90±2 or (Kls1039±1 m−3 s−1);
corresponds to the free-volume disappearance temperature Tol; the fraction εls of the fusion heat per unit volume is an even function of θ as observed in many liquid elements and shown in figure . It has a maximum εls0 at the melting temperature (θ=0) is equal to zero for θ= θ0l or T=T0l regardless of the εls0 amplitude [Citation4–6]. The electronic energy coefficient εls(θ) being related to the free-electron density difference is expected to disappear with the free volume, εls=0 when ΔVm/Vm=0 for θ=θ0l and is maximum for εls=εls0 when ΔVm/Vm is maximum for θ=0; the derivative
has to be positive and equal to the fusion entropy per unit volume
at the equilibrium temperature θ=0 (T=Tm) of a bulk sample; this condition is met by (Equation2
2 ) because
The contribution O(θ4) to (Equation2
2 ) is neglected.
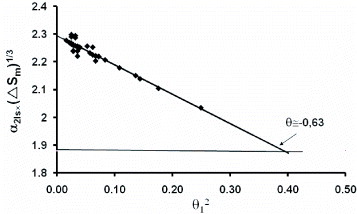
Figure 1 The quantities α2ls×ΔSm1/3 deduced in [Citation4] from α1ls×ΔSm1/3 assembled in [Citation3] for 38 elements are plotted as a function of θ2=θ21= (T1−Tm)2×Tm−2, θ1 or T1 being the temperature of the maximum undercooling of 38 liquid elements; α1ls has been determined in the past assuming that each element has its own homogeneous nucleation critical temperature T1 instead of T2=Tm/3 and using the classic nucleation growth model (εls = 0). A θ2 variation is observed and εls tends to be zero for θ 0≅−0.63. The quantity 1.88 is deduced from (Equation66 ) for εls=0 and ln Kls. The error bar on θ0l and ln Kls is of the order of 5%.
As already shown [Citation4–6], the new critical radius R∗2ls(θ) and the new critical energy barrier
given by (Equation3
3 ) are calculated setting d(ΔG2ls)/dR=0 and assuming that the surface energy independent of the radius for
or
is negligible:
3
Here kB is the Boltzmann constant and NA is the Avogadro number. Typical values of R∗2ls(Tm) extend from 1.8 nm for Si to 3.36 nm for Pb among 38 liquid elements [Citation4] and from approximately 0.6 to 0.8 nm among bulk metallic glass-forming melts (see table ).
The nucleation rate J per unit volume and per second [Citation1–3] in a homogeneous undercooled liquid is given by (Equation44 ) as a function of the critical barrier ΔG2∗(T)/kBT,
4
ln[Kls(T)]90±2 or (Kls1039±1 m−3 s−1 is temperature dependent; J attains a maximum equal to 1 when
5
θ2 is the homogeneous nucleation critical temperature that does not depend on ln[Kls(θ)] values because ΔG∗2ls/kBT ln(Kls)=g(θ=θ2)=1 regardless of the εls value as shown by (Equation4
4 ) and its derivative
For θ=θ2, g(θ2)=1 and in addition
is equal to zero [Citation4]; then
; ln J is maximum for θ=θ2 or T=T2. The relation (Equation6
6 ) results from g(θ2)=1.
6
The relation (Equation3
3 ) shows that tiny spherical crystals can survive above Tm up to θ=εls, i.e. θ=0.46 for T0l/Tm=1/3 and εls0=1. Their radii cannot increase because the critical barrier ΔG2ls∗ is diverging when θ tends to be θ=εls and is in fact reduced to a value smaller than the critical radius of liquid-droplet homogeneous nucleation [Citation5]; these subnanometer-sized crystals of radius R govern the crystallization for 0θθ2 because the homogeneous nucleation energy barrier
is reduced by the free-energy saving shown by (Equation1
1 ) and due to the previous solidification of unmelted crystals of radius R=Rnm.
Assuming that the intrinsic nuclei are very numerous regardless of the sample volume v, the steady-state nucleation rate J per unit volume and per second [Citation1–3, Citation11, Citation21] is given by:
7
Here v is the sample volume, tsn is the steady-state nucleation time and DGnm is the free-change associated with the previous solidification of unmelted crystals. The steady-state homogeneous nucleation time necessary to observe a first crystallization would be equal to 109 with a sample volume v = 1 mm3
.
Much larger J values are obtained in the presence of heterogeneous nuclei at higher temperatures; in this case, tsn is the steady-state nucleation time necessary to observe the first crystallization induced by one heterogeneous intrinsic nucleus at a temperature T when J⋅v⋅tsn=1 with J≫1. The nucleation rate J in the presence of unmelted crystals will be maximum at a temperature T2nm larger than T2 because d(ln J)/dθ now depends on the derivative of d(ΔGnm/kT)/dθ; T2nm can be determined at the minimum value of the steady-state nucleation time.
The steady-state nucleation rate is not only dependent on the critical energy barrier but also on the Kls value as shown by (Equation77 ); Kls(θ) is equal to a quantity Aη0 weakly varying with T divided by the viscosity η given by the Vogel–Fulcher–Tammann (VFT) equation [Citation11, Citation22] as shown by (Equation8
8 ) and (Equation9
9 )
8
The free-volume disappearance temperature T0l is chosen in (Equation8
8 ) to be equal to the VFT temperature TVFT of Mg65Y10Cu25, Zr41.2Ti13.8Cu12.5Ni10Be22.5, Pd43Cu27Ni10P20 and equal to Tm/3 in Fe83B17. Note that combining the VFT equation (Equation8
8 ) with the Doolittle relation defining the viscosity as a function of the free volume leads to T0l=TVFT [Citation11, Citation23, Citation24]. This equality is proved with a free-volume measurement of a Pd43Cu27Ni10P20 melt and a viscosity measurement of a Pd40Ni10Cu30P20 melt; the VFT temperature is equal to 447 K [Citation14, Citation15]; a linear extrapolation of the Pd43Cu27Ni10P20 glass volume to the crystal volume leads to T0l=452.3 K [Citation25].
All the free volumes would tend to be zero at T=T0l or θ=θ0l in the absence of a glass transition; the temperature T0l of the undercooled melt is extrapolated below Tg by using (Equation88 ) for the thermal variation of the melt viscosity [Citation11, Citation22, Citation23]; D∗ is the glass-fragility parameter; ln(Kls) is chosen equal to
9
The numerical constant ln A90 or A1039±1 m−3 s−1 in (Equation9
9 ) can be slightly changed for alloys [Citation21]; the viscosity of pure liquid elements is of the order of 0.002 Pa s and of η0; ln(Kls) is not strongly varying among many liquid elements and is equal to ln A=90±2 [Citation3, Citation4]. The values of Tm, ΔHm, Vm, Tg, θg, T0l, θ0l, D∗, θ2 and εls0l of some undercooled melts are given in table .
Table 1 The melting temperature Tm, fusion heat ΔHm per mole, molar volume Vm, glass transition temperatures Tg and θg=(Tg−Tm)/Tm, Vogel–Fulcher–Tammann temperature T0l of the undercooled melt, θ0l=(T0l−Tm)/Tm, glass fragility D∗
ln A as defined by (Equation99 ), electronic energy-saving coefficient ε ls0 at T=Tm associated with a crystal formation and θ2 are given for various melts with some references; the alloys no. 1 and no. 2 are Zr41.2Ti13.8Cu12.5Ni10Be22.5 and Pd43Ni10Cu27P20, respectively.
Metallic glass-forming melts classified on the basis of an electronic energy saving coefficient εls0 smaller or larger than 1
It is possible to calculate ε ls0 of each alloy only knowing T0l or θ0l. Equation (Equation1010 ) is obtained applying (Equation2
2 ) and (Equation5
5 ) for θ=θ2
10
There are two solutions for θ2 when εls0 is larger than a minimum value corresponding to the minimum electronic energy saving as described in figure ; the relations (Equation11
11 ) between εls0, θ2 and θ0l2 are met when εls0 is minimum and larger than 1
11
The second relation in (Equation11
11 ) is obtained by equalizing the derivatives of (Equation2
2 ) and (Equation5
5 ). The knowledge of θ0l and the use of (Equation11
11 ) determine ε ls0 and θ2 of any alloy having εls0>1 as given in table for several glass-forming melts; θ2 is always larger than −2/3 for εls0>1 or for θ0l>−2/3 as shown in figure ; θ2=θ0l=−2/3 for εls01.
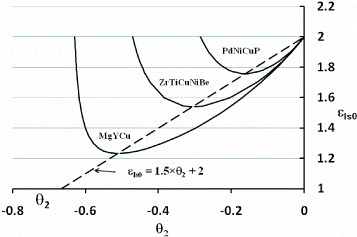
Figure 2 The electronic energy saving coefficients εls0(T=Tm) larger than 1 of Pd43Cu27Ni10P20, Zr41.2Ti13.8Cu12.5Ni10Be22.5 and Mg65Y10Cu25 are plotted as a function of θ2using (Equation1111 ), the homogeneous nucleation critical temperature T2 being defined as θ2=(T2−Tm)/Tm. The minimum value of εls0 given in table is a linear function of θ2 that fits the relation εls0=1.5θ2+ 2.
The existence of two glass-former classes is then predicted. The bulk metallic glasses correspond to εls0>1 and θ0l>−2/3 and conventional glasses to εls0<1 and θ0l=−2/3. The glass-forming ability of bulk metallic glass-forming melts satisfying T0l>Tm/3 can be defined using values of εls0 larger than one, εls0 being calculated using (Equation1111 ) from the knowledge of the free-volume disappearance temperature T0l. The isothermal structural relaxation tends to reduce the free-volume excess frozen by rapid cooling [Citation7]; out-of-equilibrium values of ε ls0 are then obtained by quenching and are relaxing down to a minimum value given by (Equation11
11 ). There is no minimum value of ε ls0 below 1 except εls(θ2)=0.
The free-volume disappearance temperature T0l is observable in spite of its freezing at T=Tg because a Pd43Cu27Ni10P20 specific-heat slope change in the glass state can be observed at this temperature T0l (see figure 2 of [Citation13]) when the glass specific heat becomes equal to the crystal one; this temperature is also deduced as being equal to TVFT from measurements of the equilibrium viscosity of the undercooled melt using (Equation88 ).
Temperature-time-transformation diagrams
The calculation of the first-crystallization nucleation time t has to take into account not only the steady-state nucleation time tsn but also the time lag τ ns in transient nucleation [Citation11] with
12
13
The time lag τns is proportional to the viscosity η while the steady-state nucleation rate J is proportional to η−1; the coefficient of Jτns in (Equation13
13 ) is not dependent on η [Citation11, p 270]; Γ is the Zeldovich factor, a0∗=π2/6, N the number of atoms per unit volume, jc the number of atoms in the critical sphere; Kls is defined by (Equation9
9 ); equation (Equation12
12 ) will also be applied when tsn is small compared with the time lag τ ns; a very small value of t/τns undervalues the time t by a factor 2 or 3 and has a negligible effect in a logarithmic scale [Citation11]. The first crystallization occurs when J= (vtsn)−1 in the presence of an intrinsic growth nuclei, v being the sample volume. The critical energy barrier is obtained using (Equation3
3 ) and the values of εls as a function of θ2; tsn is deduced from (Equation7
7 ) with ln(Kls) given by (Equation9
9 ). The various parameters used in these calculations are given in table . The energy barrier ΔGnm of intrinsic nuclei is calculated using (Equation1
1 ); the radius Rnm is temperature-independent down to the growth temperature; εnm (θ ) is assumed to vary as εls(θ) given by (Equation2
2 ).
The crystal of radius Rnm can act as a growth nucleus at any temperature TTm when ΔGeff/kBT is equal to ln[Kls(θ)vt]. The intrinsic unmelted crystals also induce the crystallization at the melting temperature Tm when the melt has been weakly overheated [Citation4]. The free-energy change definition could be criticized when the cluster is so small that it mainly contains surface atoms [Citation2]. In this case, the calculation of the TTT diagrams will show that the energy-saving coefficient εnm(θ= 0) of very small unmelted crystals is strongly weakened compared with εls0 for n=8–9 atoms; this reduction shows that εnm(θ=0) depends on the radius Rnm; the use of εls0 to calculate Rnm in Fe83B17 and in pure liquid elements when Rnm is a large fraction of the critical radius [Citation4–6] is nevertheless successful.
The time lag is easily obtained when tsn has been determined. The effect of τns in (Equation1212 ) is very important below the nose temperature of the TTT diagram and near the glass transition. It tends to stabilize the nose temperature somewhere between Tm and Tg and to protect the undercooled melt from crystallization; it determines a large fraction of the first-crystallization nucleation time between the nose temperature and the glass transition. The steady-state nucleation time tsn is minimum at temperatures much lower than the nose temperature Tn; then, Tn results from the competition between the increase in the time lag τns and the decrease in tsn with decreasing temperature.
Zr41.2Ti13.8Cu12.5Ni10Be22.5
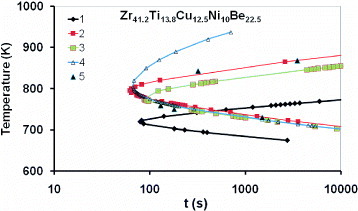
The TTT diagram has been studied using a containerless electrostatic levitation technique [Citation18]. The nose temperature and nose time are 800 K and 70 s, respectively. The TTT curves represented in figure are calculated using the parameters given in table with a sample volume v= 2.5 mm3 [Citation18, Citation26]. The value of ln A determines the nose temperature; the nose temperature no. 1 calculated with ln A=90 is much smaller than the others calculated with ln A=86. The TTT diagram no. 3 calculated with ln A=86, εls0=1.54, εnm0=1.54 and Rnm=0.404 nm is too wide compared with the experimental ones (figure 4 in [Citation18]). The black triangles are experimental points well represented by the curve 4 calculated with ln A= 86, εls0=1.54, εnm0= 0.91 and Rnm=0.32 nm. The electronic energy saving εnm0 is strongly reduced compared with εls0; such crystals could contain 8.5 atoms on average. The TTT diagrams below the nose temperature do not depend on various contributions ΔGnm of heterogeneous nuclei to the critical barrier because the time lags become much larger than the steady-state nucleation times.
Figure 3 The first crystallization temperature of a Zr41.2Ti13.8Cu12.5Ni10Be22.5 melt is plotted versus the nucleation time t. The temperature was calculated using parameters given in table assuming v=2.5 mm3 and εls0=1.54 [Citation18, Citation26]; Curve 1 (♦) ln A =90, εnm0=0.58 and Rnm=0.404 nm, curve 2 (×) ln A=86 εnm0=0.91 and Rnm=0.32 nm, curve 3 (▪) ln A=86, εnm0=0.83 and Rnm=0.335 nm, curve 4 (▵) ln A=86, ε nm0 = 1.54, Rnm=0.225 nm. Curve 2 (×) having a nose temperature of 795 K has to be compared with figure 4 in [Citation18]. The black triangles (dataset 5) are experimental points from [Citation18].
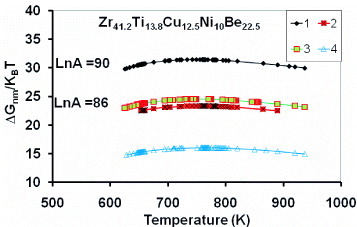
The values of ΔGnm/kBT corresponding to the TTT curves in figure are represented in figure by a diagram ΔGnm/kBT (T). The TTT diagram width becomes narrower using series 4 calculated points with εnm0=0.91 and in good agreement with the experimental results of [Citation18]; it is only modified by the variation of ΔGnm/kBT, Rnm and εnm being hidden variables.
Figure 4 The contribution ΔGnm/kBT of intrinsic heterogeneous nuclei to the effective critical energy barrier ΔGeff∗/kBT is calculated with (Equation11 ) and is weakly varying with the temperature. The Zr41.2Ti13.8Cu12.5Ni10Be22.5 TTT diagrams of figure use these contributions corresponding to various Rnm and εnm values: Curve 1 (♦) 0.404 nm and 0.58, curve 2 (×) 0.32 nm and 0.91, curve 3 (▪) 0.335 nm and curve 4 (Δ) 0.225 nm and 1.54.
These unmelted solid particles would have to melt when εls(θ)=0.91×(1−3.189 θ2); this disappearance is expected for θ=0.41 or T=1.41×Tm or 1.41×Tl, Tm=937 K and Tl=993 K being the liquidus temperature. This event would occur in the range of 1321–1400 K. An abrupt increase in the crystallization time has been observed at 830 K after an overheating in the range of 1250–1300 K [Citation18]; all unmelted clusters do not disappear above this temperature range because near-eutectic compositions contain several compounds that have melting temperatures higher than Tm; the model developed here uses a mean composition and a unique melting temperature.
Mg65Y10Cu25
The glass transition Tg and the crystallization temperature of Mg65Cu25Y10 alloy were measured in differential scanning calorimetry (DSC) scans with various heating rates Rh(K s−1) and cooling rates Rc(K s−1); Tg is slightly increased from 400 to 420 K with Rh(K s−1)varying from 0.002 to 10 K s−1 [Citation27] while the glass-undercooled melt transformation extends from 420 to 453 K. The alloy melting occurs between 730 and 739 K. The sample weights vary from 4 to 50 mg. Calculations are made using the parameters indicated in table and ln A=90 in two experiments. The TTT diagrams are indicated in figure by T[Rc(K s−1)] above the nose temperature Tn and T[Rh(K s−1)] below Tn, Rc and Rh being the cooling and heating rates, respectively, given by (Tm−T)/t and (T−Tg)/t and t being the nucleation calculated time at the temperature T. The series 2 curve is calculated with ln A=90, εnm0=1.23, Rnm=0.225 nm, v=16.4 mm3; its width is still very broad and the crystal would only contain 3 atoms. In contrast, the series 1 curve is obtained with εls0=1.23, εnm0=0.75, Rnm=0.36 nm, v=2.7 mm3; the only change in the series 3 curve is the sample volume v equal to 16.4 mm3; the increase in v moves the nose to a higher critical cooling rate Rcc without changing its width.
Figure 5 The first crystallization temperature of Mg65Y10Cu25 is plotted above the nose temperature versus the cooling rate Rc (K s−1) equal to (Tm−T)/t and below the nose temperature versus the heating rate (T−420)/t, t being the calculated nucleation time at temperature T. All the curves are calculated with ln A=90, εls0=1.23 and the parameters given in table ; curve 1 is calculated with Rnm=0.235 nm, εnm0=1.23 and a sample volume v=16.4 mm3; for the curves 2 and 4, ε nm0= 0.75, Rnm=0.36 nm and the sample volume, respectively, varying from 2.7 to 16.4 mm3. The best agreement with experimental points (curve 3) extracted from [Citation27] is obtained with curve 4 having Tn=590 K and Rcc=10 450 K s−1; this curve has to be compared with figure 6 of [Citation27].
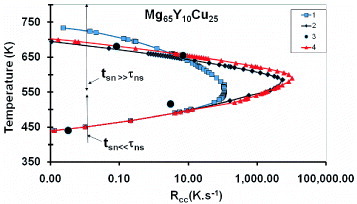
Several experimental points extracted from [Citation27] represented in figure by series 5 are in good agreement with the series 3 curve; Tn=590 K and tn=10450 K s−1 are obtained. A particle having a radius Rnm=0.36 nm contains 8.8 atoms on average. The nose is more pointed than expected in [Citation27]; the nose time and cooling rate are modified using the same factor when the volume is changed. Here, too, the TTT curves below the nose temperature do not depend on the contribution of heterogeneous intrinsic nuclei to the critical barrier because the time lag τns becomes much larger than the steady-state nucleation time tsn. The calculated TTT diagrams can be compared with the experimental ones represented in figure 8 of [Citation27].
Pd43Ni10Cu27P20
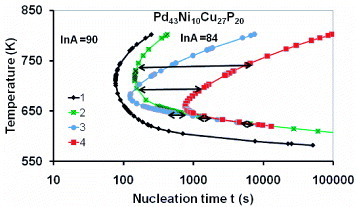
The DSC thermograms of this glass have been studied by isothermal crystallization at various temperatures using a few milligrams of samples processed in B2O3 [Citation16, Citation17, Citation28–31]. The first growth event corresponding to 1% crystallization is not reproducible above 700 K; a large dispersion of times has been observed as shown in refs. [Citation14, Citation15, Citation17, Citation20] and indicated in figure by horizontal bars. The points measured below 700 K are much less dispersed and used to evaluate ln A and the contribution ΔGnm/kBT of heterogeneous intrinsic nuclei to the reduction of the critical energy barrier given by (Equation77 ). Four TTT diagrams are plotted with the same sample volume v=0.32 mm3 chosen by experimentalists [Citation18] and calculated with parameters given in table ; the first curve on the left corresponds to ln A=90, εls0=εnm0=1.76, Rnm=0.194 nm and a nose temperature of 714 K. The only change in the second one is ln A=84. These two TTT diagrams have a very broad temperature width compared with the experimental results indicated by horizontal bars. The dispersion above 700 K is due to changes in the heterogeneous nuclei contribution depending on the temperature cycling of samples [Citation20]. Various values of t are obtained each time that a new sample is studied at the same temperature [Citation17]. This phenomenon has been viewed as being due to impurity nuclei governing the nucleation above 700 K; in particular, the T (t) noses are translated along the t axis when fluxed and unfluxed materials are compared [Citation32]. This could be due to the fact that the contribution of intrinsic nuclei to the reduction of the critical energy barrier above Tn would be smaller than the impurity one.
The first TTT narrow curve on the left of figure having Tn=680 K and tn=125 s has been calculated with a radius Rnm=0.295 nm, ln A= 84 and εnm0=0.6; the last one on the right having Tn=660 K, tn=764 s, ln A=84, Rnm=0.295 nm, and εnm0=0.5 corresponds to longer times experimentally observed above Tn [Citation16, Citation17] as well as in Pd43.2Cu28Ni8.8P20 and Pd40Cu30Ni10P20 [Citation20, Citation30, Citation31]. An unmelted crystal would contain about 7.9 atoms on average for Rnm=0.295 nm. There is a large uncertainty on εnm0 because 0.56<εnm0<0.6 is determined on the basis of an experimental width of the TTT curve that is not reproducible as a function of ln t.
Figure 6 The first crystallization temperature of Pd43Cu27Ni10P20 plotted versus the crystallization time logarithm; calculations were performed with v=0.32 mm3 and the parameters given in table [Citation13, Citation28, Citation29]: Curve 1 (♦) ln A=90, εls0=1.76, εnm0=1.76, Tn=714 K, Rnm=0.194 nm; Curve 2 (×) ln A=84 εls0=1.76, εnm0=1.76, Tn=714 K, Rnm=0.194 nm; Curve 3 (•) ln A=84, εls0=1.76, εnm0=0.6, Tn=680 K, tn=125 s, Rnm=0.295 nm; Curve 4 (▪) ln A=84, εls0= 1.76, εnm0=0.5, Tn=660 K, tn=764 s, Rnm=0.29 nm. The double arrows correspond to the experimental spread [Citation17, Citation20].
Nickel
The nucleation rate J in pure liquid elements has a maximum value for θ=θ2=−2/3 [Citation4]. The time lag is negligible. The glass transition would occur at T=0.246Tm as indicated in [Citation19]; the heating rate used to determine the glass transition would be 12 orders of magnitude smaller than the critical cooling rate [Citation19]. The TTT diagrams calculated with parameters given in table are represented as a function of v·t in figure for different values of Rnm/R2ls(θ=0); v being the sample volume. The energy-saving coefficient is equal to zero and the critical radius becomes constant for θ<−0,666. There is a good agreement with expectations [Citation19]; the glass state could be obtained using Rcc=3×10¹⁰ K s−1 corresponding to a nose time equal to 38 ns. The unmelted crystal would have to only contain 59 or 102 nickel atoms; such small number of atoms could be obtained by overheating the melt above 2072 K [Citation4]; the sample volume would have to be of the order of 2.6 mm3 when Rnm/R∗2ls(θ=0)=0.11 and to be much smaller for larger values of Rnm/R∗2ls(θ=0).
Figure 7 The product of the sample volume and nucleation time of a nickel melt is plotted versus θ=(T−Tm)/Tm; ln A=90 has been previously determined [Citation3, Citation4]. The sample volumes are 1.0×10⁻¹², 1.0×10⁻¹¹ and 1.0×10⁻¹⁰ m3 from bottom to top. The calculation parameters are given in table . The kink at θ2=−2/3 corresponds to εls=0 [Citation4]. The first crystallization temperature Tx would occur below T2=Tm /3 at Tx=Tg.
Calculated TTT diagram of Fe83B17 and the direct observations of ‘medium range order’ regions in as-quenched amorphous ribbons
The density of nuclei in the glass state is typically of the order 1023 to 1024 m− 3 far above the density of homogeneous nuclei calculated using the classic nucleation model [Citation33]. The magnetic field texturing obtained after application of a very low cooling rate still produces about 1021–1022 crystals per m3 as deduced from crystal radii equal to about 50 nm [Citation4, Citation5]. Evaluations of their initial size in metallic glasses have been made after quenching Fe86B14, Fe83B17 and Fe86B20 ribbons and by studying their microstructure by high-resolution transmission electron microscopy (HRTEM) and other techniques. Local cluster structures of bcc-Fe and Fe boride having diameters of 1.5–2 and 1 nm diameter are directly observed and are a strong indication of a “nanoscale phase separation” in the amorphous phase [Citation33]. These regions are observed at room temperature with a very diffuse interface. They could have a sharper interface in the undercooled melt above the glass transition. It is suggested that these clusters could be the unmelted crystals surviving above the melting temperature.
Fe83B17 is a eutectic having a melting temperature of 1447 K leading to a conventional glass obtained by melt spinning. Ribbons could have a thickness of 30 μm. The disappearance of the glass state depends on the heating rate Rh and is accompanied by crystallization. Tg=Tx=625 K when Rch=0.016 K s−1 and Tg=Tx=675 K when Rh= 0.33 K s−1 [Citation34]. The TTT diagram can be calculated with ln A=90 when the fragility D∗ and TVFT are known; TVFT and D∗ are, respectively, chosen to be equal to Tm/3=482 K and D∗=7.4 because the dynamic viscosity has been measured at T=Tm equal to 0.0014 Pa s and η0=NAh/Vm=6.1× 10−5 Pa s where h is the Planck constant [Citation27–29, Citation35]. The molar volume is 6.55 cm3, the density 7.360 g cm−3 and the fusion entropy is assumed to be equal to 9.16 JK−1. The TTT diagram shown in figure is calculated using R∗nm=0.9 nm in agreement with the experimental observations of bcc-Fe spheres having a 2 nm maximum diameter and εls0=εnm0= 0.3. Such unmelted crystal contains 281 atoms. The derivative dT/dt is equal to 1 K s−1 at T=654 K and equal to 0.014 K s−1 at 646 K. These results are very close to the experimental ones despite the fact that the overheating temperature and Rnm are probably different for various samples used by different authors in HRTEM studies, in resistivity and DSC measurements. The nose temperature is Tn=1320 K and the nose time tn=680 ns for the TTT diagram represented in figure . The nose time has to be compared with the ribbon square thickness divided by the thermal conductivity and multiplied by the specific heat per unit volume; this quantity, of the order of 40 μs, corresponds to the time necessary to decrease the ribbon temperature down to 1025 K. In fact, the cooling time has to be only counted in a narrow window of less than 20 K above Tn because the strong divergence of t above 1290 K has no effect on the efficient time. Under these conditions, the model predicts that the glass state is just at the limit for obtaining it by melt spinning.
Figure 8 The calculated TTT diagram of the conventional glass Fe83B17 (□) is plotted as a function of time using parameters given in table and assuming ln A=90, εnm0=εls0=0.3. The time t (s) is the sum of the time lag τns and the steady-state nucleation time tsn. The nose temperature is equal to 1320 K; tsn(▵) is the minimum at T2nm=1050 K. The derivative dT/dt is equal to 0.014 K s−1 at Tx≅ 646 K and 1 K s−1 at Tx=654 K. In a conventional glass, the first crystallization temperature occurs below T2nm at Tg=Tx for about the same heating rates dT/dt.

Fermi energy equalization of a spherical crystal and its melt induced by electron transfer
Formulation of the electrostatic potential induced by a charged crystal
The electrostatic energy saving εv is associated with the Fermi-energy equalization of crystal nuclei and their melt. There are nΔz electrons transferred from the solid to the melt when the crystal contains n atoms. The Fermi-energy difference ΔEF between the solid and its melt is given by (Equation1414 ) in a free-electron model and depends on the free-electron number ν per atom; Δ z is the excess of free electrons per atom above the Fermi level of the melt; it depends on the variation Δν of the conduction-electron number ν per atom and on the free-volume variation ΔVm;
14
Equation (Equation14
14 ) is applied to the following liquid elements: Ti, Fe, Co, Ni, Zn, Pd, Cd, Pt, Au, Al, In, Sn and Pb assuming Δν=0; ΔVm/Vm is extrapolated up to the melting temperature from the thermal variation of the expansion coefficient and given in table [Citation4, Citation36, Citation37].
15
ΔEF can be calculated if ν is known: the ultrasound velocity a0 in liquid elements at T=Tm is related to νEF as shown by (Equation16
16 ), M being the atomic mass [Citation4, Citation38]. The numerical coefficient 2/3 in (Equation16
16 ) has to be seen as a first approximation [Citation39]. This value is corrected and considered as equal to 0.55 using the mean value of the ultrasound velocity a0 in the following liquid metals at their melting point: Li (ν=1), Na (ν=1), K (ν=1), Cs (ν=1), Mg (ν=2), Ca (ν=2), Sr (ν=2) and Ba (ν=2) [Citation4]. The ν values are calculated using (Equation16
16 ) with the numerical coefficient equal to 0.55 instead of 2/3 and are given in table together with ΔEF deduced from (Equation15
15 ) and Δz=ΔzF of the 13 elements deduced from (Equation14
14 ),
16
The electrostatic potential energy −U0 induced by a crystal of large radius R=R2ls∗ containing n atoms at the melting temperature would have to be nearly equal to Eq, the quantified energy given by (Equation17
17 ), because it carries a large charge n·Δzp⋅e; an analogy is made with clusters carrying electric charges in an inert medium [Citation40–42] with electron correlations being neglected,
17
In a metal, the charge is screened around the crystal surface by the free electrons of the melt; equation (Equation17
17 ) contains the vacuum permittivity ε0=8.85×10⁻¹² C V−1 m−1 and the electron charge e=1.602×10⁻¹⁹ C; it is applied to the 13 liquid elements for T=Tm using R=R2ls∗(θ = 0) given in table and εls0=0.217 in order to determine Δzp. The quantities ΔzF determined from (Equation14
14 –Equation16
16 ) and Δzp deduced from equation (Equation17
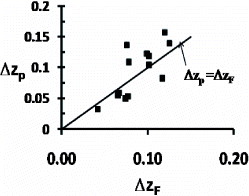
17 ) are compared in figure and are nearly equal despite a large dispersion of points mainly due to errors on ΔVm/Vm; there is no noticeable change when the transition elements are subtracted in figure . Equation (Equation17
17 ) is then well-founded to relate, in a first approximation, the electronic energy saving εls0 to the number n× Δz of transferred electrons; under these conditions, the potential energy is expected to vary as the radius reverse 1/Rnm because ΔEF and Δz would not have to be dependent on Rnm. The unmelted crystals in some cases could only contain 9 atoms; εnm0 is strongly reduced as shown by the analysis of the TTT diagrams and as compared with the potential energy U0. This could be due to quantum effects reducing Eq far below the potential energy [Citation40].
Table 2 The following quantities characterizing 13 elements are given at T=Tm from left to right: (Equation11 ) R∗2ls is the critical radius for crystal growth; (Equation2
2 ) NA/Vm is the atomic number per m3; (Equation3
3 ) Ma0
2 is the atomic mass multiplied by the ultrasound velocity in the liquid state; (Equation4
4 ) ν is the number of conduction electrons per atom deduced from (14–16); (5) ΔVm/Vm is the relative free volume; (Equation6
6 ) ΔHm is the fusion heat per mole; (7) ΔzF is the free-electron number difference per atom calculated with (Equation14
14 –Equation16
16 ); (Equation8
8 ) Δzp is the free-electron number per atom transferred from the solid to the liquid and calculated using the electrostatic potential energy (Equation17
17 ).
Figure 9 The transferred free-electron number Δz per atom determined using two independent methods: (1) ΔzF is determined from the ultrasound velocity in 13 liquid elements and from the free-volume change ΔVm/Vm at T=Tm; (2) Δzp is calculated with equation (Equation1717 ) taking ε nm0 = 0.217, and R2ls∗(θ = 0) and ΔHm as given in table . The line ΔzF ≅ Δzp is respected despite the experimental spread mainly due to the uncertainty on ΔVm/Vm.
An analogy with the charged-crystal properties imbedded in an inert medium is proposed in the absence of a model for a metal [Citation40–42]. The charge n·Δz·e cannot be fully screened inside the crystal because there is a deficit of conduction electrons. A tentative is made in 5–2 to calculate a potential energy −U0 by assuming that the first energy level ε q in such well is equal to εv×4πR3/3 despite the fact that the weakly-bound free electrons of the melt screen the crystal charge instead of only having one electron bound state in the well. It is assumed that this calculated potential energy −U0 is a good approximation for the potential acting on the melt conduction electrons.
Quantum weakening of the electrostatic energy saving
The potential energy previously defined using (Equation1717 ) is a good approximation for numerous transferred electrons (n× Δz≫1). There is an opportunity to verify if the first-energy levels of an s-state electron moving in vacuum, in a negative spherical potential well −U0, can describe the quantified values proportional to ε ls and approximate the true potential energy in the melt even at low radii. The Schrödinger equation has been written with wave functions only depending on the distance r from the potential centre for s states [Citation40],
The quantified solutions Eq=nεqΔHm/NA are given by the k value and by (Equation18
18 ) as a function of the potential U0 associated with the crystal radius R=Rnm,
n increasing with the cube of Rnm,
18
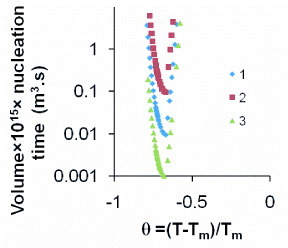
εq is considered as equal to εls(θ) as a function of R∗2ls(θ). The corresponding quantity for the potential energy εls(θ)×U0(θ)/E0(θ) per atom is plotted in figure for Zr41.2Ti13.8Cu12.5Ni10Be22.5 as a function of R∗2ls(θ) and compared with εls. The energy saving of a crystal having the critical radius in a metallic melt is slightly reduced by quantum effects as compared with εls×U0[R∗2ls(θ)]/Eq[R∗2ls(θ)], as shown in figure . This weakening is stronger for smaller radii.
Figure 10 The potential energies are divided by the fusion heat per mole. The first energy level (▪) per mole εls=εq deduced from (Equation22 ); the level induced by the attractive potential associated to a charged crystal (♦) imbedded in vacuum and calculated using (Equation17
17 ) and (Equation18
18 ). Those energies are plotted as a function of the critical radius R∗2ls (θ).

Other results of this analysis are given in table . The electrostatic potential energy in Zr41.2Ti13.8Cu12.5Ni10Be22.5 is only 4.7% larger than the quantified energy for R∗2ls(0)=0.773 nm at T=Tm. The quantified energy εq=εnm0=0.91 (E0=7.91×10⁻¹⁹ J) for Rnm=0.32 nm leads to U0=1.76×10⁻¹⁹ J and Δz=0.110. The weakening of εnm0 occurs while Δz remains constant. The same reduction is observed for Mg65Y10Cu25 at very low radius while the potential energy corresponding to the critical radius at T=Tm is only increased by 4.7% as compared with εls0; Δz also remains nearly unchanged. In Pd43Cu27Ni10P20, Δz is still nearly unchanged for εnm0=0.5 while the potential energy corresponding to the critical radius at T=Tm is only increased by 8% as compared with εls0. The absence of Δz change in all alloys would correspond to a Fermi energy difference independent of the sphere radius. The energy-saving coefficient εls0 in (Equation1717 ) would be divided by 2 for two s electrons occupying the first energy level; the new value of U0 deduced from (Equation18
18 ) and Δz deduced from (Equation17
17 ) would also be divided by a factor of the order of 2. This assumption as well as any change in εnm0 would contradict with the observations described in figure .
Table 3 The potential energy - U0 and the charge excess Δz per atom carried by a crystal imbedded in a melt are calculated assuming that the first energy level of an electron moving in vacuum and in a spherical potential −U0 is equal to the energy saving Eq defined using εls0 and εnm0. U0 is nearly equal to Eq when the crystal radius is equal to its critical value; Eq is strongly reduced by quantum effects when R≪R∗2ls in very good agreement with the calculated values extracted from the TTT diagrams of several alloys.
Table 4 The abbreviations of different physical quantities used in this paper are classified: (Equation11 ) Thermodynamics parameters, (Equation2
2 ) Physical constants, (Equation3
3 ) Glass-forming melt and crystal nucleation parameters, (Equation4
4 ) Crystallized nuclei, (Equation5
5 ) Temperatures (Equation6
6 ) Other abbreviations.
The bound state involved in a classic virtual bound state falls in the Fermi Sea [Citation43, Citation44]. The one-electron bound state energy can be nearly as deep as the potential well far below the free electron band bottom for large radii; these observations could extend the domain of Friedel's virtual bound states to highly charged crystals in metallic melts. There is a need of a theoretical model to determine the true potential energy induced by a crystal in a melt and if the melt electrons screening the charge could lead to an electrostatic energy equal to the observed values of εls0 as expected from this analysis.
The model developed here is nevertheless successful to determine the electrostatic potential energy induced by an intrinsic spherical nucleus in metallic glass-forming melts from the free-volume disappearance temperature. The first energy level of a bound state for one electron moving in a potential well, imbedded in vacuum, could remain unchanged despite the many-body effects screening the giant charge n·Δz·e in the melt. This phenomenon induced by the Fermi-energy equalization between a crystal and its melt could correspond to the formation of a virtual bound state involving at the same time a very large number of weakly bound conduction electrons and inducing a shift of the crystal band bottom as compared with the melt one.
Conclusion
The energy saving εv=εlsΔHm/Vm associated with the equalization of Fermi energies of a crystal and its melt cannot be neglected in the Gibbs free energy change related to a crystal formation in bulk metallic glass-forming melts because it can be larger than its fusion heat. The thermal dependence εls=εls0(1−θ/θ20l), where θ=T−Tm/Tm is found using a thermodynamics constraint that imposes that the derivative of the free-energy change related to a crystal formation at the melting temperature has to be equal to the fusion entropy; this condition is satisfied because (dεls/dT)=0 at T=Tm. This law has already been observed for undercooled liquid elements.
In bulk metallic glass-forming melts, the homogeneous nucleation critical temperature T2 occurs for θ2= (εls−2)/3 and the minimum values of εls0 are only determined with the knowledge of the free-volume disappearance temperature T0l or θ0l; θ2 is larger than −2/3 when εlsois larger than 1; in this case, the extrapolated temperature T0l, considered as equal to the Vogel–Fulcher–Tammann temperature (VFT); TVFT is larger than Tm/3. In conventional glasses, εls0 is smaller than 1 and T0l=T2= Tm/3. The glass-forming ability appears as being strongly dependent on εls0 .
The critical radius for crystal growth in glass melts is much smaller than in pure liquid elements. The steady-state heterogeneous nucleation rate is strongly dependent on the unmelted intrinsic crystal contribution to the reduction of the critical energy barrier. The time lag in transient nucleation being proportional to the viscosity protects the undercooled melt against crystallization above the glass transition and below the nose temperature of the TTT diagram. The TTT diagrams of Mg65Y10Cu25, Zr41.2Ti13.8Cu12.5Ni10Be22.5 and Pd43Cu27Ni10P20 are calculated in agreement with the experimental ones using known thermodynamic properties and varying the intrinsic nucleus contribution ΔGnm/kBT to the reduction of growth critical barrier. The nose temperature Tn depends very weakly on ΔGnm/kBT because the TTT curves below Tn are very reproducible [Citation17], the time lag τ ns becoming larger than the steady-state nucleation time tsn. The experimental TTT diagrams are also used to determine, through ΔGnm/kBT, the value of εnm0 of intrinsic nuclei and their radii; for radii much smaller than the critical radius, εnmo is strongly reduced.
This phenomenon is due to quantum effects associated with electrostatic potentials induced by unmelted spherical crystals in the melt Fermi Sea; the reduced values of εnm0 correspond in vacuum to the first energy level of one s-electron moving in the same spherical attractive potential despite the fact that, in a metal, the charge screening is built by many-body effects. Such one-electron bound states become virtual in a metal and are characterized by melt conduction electrons surrounding and screening the crystal giant charges.
The first-crystallization temperature of melts is determined on the basis of the existence of intrinsic heterogeneous nuclei that are not melted. The presence of such nuclei is known for many years despite applying relatively large overheating [Citation45–48]; the model can be used to predict a nucleus melting temperature as a function of ε ls0 by overheating the glass-forming melts. Nevertheless, this application is limited to homogeneous compositions and cannot be used for all compositions of crystals surviving in a glass melt.
Medium-range regions have been observed for a long time in an as-quenched conventional glass by studying the microstructure of Fe83B17 amorphous ribbons by several techniques and in particular by high-resolution transmission electron microscopy. The TTT diagram has been calculated to predict a first-crystallization temperature equal to Tg; an unmelted crystal radius Rnm equal to 0.9 nm is obtained in agreement with direct observations of the ‘medium range order’ (MRO) region size at room temperature [Citation33]. These regions could be seen as intrinsic unmelted crystals.
Acknowledgments
Thanks are due to Eric Beaugnon, Philippe Odier, Jean-Louis Soubeyroux, to the referees for manuscript review, and to Jacques Friedel for discussions. Commenting on this paper, Yoshihiko Hirotsu considers that intrinsic nuclei could be identified to ‘medium range order’ (MRO) clusters only if the interface cluster-matrix is very diffuse at room temperature. The MRO cluster size depends on the overheating rate and then, these entities exist above the melting temperature even if the cooling rate tends to slightly modify their radii [Citation49]. The Fe85–B15 kinematic viscosity is irreversible between θ = 0 and θ≅0.23 after an overheating up to θ=0.27 in good agreement with our prediction θ≅εls0=0.3 [Citation50] corresponding to the melting temperature of all surviving crystals.
References
- TurnbullD 1952 J. Chem. Phys. 20 411 http://dx.doi.org/10.1063/1.1700435
- KeltonK F 1991 Solid State Phys. 45 75
- VinetBMagnussonLFredrikssonHDesréP J 2002 J. Colloid Interface Sci. 255 363 http://dx.doi.org/10.1006/jcis.2002.8627
- TournierR F 2007 Physica B 392 79 http://dx.doi.org/10.1016/j.physb.2006.11.002
- TournierR F 2007 Progress in Light Metals, Aerospace Materials and Superconductors Part 4 YLu PZhang CJiang YHan Switzerland Trans Tech Publ. p 1827
- TournierR F 2006 Vth Int. Symp. Electromagn. Process. Mater. STaniguchi Japan Iron Steel Inst. p 561
- GreerA L 1995 Science 267 1947 http://dx.doi.org/10.1126/science.267.5206.1947
- MottN F 1967 Adv. Phys. 16 49 http://dx.doi.org/10.1080/00018736700101265
- HaruyamaOKimuraH MNishiyamaNInoueAAraiJ 2002 Mater. Trans. 43 1931 http://dx.doi.org/10.2320/matertrans.43.1931
- InoueA 2000 Acta Mater. 48 279 http://dx.doi.org/10.1016/S1359-6454(99)00300-6
- GutzowISchmelzerJ 1995 The Vitreous State Berlin Springer chapters 2.4, 6.2, 6.3
- ZarzyckiJ 1982 Les Verres et l'Etat Vitreux JPHamen Paris Masson
- LuI-RWildeGGörlerG PWillneckerR 1999 J. Non-Cryst. Solids 250–252 577 http://dx.doi.org/10.1016/S0022-3093(99)00135-0
- NishiyamaNInoueA 2002 Appl. Phys. Lett. 80 568 http://dx.doi.org/10.1063/1.1445475
- NishiyamaNInoueA 2002 Mater. Trans. 43 1913 http://dx.doi.org/10.2320/matertrans.43.1913
- SchroersJJohnsonW LBuschR 2000 Appl. Phys. Lett. 77 1158 http://dx.doi.org/10.1063/1.1289033
- SchroersJWuYBuschRJohnsonW L 2001 Acta Mater. 49 2773 http://dx.doi.org/10.1016/S1359-6454(01)00159-8
- MukherjeeSZhouZSchroersJJohnsonW L RhimW K 2004 Appl. Phys. Lett. 84 5010 http://dx.doi.org/10.1063/1.1763219
- LuZ PLiuC T 2002 Acta Mater. 50 3501 http://dx.doi.org/10.1016/S1359-6454(02)00166-0
- ShenT DSchwarzR B 2006 Appl. Phys. Lett. 88 091903 http://dx.doi.org/10.1063/1.2172160
- TurnbullDFisherJ C 1949 J. Chem. Phys. 17 71 http://dx.doi.org/10.1063/1.1747055
- AngellC A 1993 Science 267 1924 http://dx.doi.org/10.1126/science.267.5206.1924
- YavariA RLe MoulecANishiyamaNInoueAVaughanGKvickABottaW J 2004 J. Metastable Nanocryst. Mater. 20–21 23
- DoolittleH 1952 J. Appl. Phys. 23 236 http://dx.doi.org/10.1063/1.1702182
- LuI-RGörlerG PWillneckerR 2002 Appl. Phys. Lett. 80 4534 http://dx.doi.org/10.1063/1.1487922
- WaniukT ABuschRMasuhrAJohnsonW L 1998 Acta Mater. 46 5229 http://dx.doi.org/10.1016/S1359-6454(98)00242-0
- BuschRLiuWJohnsonW L 1998 J. Appl. Phys. 83 4134 http://dx.doi.org/10.1063/1.367167
- NishiyamaNInoueA 1999 Mater. Trans. JIM 40 64
- NishiyamaNInoueA 1996 Mater. Trans. JIM 37 1531
- NishiyamaNInoueA 2002 Appl. Phys. Lett. 80 568 http://dx.doi.org/10.1063/1.1445475
- NishiyamaNInoueA 2002 Mater. Trans. JIM 43 1913 http://dx.doi.org/10.2320/matertrans.43.1913
- InoueANishiyamaNKimuraH 1997 Mater. Trans. JIM 38 179
- HirataAHirotsuYOhkuboTHanadaTBengusV Z 2006 Phys. Rev. B 74 214206 http://dx.doi.org/10.1103/PhysRevB.74.214206
- YaoY DLinS 1980 Chin. J. Phys. 18 43
- TomutMChiriacH 1999–2000 Analele Scientifice Ale Universitatii ‘Al Cuza’ IASI Tomul XLV-XLVI, S Fitiza Stârii Condensate p 26
- TouloukianY SKirbyR KTaylorR EDesaiP D 1970 Thermophysical Properties of Matter vol 12 Thermal Expansion: Metallic Elements and Alloys New York IFI/Plenum
- LideD R 1991–1992 Handbook of Chemistry and Physics 72nd edn Boca Raton, FL CRC Press p 4
- TekuchevV VStremousovV IPivovarovBarashkovV M 1998 Russ. Metall. (Metally) 2 29
- MarchN H 1968 Physics of Simple Liquids H N VTemperley J SRowlinson G SRushbrooke Amsterdam North Holland p 645
- LandauLLifchitzE 1966 Quantum Mechanics Moscow MIR p 135
- StampfliPBennemannK 1988 Phys. Rev. A 38 4431 http://dx.doi.org/10.1103/PhysRevA.38.4431
- LakhnoV D 1996 Z. Phys. D 38 71 http://dx.doi.org/10.1007/s004600050066
- FriedelJ 1958 Nuovo Cimento (Suppl) 7 11
- BlandinAFriedelJ 1959 J. Phys. Rad. 20 160 http://dx.doi.org/10.1051/jphysrad:01959002002-3016000
- FanCInoueA 1999 Appl. Phys. Lett. 75 3644 http://dx.doi.org/10.1063/1.125415
- ManovVPopelPBrook-LevinsonEMolokanovVCalvo-DahlborgMDahlborgUSidorovVSonLTarakanovY 2001 Mater. Sci. Eng. A 304–306 54 http://dx.doi.org/10.1016/S0921-5093(00)01433-7
- RudolphPKohH JShäferNFukudaT 1996 J. Cryst. Growth 166 578 http://dx.doi.org/10.1016/0022-0248(96)00119-4
- HaysC CJohnsonW L 1999 J. Non-Cryst. Solids 250–252 596 http://dx.doi.org/10.1016/S0022-3093(99)00139-8
- HirotsuYUeharaM 1988 J. Japan. Inst. Metals 52 129
- SidorovVPopelPCalvo-DahlborgMDahlborgUManovV 2001 Mater. Sci. Eng. A 304–306 480 http://dx.doi.org/10.1016/S0921-5093(00)01499-4