Abstract
Polycrystalline samples of Ca3−xNaxCo2−xMnxO6 (x=0.0–0.5) have been prepared by the sol-gel cum combustion method using sucrose in order to investigate the effects of the coupled substitution of Na and Mn on Ca and Co sites on the transport properties of Ca3Co2O6(Co326). The products were characterized by Fourier transform infrared spectroscopy, powder x-ray diffraction (XRD), thermogravimetry (TGA), differential thermal analysis and scanning electron microscopy. XRD patterns reveal the formation of single-phase products up to x=0.5. Coupled substitution increases the solubility of both Na and Mn on Ca and Co sites, respectively, in contrast to the limited solubility of Na and Mn (x=0.2) when separately substituted. TGA confirms the formation of the Ca3Co2O6 phase at temperatures ∼720 °C. The grain size of the parent and substituted products is in the range 150–250 nm. Electrical resistivity and Seebeck coefficient were measured in the temperature range 300–800 K. Resistivity shows semiconducting behavior for all the compositions, particularly in the low-temperature regime. The Seebeck coefficient increases with temperature throughout the measured temperature range for all compositions. The maximum Seebeck coefficient (200 μV K−1) is observed for x=0.5 at 825 K, and this composition may be optimal for high-temperature thermoelectric applications.
Introduction
Thermoelectric devices recently attracted renewed interest in terms of their potential applications in clean energy conversion systems. At present, materials such as (Bi,Sb)2(Te,Se)3 [Citation1–3], filled skutterurides [Citation4–6] and Si–Ge alloys [Citation7, Citation8] have the highest thermoelectric performance with the dimensionless figure of merit ZT=S2T/ρκ>1. Here S, ρ, κ and T are thermoelectric power, electrical resistivity, thermal conductivity and temperature, respectively. However, other than Si–Ge, their applications to power generation are very limited at high temperatures because of the material decomposition. The thermoelectric performance of oxides is considered as low because of their high electrical resistivity resulting from poor carrier mobility. However, the recent discovery of high thermopower coexisting with low electrical resistivity in NaCo2O4 and Ca3Co4O9 has opened the way to the exploration of oxide thermoelectric materials [Citation9–12]. Because oxides have the merits of long-time stability in air at high temperature, they may be regarded as promising thermoelectric materials [Citation13, Citation14]. Ca3Co2O6 (Co326) is a decomposed phase of Ca3Co4O9 (Co349) and is stable up to 1300 K [Citation15]. It has potential as a better thermoelectric material than Co349 at high temperatures owing to its better stability. However, the ZT value of Co326 is only 0.15 at 1073 K [Citation16].
The present study reports the synthesis of pure and substituted Co326 by the sucrose-assisted sol-gel cum combustion method with the objective of obtaining nanocrystalline products. Sucrose has previously been employed as a gelling agent in the sol-gel synthesis of nanocrystalline oxides [Citation17–19]. The effect of the coupled substitution of Na and Mn on the sites of Ca and Co, respectively, in the Co326 phase has been studied to modify the thermoelectric properties of the Co326 phase and also to increase the solubilities of Na and Mn. The coupled substitution of Na and Mn in the Co326 phase has not been reported yet.
Experimental work
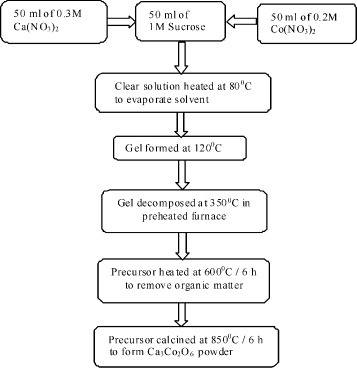
Polycrystalline samples of Ca3−xNaxCo2−xMnxO6 (x=0.0–0.5) were synthesized by the sol-gel cum combustion method using sucrose as a gelling agent. The starting materials were analytical-grade sucrose and nitrates of Ca, Na, Co and Mn. Aqueous solutions of the reactants were prepared according to the molar ratio Ca:Co:sucrose of 0.3:0.2:1 corresponding to the stoichiometry of the Ca3Co2O6. The required volumes of the above solutions were then mixed and the resulting solution was heated to a temperature in the range 80–120 °C with constant stirring to obtain the gel. Subsequently, it was decomposed at 350 °C for 0.5 h in a preheated furnace, resulting in a large voluminous fluffy mass of precursor. This precursor was then heated at 600 °C for 6 h to remove carbonaceous material and then calcined in the temperature range 850–900 °C in air for 6–24 h to obtain the Co326 product. The procedure is outlined in figure .
Figure 1 Flowchart of the synthesis of Ca3Co2O6.
X-ray diffraction (XRD) was recorded with a PANalytical (CuKα) X'pert PRO model diffractometer. Lattice parameters were refined by the least squares method. Fourier transform infrared (FTIR) spectra were recorded with a Thermonicolet, Avatar 330 spectrometer in the range 400–4000 cm−1 using KBr pellets. Thermogravimetry (TG) and differential thermal analysis (DTA) were carried out with a Perkin Elmer instrument in the temperature range 40–1000 °C in air at a heating rate of 10 °C min−1. The morphology of the products was examined using a scanning electron microscope (SEM, Hitachi S-300H). Electrical resistivity ρ of the polycrystalline products was measured by the four-probe dc technique in the temperature range 300–800 K in argon atmosphere. The Seebeck coefficient S was calculated from the plot of thermoelectric voltage against differential temperature in the temperature range 300–800 K in argon atmosphere using Pt–Pt/Rh (R type) thermocouples attached to both sides of the pellets. Pellets of 8 mm diameter and 2 mm thickness for resistivity measurements and 8 mm diameter and 5 mm thickness for thermoelectric measurements were prepared by compacting the calcined powders in WC-lined dies under a pressure of 200 kg cm−2 provided by a hydraulic press. The pellets were then sintered at temperature in the range 850–900 °C for 24–36 h. The sodium and oxygen contents were estimated by flame photometry and redox titrations, respectively.
Results and discussion
Sample characterization
Powder XRD.
XRD patterns of all the compositions Ca3−xNaxCo2−xMnxO6 (figure ) up to x=0.5 indicate single-phase crystals of the hexagonal structure with lattice parameters a≅0.91 nm and c≅1.04 nm. For x>0.5, all samples contain the secondary phase of Na0.71Co0.98O2 [Citation20]. Refined cell parameters are listed in table . The cell volume increases with x. Sodium content estimated by flame photometry is consistent with the starting composition. Oxygen stoichiometry estimated by redox titration is 6±0.02. When Na on the Ca site and Mn on the Co site in the Co326 phase are separately substituted [Citation21], they are soluble only up to x=0.2, whereas with coupled substitution, the solubilities of Na and Mn are increased up to x=0.5.
Figure 2 XRD patterns of Ca3−xNaxCo2−xMnxO6 (x=0.0–0.5).
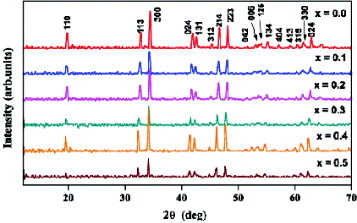
Table 1 Refined lattice parameters of Ca3−xNaxCo2−xMnxO6 (x=0.0–0.5).
FTIR.
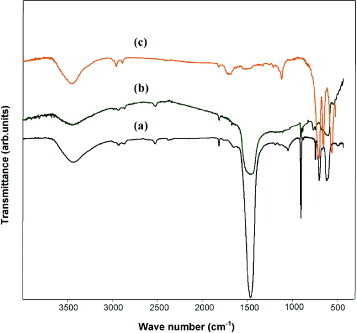
FTIR spectra of the precursor of Co326 heated at different temperatures are shown in figure . The intense bands at 1441 and 875 cm−1 (figures (a) and (b)), observed in the precursor calcined at 600 and 800 °C, correspond to carbonates [Citation22]. The intensity of carbonate peaks decreases with increasing calcination temperature. In the precursor heated at T>850 °C, the carbonate peak completely vanishes (figure (c)) and new bands appear at 670 and 588 cm−1 (figure (c)). Those bands are assigned to Ca–O and Co–O stretching vibrations [Citation23]; they indicate that the product is formed completely by calcination of the precursor in the temperature range 850–900 °C.
Figure 3 FTIR spectra of precursor of Ca3Co2O6 calcined at (a) 600 °C, (b) 800 °C and (c) 850 °C.
TG and DTA.
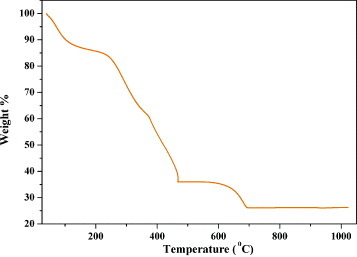
Figure shows the TG/DTA results of the precursor calcined at 350 °C. The initial weight loss of about 12% in the TG curve is due to the evaporation of adsorbed water. The intermediate weight loss of about 50% in the temperature range 290–470 °C corresponds to the decomposition of organic compounds that likely leads to the formation of CaCO3 and Co3O4 [Citation23]. Calcium carbonate decomposition takes place in the temperature range 600–700 °C with the final weight loss of ∼12% indicating that Co326 begins to form at ∼720 °C.
Figure 4 TGA of precursor of Ca3Co2O6.
SEM.
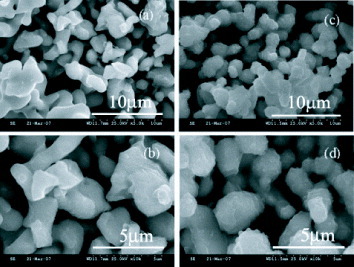
SEM images (figure ) of x=0.0 and 0.2 samples under different magnifications show that the grains of the parent Co326 are well formed into a polyhedral shape, whereas those of substituted Co326 are nearly spherical. The grain sizes in both samples vary between 150 and 250 nm. The crystallite size obtained from XRD patterns using the Scherrer formula is in the range 40–100 nm.
Figure 5 (a) and (b) SEM micrographs of Ca3Co2O6 and (c) and (d) of Ca2.8Na0.2Co1.8Mn0.2O6 under different magnifications.
Transport measurements
Electrical resistivity.
Figure presents electrical resistivity ρ of polycrystalline pure Co326 and substituted Co326 phases as a function of temperature in the range 300–800 K. For all the compositions, a semiconductor-like temperature (dρ/dT<0) is observed; the substituted phases showing weaker temperature dependences than the parent (x=0) phase. Electrical resistivity decreases with x up to x=0.2, but for x0.3, electrical resistivity increases with x. This indicates that up to x=0.2, the holes created by the substitution of Na at the Ca site play a dominant role in reducing the resistivity caused by the increase of carrier concentration. However, for x0.3, scattering by Mn and the reduction in carrier concentration may play a more dominant role in increasing the resistivity, as reported for the Co349 phase [Citation24]. This also indicates that these substituted phases are free of the NaxCoO2 phase, which is expected to be more conducting [Citation21]. Note however that grain boundary effects, band structure changes upon substitution, oxygen non-stoichiometry and anisotropy of the crystal structure of Co326 also contribute to its transport properties.
Figure 6 Temperature dependence of resistivity for Ca3−xNaxCo2−xMnxO6 (x=0.0–0.5).

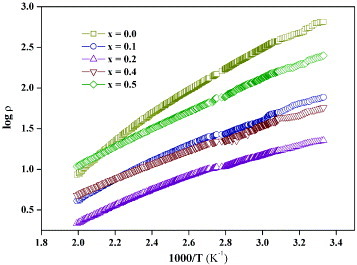
Figure presents an Arrhenius plot of log ρ versus 1/T in the temperature range 300–500 K for different x. The parent (x=0) and substituted phases exhibit an activation energy ∼0.3 eV. The temperature dependence of resistivity is not reversible during heating and cooling cycles. This might cause the deviation from the 1000/T activation at high temperatures.
Figure 7 Plot of log ρ versus 1000/T for Ca3−xNaxCo2−xMnxO6 (x=0.0–0.2 and 0.4–0.5) in the temperature range 300–500 K.
Seebeck coefficient.
Figure shows the plot of the Seebeck coefficient S as a function of temperature. In all the compositions, S increases with temperature in the range 300–800 K; S is positive indicating p-type transport. The parent phase of Co326 in this study shows an increase of the Seebeck coefficient from 40 to 70 μV K−1 in the temperature range 300–800 K, in contrast to the previous studies: Takahashi et al [Citation25] observed that in single-crystal Ca3Co2O6, the Seebeck coefficient increases from 165 μV K−1 at 300 K to a maximum of 300 μV K−1 at 440 K and then decreases gradually to 100 μV K−1 at 1000 K. Iwasaki et al [Citation26] observed that in polycrystalline Ca3Co2O6, the Seebeck coefficient decreases from 600 to 140 μV K−1 in the temperature range 300–1200 K. These variations may be attributed to the oxygen non-stoichiometry effects, which have not yet been investigated in the Co326 phase. Note that in LaCoO3, the magnitude of the Seebeck coefficient and its temperature dependence are affected by oxygen defects [Citation27].
Figure 8 Temperature dependence of Seebeck coefficient S for Ca3−xNaxCo2−xMnxO6 (x=0.0–0.5).
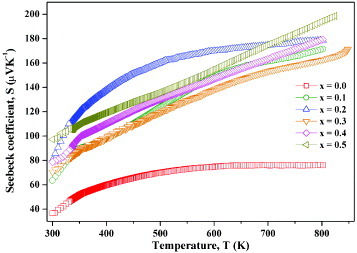
The substituted phases of Ca3−xNaxCo2−xMnxO6 (x=0.0–0.5) show, in general, an increase of S with temperature in the range 300–800 K (figure ). In these substituted Co326 phases, S increases significantly from 70 to 200 μV K−1 in the measured temperature range; the x=0.5 samples show the maximum S value of 200 μV K−1 However, when Na and Mn are substituted separately, S decreases with temperature [Citation21]. An increase of the Seebeck coefficient from 50 to 200 μV K−1 in the temperature range 300–800 K is observed when Ca is partially substituted by La, Bi, Y and Cr in Co sites in the Co326 phase [Citation26], similar to the substituted phases of Ca3−xNaxCo2−xMnxO6. The maximum S value (200 μV K−1) observed at 825 K for the composition with x=0.5 in Ca3−xNaxCo2−xMnxO6 is marginally higher than that of the mono substituted (Na on Ca and Mn on Co sites separately) Co326 phase at 825 K [Citation21]. Hence, this composition (x=0.5) may be optimal for high-temperature thermoelectric applications.
Power factor
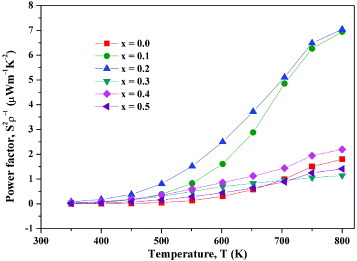
The temperature variation of the thermoelectric power factor (calculated from the measured ρ and S values) is shown in figure . The power factor increases for all compositions with increasing temperature. Its maximum value is 7.03 μW m−1K−2 for x=0.2 at 800 K, and this value is comparable to those of the reported substituted phases of Ca3Co2O6 at 800 K [Citation21, Citation26]. For this composition, the figure of merit ZT is 0.0013. In Ca3−xNaxCo2−xMnxO6, x=0.2 may be the optimal composition.
Figure 9 Temperature dependence of power factor for Ca3−xNaxCo2−xMnxO6(x=0.0–0.5).
Conclusion
Ca3Co2O6 was synthesized by the sucrose-assisted sol-gel cum combustion method. Coupled substitution of Na and Mn on Ca and Co sites improved the transport properties of Ca3−xNaxCo2−xMnxO6 phases. The solubilities of Na and Mn were increased up to x=0.5 by coupled substitution. Electrical resistivity was significantly reduced by the simultaneous substitution of Na and Mn at x= 0.2. The Seebeck coefficient increased with increasing x. The maximum value S=200 μV K−1 was observed for the composition with x=0.5. The power factor reached 7.03 μW m−1K−2 for x=0.2 at 800 K. To understand the variation of the Seebeck coefficient with temperature, it is necessary to measure the carrier density and band gap. A systematic study of the effects of oxygen nonstoichiometry on the transport properties of these Co326 phases is under way.
Acknowledgments
RV wishes to dedicate this paper in honor of Professor C N R Rao FRS on his 75th birthday. We thank the VIT management and DRDO, Government of India, for funding, Professor U V Varadaraju, IIT Madras, for help in transport measurements and VIT-TBI for FTIR measurements.
References
- PerrinDChitroubMScherrerSScherrerH 2000 J. Phys. Chem. Solids 61 1687 http://dx.doi.org/10.1016/S0022-3697(00)00030-5
- YamashitaOTomiyoshiSMakitaK 2003 J. Appl. Phys. 93 368 http://dx.doi.org/10.1063/1.1525400
- CaoY QZhaoX BZhuT JZhangX BTuJ P 2008 Appl. Phys. Lett. 92 143106 http://dx.doi.org/10.1063/1.2900960
- SalesB CMandrusDWilliamsR K 1996 Science 272 1325 http://dx.doi.org/10.1126/science.272.5266.1325
- NolasG SKaeserMLittletonR TTrittT M 2000 Appl. Phys. Lett. 77 1855 http://dx.doi.org/10.1063/1.1311597
- ChenL DKawaharaTTangX FGotoTHiraiT 2001 J. Appl. Phys. 90 1864 http://dx.doi.org/10.1063/1.1388162
- HellerM WNasbyR DJohnson JrR T 1976 J. Appl. Phys. 47 4113 http://dx.doi.org/10.1063/1.323271
- MahanG D 1998 Solid State Physics vol 51 HEhrenreich FSpaepen New York Academic p 81
- TerasakiISasagoYUchinokuraK 1997 Phys. Rev. B 56 R 12685 http://dx.doi.org/10.1103/PhysRevB.56.R12685
- FujitaKMochidaTNakamuraK 2001 Japan J. Appl. Phys. 40 4644 http://dx.doi.org/10.1143/JJAP.40.4644
- LiSFunahashiRMattsubaraIUenoKYamadaH 1999 J. Mater. Chem. 9 1659 http://dx.doi.org/10.1039/a904413b
- FunahashiRMatsubraIIkutaHTakeuchiTMizutaniUSodeokaS 2000 Japan J. Appl. Phys. 39 L1127 http://dx.doi.org/10.1143/JJAP.39.L1127
- FunahashiRMatsubaraISodeokaS 2000 Appl. Phys. Lett. 76 2385 http://dx.doi.org/10.1063/1.126354
- TakahataKIguchiYTanakaDItohT 2000 Phys. Rev. B 61 12551 http://dx.doi.org/10.1103/PhysRevB.61.12551
- FjellvågHGulbrandsenEAaslandSOlsenAHaubackB C 1996 J. Solid State Chem. 124 190 http://dx.doi.org/10.1006/jssc.1996.0224
- MikamiMFunahashiRYoshimuraMMoriYSasakiS 2003 J. Appl. Phys. 94 6579 http://dx.doi.org/10.1063/1.1622115
- WuYBandyopadhyayABoseS 2004 Mater. Sci. Eng. 380 349 http://dx.doi.org/10.1016/j.msea.2004.04.036
- LazarragaM GPascualLGadjovHKovachevaDPetrovKAmarillaJ MRojasR MMartin-LuengoM A RojoJ M 2004 J. Mater. Chem. 14 1640 http://dx.doi.org/10.1039/b314157h
- PrabhakaranKJorlyJGokhaleN MSharmaS C RamjiL 2005 Ceram. Int. 31 327 http://dx.doi.org/10.1016/j.ceramint.2004.03.047
- FousassierCMatejekaGJean-MauriuRHagenmullerP 1973 J. Solid State Chem. 6 5323
- MikamiMFunahashiR 2005 J. Solid State Chem. 178 1670 http://dx.doi.org/10.1016/j.jssc.2005.03.004
- JiuJGeYLiXNieL 2002 Mater. Lett. 54 260 http://dx.doi.org/10.1016/S0167-577X(01)00573-0
- ZhangY FZhangJ XLuQ MZhangQ Y 2006 Mater. Lett. 60 2443 http://dx.doi.org/10.1016/j.matlet.2006.01.013
- LiDQinX YGuY JZhang 2005 Solid State Commun. 134 235 http://dx.doi.org/10.1016/j.ssc.2005.01.044
- TakahashiJYamaneHShimadaM 2004 Japan J. Appl. Phys. 43 L331 http://dx.doi.org/10.1143/JJAP.43.L331
- IwasakiKYamaneHKubotaSTakahashiJShimadaM 2003 J. Alloys Compd. 35 210 http://dx.doi.org/10.1016/S0925-8388(03)00041-0
- IwasakiKItoTNagasakiTAritaYYoshinoM MatsuiT 2008 J. Solid State Chem. 181 3145 http://dx.doi.org/10.1016/j.jssc.2008.08.017