Abstract
The 2 : 1 cation radical salts of bent donor molecules of ethylenedithio-tetrathiafulvalenoquinone-1,3-dithiolemethide (EDT-TTFVO), ethylenedithio-diselenadithiafulvalenoquinone-1,3-dithiolemethide (EDT-DSDTFVO), ethylenedithio-diselenadithiafulvalenothioquinone-1,3-diselenolemethide (EDT-DSDTFVSDS), ethylenedioxy-tetrathiafulvalenoquinone-1,3-dithiolemethide (EDO-TTFVO) and ethylenedioxy-tetrathiafulvalenoquinone-1,3-diselenolemethide (EDO-TTFVODS) with FeX4− (X = Cl, Br) ions are prepared by electrocrystallization. The crystal structures of these salts are composed of alternately stacked donor molecule and magnetic anion layers. The band structures of the donor molecule layers are calculated using the overlap integrals between neighboring donor molecules and are compared with the observed electronic transport properties. The magnetic ordering of the Fe(III) d spins of FeX4− ions is determined from magnetization and heat capacity measurements. The magnetic ordering temperatures are estimated by considering a combination of a direct d–d interaction between the d spins and an indirect π–d interaction between the conduction π electron and the d spins, whose magnitudes are separately calculated from the crystal structures with an extended Hückel molecular orbital method. The occurrence of a π–d interaction is proved by the negative magnetoresistance, and the magnitude of magnetoresistance reflects the strength of the π–d interaction. The effect of pressure on the magnetoresistance is studied, and the result indicates that the magnitude of magnetoresistance increases, namely, the π–d interaction is enhanced with increasing pressure. From these experimental results it is shown that (EDT-TTFVO)2•FeBr4 is a ferromagnetic semiconductor, (EDT-DSDTFVO)2•FeX4 (X = Cl, Br) and (EDT-DSDTFVSDS)2•FeBr4 are metals exhibiting antiferromagnetic ordering of the d spins, and (EDO-TTFVO)2•FeCl4 and (EDO-TTFVODS)2•FeBr4•(DCE)0.5 (DCE =-dichloroethane) are genuine antiferromagnetic metals. Among them, the (EDT-TTFVO)2•FeBr4 salt is the first π–d molecular system where the d spins of FeBr4− ions are ferromagnetically ordered through antiferromagnetic interaction with the conduction π electrons. Corresponding to this ferromagnetic ordering, an anomalous dielectric slow-down phenomenon toward the ordering temperature is observed. The π–d interaction in (EDT-DSDTFVSDS)2•FeBr4 is very large and comparable to that in λ-(BETS)2•FeCl4, which has the highest reported value so far, while the d–d interaction is fairly small. Concerning the ratio between the magnitudes of π–d and d–d interactions (Jπd/Jdd), this salt is currently the best π–d molecular system.
Introduction
Ferromagnetism in transition metals such as Fe, Co, and Ni has been explained by a direct exchange interaction between itinerant d electrons. On the other hand, the ferromagnetism in Gd metal originates from an indirect exchange between f electrons mediated by conduction s/p electrons [Citation1–3]. This interaction is also essential for dilute d electron systems such as CuMn alloys, in which the direct exchange interaction is negligible because the distances between d electrons are too large. The unpaired d electrons, which remain in the inner shell of each metal atom, behave as localized electrons with magnetic moments. However, the s/p electrons are subject to strong interaction with those in neighboring atoms to form an electron conduction band where the electrons can move freely within the solid. When a conduction s/p electron approaches a d electron site, significant electron-electron interaction can occur. It is called s–d interaction, and its Hamiltonian, is given by
1 Here s and S are the spin operators for a conduction s/p electron and a localized d electron, respectively, δ(r) is the δ function, Jsd is the coupling constant for the exchange interaction between a conduction s/p electron and a localized d electron, and r is the distance between the electrons. Since the d site is present at each atom in the solid, the conduction carriers can mediate the interaction between all neighboring localized d electrons to bring about a long-range interaction. The Hamiltonian for d electrons with spins Si, Sj at sites i and j, separated by distance Rij is given by
2 Here EF is the Fermi energy. I(Rij) is the decaying function of Rij. It has spatially oscillatory behavior that depends on the Fermi wavenumber kF as
3 The exchange interaction between localized d electrons through metallic conduction s/p electrons is generally called the Ruderman–Kittel–Kasuya–Yoshida (RKKY) interaction [Citation1–3], which can explain the strong ferromagnetism in the Gd metal.
Regarding the magnetic interaction between the itinerant and localized electrons, it is of interest to replace the s/p-electron-based conduction band in ferromagnetic metals by a π-electron-based conduction band in molecular conductors involving localized d electrons. By designing the molecular and crystal structures, a variety of magnetic interactions between π conduction electrons and localized d electrons can be realized in molecular conductors. Many molecular conductors and magnetic conductors have been prepared so far [Citation4]; they are mainly cation radical salts based on π-conjugated donor molecules with nonmagnetic or magnetic anions. The π electrons in cation radical salts usually form one- or two-dimensional band structures. Hence, the electronic transport properties of most salts are subject to insulating states at low temperatures due to the inherent instability of their low-dimensional electronic structures. In addition, it has been recognized that the overlap of π electron orbitals between neighboring donor molecules usually results in a small transfer integral t= 0.1–1.0 eV in contrast to a large t of several eV in inorganic metals. The value of t is smaller than or comparable to that of the on-site Coulomb interaction U. Consequently, molecular conductors are characterized as highly correlated electron systems in which π electrons play an important role in the electron transport.
Molecular magnetic conductors based on the cation radical salts of π-conjugated donor molecules with magnetic anions, particularly transition-metal anions with d spins, usually have crystal structures composed of alternately stacked donor and magnetic anion layers, as shown in figure . At the interface between each pair of alternate layers, a direct d–d interaction between the neighboring d electrons (spins) of magnetic anions and an indirect π–d interaction between the conduction π electron and the d electron (spin) are formed (figure (a)). The π–d interaction has a strong effect on the electron transport on the π conduction layer [Citation5–9]. Upon increasing the π–d interaction, the scattering time τ of the conduction π electron shortens; accordingly, the electron mobility should be reduced. However, when a magnetic field H larger than the spin-flop field Hsp is applied to the crystal, the d electrons (spins) are forced to align in the same orientation, namely, to induce ferromagnetic ordering, accompanied with the disruption of the π–d interaction (figure (b)). As a result, t and τ increase, enhancing the electron mobility. This is experimentally reflected in the decrease in electrical resistivity ρ upon applying magnetic field, and the so-called negative magnetoresistance is observed (Δρ/ρ<0:Δρ =ρ(H)−ρ(0)). On the other hand, the magnetic ordering of the d electrons (spins) under H = 0 is achieved by a combination of d–d and π–d interactions. The d–d interaction in the π–d system is usually antiferromagnetic; thus, the ferromagnetic interaction between the d electrons (spins) through the conduction π electrons is necessary to achieve the ferromagnetic ordering of d electrons (spins). In this case the conduction π electrons are spin polarized.
Figure 1 Alternate stacking structure of donor molecule layers involving conducting π electrons and magnetic anion layers involving localized d spins.
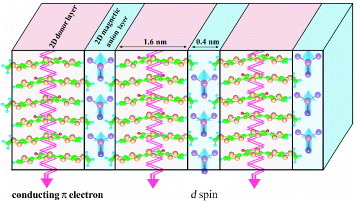
Figure 2 Scheme for π–d and d–d interactions, electron conduction, and spin ordering in molecular systems involving conducting π electrons and localized d spins under (a) H = 0 and (b) H≫Hsp.
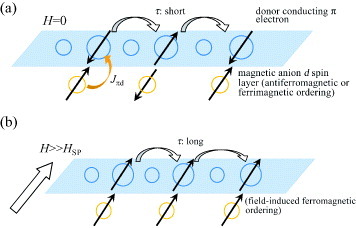
Tetrathiafulvalenes (TTFs) and tetraselenafulvalenes (TSFs), as well as their derivatives known as ‘straight donor molecules’ [Citation10], are conventional donor molecules, whereas FeX4− (X = Cl, Br), Fe(ox)3−, [MnCr(ox)3]−, CuX42− (X = Cl, Br), CoX42− (X = Cl, Br), MnBr42−, etc, are magnetic anions with d spins. Innovative attempts have been made to prepare cation radical salts based on these donor molecules and anions, and the resulting cation radical salts exhibit many interesting properties. Metallic conductivity together with ferromagnetism or antiferromagnetism has been demonstrated in (BEDT-TTF)2•[MnCr(C2O4)3] [BEDT-TTF: bis(ethylenedithio)-tetrathiafulvalene] [Citation11] and κ-(BETS)2•FeX4 (X = Cl, Br) [Citation12, Citation13], respectively. However, the π–d interactions in these cation radical salts are negligible or very weak. In case of magnetic molecular conductors based on straight donor molecules, a strong π–d interaction has only been demonstrated in λ-(BETS)2•FeCl4 [BETS: bis(ethylenedithio)-tetraselenafulvalene] [Citation14], which exhibits a metal-insulator transition at 8.5 K. To realize stronger π–d interaction in other new cation radical salts and to clarify further characteristics of the interaction, we now focus on cation radical salts based on the ‘bent donor molecules’ of ethylenedithio-tetrathiafulvalenoquinone-1,3-dithiolemethide (EDT-TTFVO), ethylenedithio-diselenadithiafulvalenoquinone-1,3-dithiolemethide (EDT-DSDTFVO), ethylenedithiodiselenadithiafulvalenothioquinone -1,3-diselenolemethide (EDT-DSDTFVSDS), ethylenedioxy-tetrathiafulvalenoquinone-1,3-dithiolemethide (EDO-TTFVO) and ethylenedioxytetrathiafulvalenoquinone-1,3-diselenolemethide (EDOTTFVODS), whose structures are shown in figure All these bent donor molecules have been prepared by the authors [Citation15]. These new donor molecules have the following characteristics: (i) the molecular skeleton is highly planar, (ii) the electron-donating ability is comparable to that of the corresponding straight donor molecule and (iii) most importantly, the highest occupied molecular orbital (HOMO) has a comparatively wide electron distribution, even on the terminal 1,3-dithiole or 1,3-diselenole ring, which increases the strength of the π–d interaction with the d spins of magnetic anions [Citation15]. In this review, we describe 2 : 1 cation radical salts formed between the above bent donor molecules and FeX4− ions, which exhibit metallic or semiconducting behavior with a small energy gap associated with antiferromagnetism or ferrimagnetism. Strong π–d interaction in these salts is proved by magnetoresistance measurements.
Figure 3 Chemical structures of bent donor molecules discussed in this review.
Bent donor molecules containing an ethylenedithio group: quasi-one-dimensional π electron system with strong π–d interaction
(EDT-TTFVO)2•FeBr4
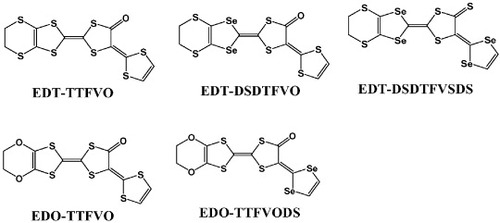
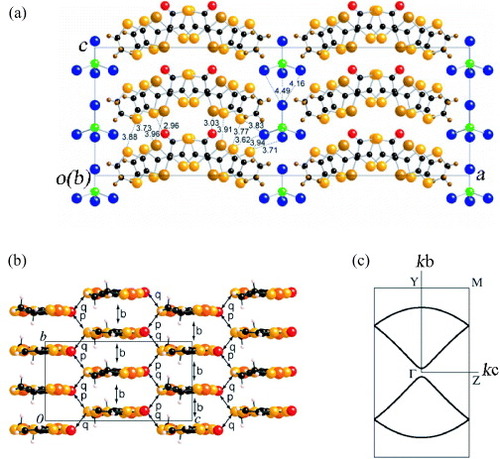
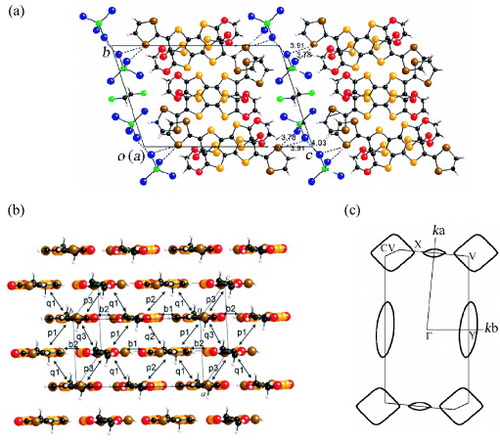
The 2 : 1 salts (EDT-TTFVO)2•FeBr4 and (EDT-TTFVO)2•GaBr4, formed between EDT-TTFVO and an FeBr4− or GaBr4− ion, are obtained as crystals having needle or plate shapes [Citation16]. The needle-like crystals exhibit π–d interaction and very interesting electrical and magnetic properties [Citation17]. The crystal structures of FeBr4− and GaBr4− salts are isostructural to each other (figure (a) for the FeBr4− salt). In the crystal, EDT-TTFVO molecules adopt head-to-tail stacking along the b-axis to form quasi-uniform columns with slightly different interplanar distances of 3.49 and 3.55 Å. The FeBr4− ions are almost straightly aligned parallel to the donor stacking direction.
Figure 4 (a) Crystal structure of (EDT-TTFVO)2•FeBr4 projected onto the ac-plane, (b) packing pattern of donor molecules with the intermolecular overlap integrals schematically shown and (c) calculated Fermi surface of donor layers based on the crystal structure at room temperature.
The intracolumnar intermolecular overlap integrals are approximately uniform owing to the limitation of the calculation method (b1 =b2 =–17.9× 10⁻³), and there are four different intercolumnar overlap integrals a1 =−3.11×10⁻³,a2 =−3.17× 10⁻³,c1 =−1.87× 10⁻³ and c2 =−1.85× 10⁻³ (figure (b)). The intracolumnar overlap integrals are much larger than the intercolumnar ones, indicating the one-dimensional electronic structure. Consistent with this, the calculated Fermi surface exhibits a quasi-one-dimensional feature as shown in figure (c), which implies that the metallic state cannot be maintained down to low temperatures.
Both FeBr4− and GaBr4− salts show moderate electrical conductivities σ at room temperature. In good agreement with their band structures, weak metallic behavior is observed down to ∼170 K. Below 170 K, both salts become semiconducting with small activation energies Eg∼10 meV at 60–170 K. The origin of the metal- semiconductor transition at 170 K has not been elucidated yet.
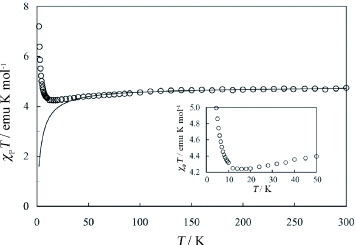
Figure shows dependence of the product of paramagnetic susceptibility χp and temperature (χpT) on temperature in the range 5–300 K for the FeBr4− salt. The χpT value gradually decreases upon cooling to ∼15 K, but it increases below 15 K. The temperature dependence of χp in the range 15–300 K closely follows the Curie–Weiss law for the antiferromagnetically interacting d spins of the FeBr4− ions: χp =C/(T–Θ) +χπ with the Curie constant C = 4.71 emu K mol −1, Weiss temperature Θ=–3.9 K, and a temperature-independent paramagnetic susceptibility related to the conducting π electrons χπ = 2.0× 10⁻⁴ emu mol−1. This Θ value is small and negative, indicating that weak antiferromagnetic interaction. Surprisingly, below ∼15 K the spin interaction changes from antiferromagnetic to ferromagnetic. In the plot of 1/(χp–χπ) versus T, the value of 1/(χp–χπ) can be fitted well by the Curie–Weiss law with Θ=–3.9 K in the T range of 25–300 K. However, below ∼20 K the 1/(χp–χπ) value deviates from the Curie–Weiss law; it monotonically decreases upon cooling and crosses the T-axis at +0.87 K. This intersection point corresponds to Θ< 20 K, indicating that the FeBr4− d spins are subject to weak but ferromagnetic interaction. This change in the interaction of the Fe d spins above and below ∼15 K can be considered as follows. Above 15 K, the Fe d spins are subject to direct interaction with each other in a very weak and antiferromagnetic manner, while the conducting π electrons preferentially contribute to the metallic conduction. There is no significant interaction between the Fe d spins and the conducting π electrons. However, below 15 K the localization of the conducting π electrons becomes significant, and the Fe d spins preferentially interact with each other through the π spins produced on the donor-stacked column. Remarkably, such an indirect d–π–d spin interaction is ferromagnetic, although its origin is still unclear.
Figure 5 Temperature dependence of χpT in the range 1.8–300 K (inset: 1.8–50 K) measured on the polycrystalline sample. The solid curve shows the numerical simulation with χp=C/(T–Θ) +χπ, where C = 4.71 emu K mol −1, Θ =–3.9 K, and χπ = 2.0× 10⁻⁴ emu mol−1. (Reproduced with permission from [Citation17].)
The slope of the 1/(χp–χπ) versus T plot at higher T (25–300 K) corresponds to 1/C (C = 4.71), while below ∼20 K the slope (1/C;C = 3.98) becomes steeper. Thus, the low-temperature C value is ∼15% lower than the high-temperature one. This may be caused by decrease of the spin quantum number S of the Fe(III) d spin from the 5/2 value due to some geometrical change around the Fe atom in the FeBr4− ion. Alternatively, there is significant antiferromagnetic interaction with the conducting π electrons on the donor-stacked column. The magnetization M curve was measured in the applied field H±50 kOe at 1.8 K [Citation18]. A sigmoidal curve without hysteresis (coercive force < 7 Oe) was obtained with M = ±25350 emu mol−1 (±4.39μB) at H =±50 kOe. This value increases for higher fields. Numerical simulation predicts that the saturation of occurs at H∼±300 kOe, with M = ±28900 emu mol−1 (±5.00μB), which is very close to that obtained from (EDT-TTFVO)2•FeBr4 with 6×10²³ Fe(III) (S = 5/2) spins per mole. This result reveals the Fe(III) d spin value is still 5/2 and it decreases with the antiferromagnetic π–d interaction.
The observed M curve is compared with two related Brillouin functions with S = 5/2 and Θ = 0 K, and with S = 5/2 and Θ =+0.87 K at 1.8 K. For magnetic fields lower than ∼±10 kOe the observed M values are larger than those in the Brillouin function with Θ = 0 K at each ±H. However, the observed M curve shows a very good fit to the Brillouin function with Θ = +0.87 K when H is lower than ±1 kOe. However, above ±1 kOe the curves diverge and saturate more slowly than the Brillouin function. The slower saturation behavior of the observed M curve and the decreased value of C at the low T can be reasonably explained by considering that at low temperature, the conducting π electrons participate by antiferromagnetic interaction with the Fe d spins, eventually bringing about ferromagnetic interaction between the neighboring Fe d spins. It is obvious that in this spin-interacting system, the magnetic moments of the Fe d spins exhibit slower saturation because of the participation of the magnetic moments from the conducting π electrons in the reverse direction. Furthermore, M is measured down to 0.4 K by an induction method using a pulse magnet system combined with a 3He refrigerator. As shown in figure (a), the M curve still reaches saturation faster as T decreases below 2 K. However, the slope becomes very small, between 1.2 and 0.4 K, suggesting that the M curve is completely saturated near this temperature range. No hysteresis is observed.
Figure 6 (a) Magnetization curves of (EDT-TTFVO)2•FeBr4 at different temperatures. A single sweep from +25 to –15 kOe is presented for clarity. (b) Temperature dependence of the oscillation amplitude. The solid curve is an empirically fitted function. Inset: example of the signal voltage (amplitude = 0.13 V) measured at 0.4 K by the resonant circuit method. (Reproduced with permission from [Citation18].)
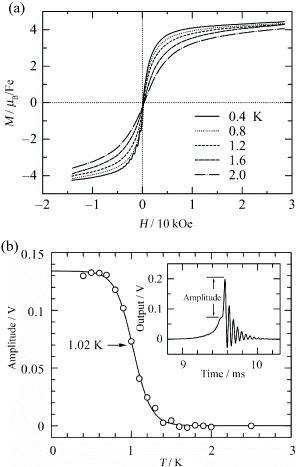
To confirm the presence of this ferrimagnetic ordering due to the interaction between the Fe d spins of FeBr4− ions and the π spins on the donor-stacked column and to determine the transition temperature TC, the above M curve data are analyzed using the Arrott method of constructing a M2–H/M plot [Citation19]. The Arrott method is suitable for high TC, but not for a ferrimagnet with low TC and a small hysteresis loop. Therefore, a resonant circuit method developed by Noguchi et al is employed, which can sensitively detect the jump in M in a small hysteresis loop caused by ferromagnetic or ferrimagnetic ordering [Citation20]. As shown in figure (b), an oscillation initially appears below 1 K, when H changes sign, and the magnitude of oscillation increases as T decreases. The oscillating behavior is clearer for bare signals induced in the pickup coil. The inset of figure (b) shows an example at 0.4 K. When H crosses zero, a sharp jump in M occurs in the hysteresis loop, which causes a transient oscillation in the signal, and the frequency corresponding to the jump in M crosses the resonant frequency of the circuit. Because the initial amplitude of the oscillation is proportional to the jump in M, the amplitude is plotted against T, and a step-like change is observed (figure (b)). The transition temperature is estimated as TC≅1.02 K at the midpoint of the step.
The determination of TC and the existence of ferromagnetic ordering are also confirmed by measuring heat capacity Cmol. The Cmol(T) dependence in the range 0.5–20 K shows a clear peak at 0.9 K, which is close to the TC value determined from the magnetization measurement. The lattice contribution on the order of 1 mJ K−2 mol−1 is estimated from the linear relation in the Cmol/T versus T2 plot below 8 K. However, under these conditions it is difficult to eliminate the electronic contribution, since the π–d interaction may form a strongly correlated electron system. After subtracting the lattice contribution from Cmol, the magnetic heat capacity Cmag is obtained (figure (a)). The shape of Cmag is not a λ-type anomaly as commonly observed in a second-order transition, but a cusp with a tail that extends to the high-T region, which is characteristic of the short-range or low-dimensional ordering in Heisenberg spin systems arranged in a two-dimensional square lattice [Citation21]. Accordingly, the Fe d spins of FeBr4− ions and the π spins on the donor-stacked column are in the two-dimensional ferrimagnetic ordering state above TC, but are converted to a three-dimensional ferrimagnet below TC. The magnetic entropy Smag is calculated by integrating Cmag /T with respect to T (figure (a)). Compared with R ln 6 and (R ln 6 +R ln 2) (R: gas constant), which correspond to Smag for Fe d spins with S = 5/2 and the total Smag for Fe d spins with S = 5/2 and donor π spins with S=1/2, respectively, the observed value of Smag is larger than R ln 6 but smaller than (R ln 6 +R ln 2) above 2.5 K, suggesting that the d spins coexist with the π spins on the donor-stacked columns, which provide an additional contribution to Smag.
Figure 7 (a) Temperature dependences of Cmag and Smag for (EDT-TTFVO)2•FeBr4. R ln 6 and (R ln 6 +R ln 2) correspond to Smag for Fe(III) d spins with S = 5/2 and the total Smag for Fe(III) d spins with S = 5/2 and donor π spins with S = 1/2, respectively. (b) Temperature dependence of Cmol under different magnetic fields. (Reproduced with permission from [Citation18].)
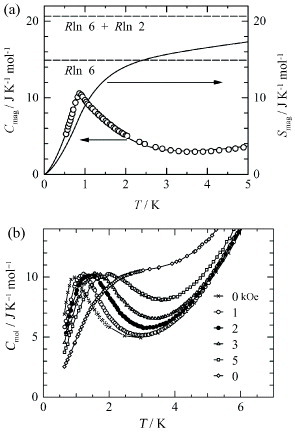
The temperature dependence of Cmol at several magnetic fields of 0–10 kOe was also studied (figure (b)) [Citation18]. The magnetic field was applied perpendicularly to the plane of the FeBr4− ion square lattice. Cmol shows strong field dependence, i.e. its maximum gradually shifts to the higher temperatures as H increases. This round peak is due to the magnetic Schottky anomaly caused by the Zeeman splitting of the degenerated ground state in magnetic field. This field dependence is very similar to those in other ferromagnetic and ferrimagnetic materials; it contrasts that of antiferromagnets, which show weak field dependence.
To further clarify the π–d interaction in this salt, electric resistivity ρ and magnetoresistance measured along the a-axis were studied under high magnetic fields applied parallel to the least conducting c∗-direction at pressures up to 8.0 GPa [Citation22]. As shown in figure (a), ρ and Eg for the insulating state are suppressed by applying pressure P< 170 K, while the insulating state is retained below 146 K (Tmin) even under 8.0 GPa. The conductivity increase indicates that the bandwidth W of the conduction π electron band is enhanced by pressure. Tmin decreases with increasing P up to 4 GPa, but above 4 GPa, the increase is small. Moreover, dρ/dT above Tmin changes near 4 GPa from positive (metallic behavior) to negative (nonmetallic behavior) with increasing P. Accordingly, the pressure dependence of Tmin cannot simply be explained by increasing bandwidth. Presumably, the pressure causes a change not only in the bandwidth but also in other parameters involved in the enhancement of the π–d interaction, which can stabilize the insulating state above 4 GPa.
Figure 8 (a) Temperature-dependent resistivity ρ of (EDT-TTFVO)2•FeBr4 under external pressure and (b) magnetoresistance of (EDT-TTFVO)2•FeBr4 at 4.2 K under pressures of 4.0 and 6.5 GPa.
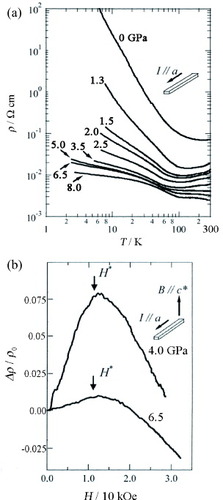
Figure (b) shows magnetoresistance under 4.0 and 6.5 GPa at 4.2 K [Citation22]. The magnetoresistance under 4.0 GPa increases with increasing H until H∗= 12.5 kOe, where a maximum appears, and above H∗ it decreases. The magnetoresistance under 6.5 GPa also shows similar behavior, but H∗ slightly shifts to a higher H side and the magnitude of the positive magnetoresistance is strongly suppressed. On the assumption that the positive magnetoresistance originates from the orbital effect, i.e. Δρ/ρ∼ (μH)2, the marked reduction of magnetoresistance below H∗ can be related to the decrease of mobility μ =eτ/m∗, i.e. a decrease in the scattering time τ and/or an increase in the effective mass m∗. It would be difficult to explain the decrease in τ with pressure. Therefore, we assume that the reduction of μ is caused by the increase in m∗, which is enhanced by the interaction with the Fe d spins of the FeBr4− ion. The enhancement of m∗ may be responsible for the stabilization of the insulating state above 4 GPa. When H exceeds H∗, it is most probable that the negative magnetoresistance is caused by the alignment of the Fe d spins with H, suggesting that the spin fluctuation of the FeBr4− ions contributes to the occurrence of the insulating state above 4 GPa as well as the correlation effect. These results indicate that the π–d interaction is enhanced and that it has a strong effect on the transport properties of this salt above 4 GPa.
Corresponding to the ferromagnetic ordering of Fe(III) d spins through the antiferromagnetic interaction with the conducting π electrons in this FeBr4− salt, a dielectric slow-down phenomenon toward the ferrimagnetic state is observed [Citation23, Citation24]. The dielectric constant ε(ω) is expressed as ε(ω) =ε1(ω) +iε2(ω),ε2 = 4πσ1/ω. Here σ1 is conductivity, and ε1 and ε2(σ1) are obtained from the capacitance and conductance measured down to 0.4 K by a three-terminal method, using a capacitance bridge with an excitation frequency f =ω/2π in the range 0.3 Hz–100 kHz. Figures (a) and (b) respectively show the temperature dependences of σ1 and ε1 at f = 14 Hz–14 kHz and zero dc bias (Ebias = 0). With the decrease in T from ∼40 K, σ1 decreases monotonically, yielding almost the same semiconducting energy gap as that obtained in dc measurement (figure (a)). Below ∼15 K, σ1 becomes highly dispersive with increasing frequency and exhibits frequency-dependent peaks at low temperatures. On the other hand, as shown in figure (b), ε1 exhibits a broad peak around 10–15 K at f = 14 Hz. The peak shifts to a higher temperature and weakens with increasing f. The magnitude of ε1∼104 is very large. At lower temperatures, a step-like change occurs at the temperature where the peak in σ1 appears. Figures (a) and (b) show the temperature dependences of ε1 and ε2, respectively, measured at 563 Hz at different temperatures below 15 K. The characteristic behaviors around 3 K can be well analyzed using a Debye relaxation mechanism [Citation25] with a single relaxation time τ:
4 where ε∞ is the dielectric constant at ω =∞. When the frequency ω of electric field becomes close to the relaxation rate τ−1, namely ωτ∼ 1, the dielectric response ε1 becomes small, while the dielectric loss ε2 shows a peak, owing to the time delay in the response.
Figure 9 Temperature dependences of (a) σ1 and (b) ε1 at f = 14.0 Hz, 140 Hz, 1.40 kHz, and 140 kHz for (EDT-TTFVO)2•FeBr4. (Reproduced with permission from [Citation24].)
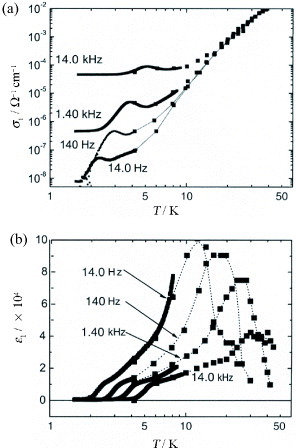
Figure 10 Temperature dependences of (a) ε1 and (b) ε2 at f=563 Hz for (EDT-TTFVO)2•FeBr4. (Reproduced with permission from [Citation24].)
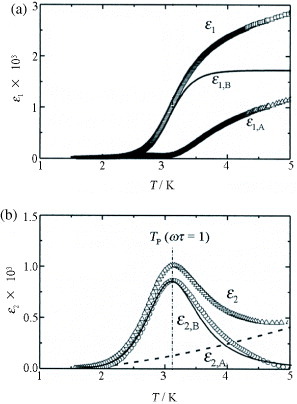
It is assumed that ε2 consists of a non-Debye relaxation component ε2,A and a Debye relaxation component ε2,B. By subtracting ε2,A from ε2, ε2,B is obtained, which exhibits an asymmetric peak centered at Tp = 3.2 K (figure (b)). Similar treatment of ε2 is performed for all the other excitation frequencies. Similarly, ε1 is divided into a non-Debye relaxation component ε1,A and a Debye relaxation component ε1,B (figure (a)). The self-consistently obtained ε1,B and ε2,B have a typical Cole–Cole plot, indicating that the data can be understood in terms of the Debye relaxation with a single relaxation process. This suggests that the physical process of the Debye relaxation here is due to an order-disorder type interconversion between two or more stable states.
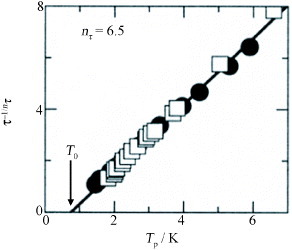
Let us analyze τ–Tp data at T<7 K. The data cannot be reproduced by the Arrhenius plot for an activation-type process as conventionally observed in polar crystals. Alternatively, a satisfactory fit can be obtained using
5 where the characteristic Tp,T0, and critical index nτ are the fitting parameters. The τ−1/nτ–Tp plot shown in figure gives nτ= 6.5 and T0 = (0.75± 0.15) K. This result suggests that τ diverges at T =T0, which is very close to or slightly lower than the cusp at T=0.86 K in the measurement of Cmol.
Figure 11 Plot of τ−1/nτ versus Tp for two different samples (▪ and □) of (EDT-TTFVO)2•FeBr4. The straight line is obtained by substituting nτ= 6.5 and T0 = (0.75± 0.15) K into equation (Equation55 ). (Reproduced with permission from [Citation24].)
The changes in σ1 and ε1 were studied by applying Ebias at f = 1 kHz and T = 4.2 K. With increasing Ebias, the magnitude of σ1 increases by more than one order, while ε1 remains constant at low Ebias, followed by a sharp decrease toward zero. The integration of ε1 with respect to Ebias gives a ferroelectric-like polarization curve. The Ebias dependence of σdiff (dJ/dEbias, where J is dc current density) also shows similar behavior. That σ1∼σdiff at a high Ebias indicates that the conductivity can be exclusively ascribed to the π electron transport, because the dc response originates solely from the conduction of π electrons, which at low Ebias are highly localized, but are forced into current-carrying states at high Ebias. At Ebias∼ 0, σ1 becomes as large as ∼10σdiff, which means that the excess conductivity of σ1 may be due to the dielectric loss of some polarizations with a time-varying excitation field. These results demonstrate that the dielectric slowing down intrinsically proceeds toward a ferrimagnetic ordering state in this salt.
(EDT-DSDTFVO)2• FeX4 (X = Cl, Br)
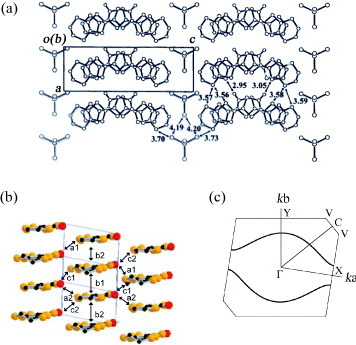
The electronic structure of (EDT-TTFVO)2•FeBr4 is one dimensional, which results in the instability of the metallic states at low temperatures. To increase the dimensionality of the electronic structure, one may consider reinforcing the lateral intermolecular interactions. Therefore, a slight chemical modification of EDT-TTFVO is carried out by replacing two sulfur atoms in the central TTF skeleton with two Se atoms, to form EDT-DSDTFVO, since the size and polarization of selenium atom are larger than those of sulfur. Single crystals of (EDT-DSDTFVO)2•MX4 (M = Fe, Ga; X = Cl, Br) salts are obtained by electrocrystallization. The crystal structure of (EDT-DSDTFVO)2•FeBr4 has been successfully solved [Citation26]. Similar crystal structures were obtained for the other MX4− salts, whose crystal structure analyses were insufficient because of the large orientational disorder of the donor molecule. In the crystal structure of the FeBr4− salt, the asymmetric unit contains one donor molecule and half of the anion. Figure (a) depicts the projection of the salt onto the ac-plane. The donor molecules have an approximately planar shape and are uniformly stacked with several S•••S(Se) contacts along the b-axis. Furthermore, these stacked columns are aligned along the c-axis, so that the donor layer has a β-like packing. There are also several close contacts between the S and Se atoms of donor molecules in neighboring columns, suggesting a considerable intercolumnar interaction. On the other hand, the FeBr4− ions intervene between the donor layers and are aligned uniformly along the b-axis, but have a zigzag arrangement along the c-axis. The Br•••Br distances between neighboring FeBr4− ions are 4.16 and 4.27 Å, which are much longer than the van der Waals contact distance (3.91 Å). In contrast, the FeBr4− ions are in close contact with neighboring donor molecules, as can be seen from the short Br•••S distances (3.62–3.83 Å), suggesting a strong π–d interaction between the donor molecules and FeBr4− ions.
Figure 12 (a) Crystal structure of (EDT-DSDTFVO)2•FeBr4 projected onto the ac-plane, (b) packing pattern of donor molecules with the intermolecular overlap integrals schematically and (c) calculated Fermi surface of donor layers based on the crystal structure at room temperature.
There are three different intermolecular overlap integrals b =–28.1× 10⁻³,p = 4.37× 10⁻³ and q = 5.51×10⁻³, as shown in figure (b). Compared with those in (EDT-TTFVO)2•FeBr4, the intermolecular lateral interactions are enhanced; however, the overlap integral along the stacking direction (b) is 5–6 times larger than those along the lateral directions (p and q). The calculated band dispersion has a quarter-filled nature because of the 2 : 1 composition of the donor molecule and FeBr4− ion, and the uniform stacking structure of the donor molecules. As shown in figure (c), the Fermi surface is two-dimensional but opens along the kc (lateral) direction, in a similar manner to that of (EDT-TTFVO)2•FeBr4. Furthermore, the Fermi surface is folded in half along the kc direction because the period of the crystal lattice in this salt is double that in (EDT-TTFVO)2•FeBr4 along the kc direction. This increases the dimensionality of the electronic structure and therefore stabilizes the metallic state down to lower temperatures.
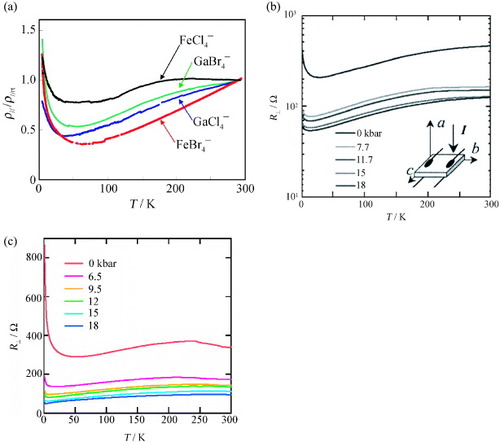
The in-plane and out-of-plane resistivities (ρ∥ and ρ⊥, respectively) of the plate-like crystals of (EDT-DSDTFVO)2•MX4 (M = Fe, Ga; X = Cl, Br) are measured down to 4.2 K. The in-plane resistivities are 0.02–0.1Ω cm at room temperature, while the out-of-plane resistivities are ∼10 times larger. As shown in figure (a), all the salts show metallic behavior in ρ∥ down to 30–70 K. Below the corresponding temperatures, slight upturn in ρ∥ is observed; however, the increase is very small and the values of ρ∥ at 4.2 K are approximately the same as those at room temperature [Citation26]. The estimated activation energies are 1–3 meV; therefore, all the salts are intrinsically metallic down to 4.2 K. The temperature dependences of ρ⊥ in GaCl4− and FeCl4− salts show similar tendencies to those observed in ρ∥, and the upturns of ρ⊥ are nearly suppressed by applying pressure ∼7 kbar (figures (b) and (c)) [Citation27].
Figure 13 Temperature dependences of (a) ρ∥/ρ∥rt under P = 0 kbar for the GaCl4− (blue), FeCl4− (black), GaBr4− (green), and FeBr4− salts (red) of EDT-DSDTFVO, of (b) R⊥ at P = 0, 7.7, 11.7, 15 and 18 kbar for (EDT-DSDTFVO)2•GaCl4, and of (c) R⊥ at P = 0, 6.5, 9.5, 12, 15, and 18 kbar for (EDT-DSDTFVO)2•FeCl4. (Reproduced with permission from [Citation26].)
The χp values of polycrystalline samples of the FeCl4− and FeBr4− salts are measured under field of 1 kOe in the temperature range 1.9–300 K. The temperature dependences of χp obey the Curie–Weiss law with C = 4.52 emu K mol −1 and Θ =–0.3 K above 1.9 K for the FeCl4− salt, and with C = 4.61 emu K mol −1 and Θ =–9.7 K above 8 K for the FeBr4− salt, indicating that Fe d spins are subject to very weak or comparatively strong antiferromagnetic interaction, respectively. In both salts, no antiferromagnetic ordering was recognized down to 1.9 K.
The magnetoresistance of (EDT-DSDTFVO)2•MCl4(M = Fe, Ga) was studied in [Citation27]. Magnetic field up to 50 kOe was applied parallel to the conducting bc-plane, and Δρ⊥/ρ⊥ was measured at 4.0 K. The GaCl4− salt shows a positive magnetoresistance of +4.0% under a field of 50 kOe, similar to those observed in nonmagnetic metals. On the other hand, a large negative magnetoresistance is observed for the FeCl4− salt (–14.7% at 50 kOe). This negative magnetoresistance originates from the suppression of spin scattering caused by spin alignment under the applied magnetic field. The difference in magnetoresistance between the GaCl4− and FeCl4− salts provides direct evidence of π–d interaction in the FeCl4− salt. Furthermore, the negative magnetoresistance in the FeCl4− salt is enhanced under increasing pressure: –16.3% under 6.5 kbar and –17.7% under 9.5 kbar at 50 kOe. A slight decrease in the positive magnetoresistance is observed in the GaCl4− salt by applying pressure: +3.5% under 7.7 kbar and +3.3% under 15 kbar at 50 kOe. The magnetoresistances of the GaBr4− and FeBr4− salts are both positive. However, the magnetoresistance in the FeBr4− salt is ∼30% of that in the GaBr4− salt: +4.1 and +12.0% at 1.3 K under a field of 50 kOe for FeBr4− and GaBr4− salts, respectively. Probably, the magnetoresistance in the FeBr4− salt involves a negative component in addition to a large and positive component.
(EDT-DSDTFVSDS)2•FeBr4
To further increase the interaction between the donor and anion, a new donor molecule, EDT-DSDTFVSDS, is designed and synthesized. This molecule is derived from EDT-DSDTFVO by replacing the C=O group and 1,3-dithiole ring with a C=S group and 1,3-diselenole ring, respectively. It is expected that the short atomic contacts between the donor molecule and anion will be enhanced by the increased size and polarization of the Se atom in this donor molecule compared with the corresponding sulfur atom in EDT-EDSTFVO. The 2 : 1 salts of EDT-DSDTFVSDS with an FeBr4− or GaBr4− ion are black plate-like crystals [Citation28]. The crystal structures of both salts have been successfully solved and are isostructural to each other.
In the crystal structure, the asymmetric unit contains one donor molecule, which is approximately planar. Figure (a) depicts the projection onto the ac-plane for the FeBr4− salt. The donor molecules show head-to-tail stacking resulting in uniform columns along the b-axis, and several S•••S and S•••Se contacts are observed along the stacking direction. The terminal 1,3-diselenole rings are outside the stacking columns of the central TTF skeleton, which is different from those in (EDT-DSDTFVO)2•FeBr4, where the 1,3-dithiole rings are inside the stacking columns. Despite this difference, the donor molecule arrangement of this salt is very similar to that of (EDT-DSDTFVO)2•FeBr4 and belongs to the β-type packing pattern. Several close S•••Se contacts are also observed between neighboring columns, suggesting a strong two-dimensional intermolecular interaction. The FeBr4− ions are aligned in a rectangular form in the bc-plane and are sandwiched by the donor layers. In comparison with (EDT-DSDTFVO)2•FeBr4, the neighboring FeBr4− ions are separated further from each other due to the staggered 1,3-diselenole rings. Accordingly, the shortest Br•••Br distance between neighboring FeBr4− ions is 4.47 Å, which is much larger than the van der Waals distance 3.90 Å. In contrast, the FeBr4− ion has very close Br•••S (3.75 Å) and Br•••Se (3.91, 3.94, 4.06 and 4.13 Å) contacts with neighboring donor molecules. These structural features suggest that the π–d interaction between the FeBr4− ion and the donor molecule should be much stronger than the d–d interaction between the FeBr4− ions.
Figure 14 (a) Crystal structure of (EDT-DSDTFVSDS)2•FeBr4 projected onto the ac-plane, (b) packing pattern of donor molecules with the intermolecular overlap integrals schematically shown, and (c) calculated Fermi surface of donor layers based on the crystal structure at room temperature.
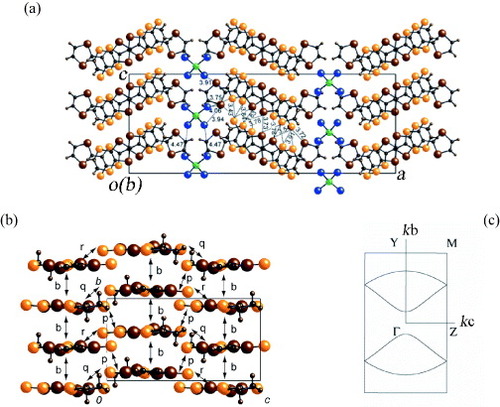
The intermolecular interactions in the donor layer are schematically shown in figure (b). The overlap integral along the stacking direction (b =–39.71× 10⁻³) is four to six times larger than those along the lateral direction (p = 9.44× 10⁻³, q = 7.11× 10⁻³ and r = 1.73× 10⁻³). The calculated Fermi surface exhibits a two-dimensional feature but opens along the kc-direction, similarly to that of (EDT-DSDTFVO)2•FeBr4 (figure (c)).
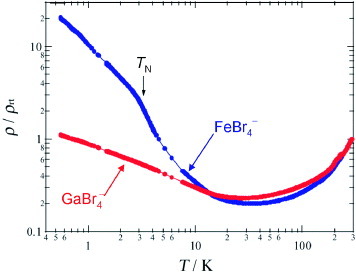
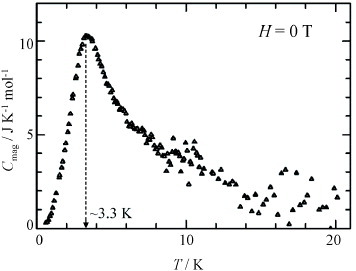
The conductivities of the FeBr4− and GaBr4− salts along the b-axis are 200–300 S cm−1 at 290 K, and the ρ(T) dependences are shown in figure . Both FeBr4− and GaBr4− salts exhibit metallic behavior down to ∼30 K. Below this temperature, the slight upturns in ρ are observed while conductivities remain high at 4.2 K (∼70 and 100 S cm−1 for FeBr4− and GaBr4− salts, respectively). Below ∼10 K, the increase in ρ is more rapid in the FeBr4− salt than in the GaBr4− salt. Note that a turning point in ρ is observed for the FeBr4− salt near 3.3 K, which corresponds to the temperature TN of antiferromagnetic ordering of the d spins of FeBr4− ions as described below.
Figure 15 Temperature dependences of ρ/ρrt in the range 0.6–300 K for the FeBr4− and GaBr4− salts of EDT-DSDTFVSDS. (Reproduced with permission from [Citation29].)
The magnetization of the FeBr4− salt is measured using single crystals under H = 10 kOe applied along each of the lattice axes (a-, b- and c-axes). The temperature dependence of χp is also determined using the polycrystalline sample and can be fitted to the Curie–Weiss law with C = 4.71 emu K mol−1 and Θ =–10.5 K, suggesting a relatively strong antiferromagnetic interaction between the d spins of FeBr4− ions. As shown in figure (a), χp sharply drops below ∼5 K only for H∥c, suggesting an antiferromagnetic ordering along the c-axis. The M–H curves measured at 1.9 K show a spin-flop around 18 kOe only for H∥c (figure (b)). Furthermore, the Cmol was measured in the temperature range 0.5–30 K for both FeBr4− and GaBr4− salts. The Cmag of the d spins in the FeBr4− salt is obtained by subtracting Cmol estimated from the GaBr4− salt; however, this value of Cmag still contains the electronic contribution of the π–d interaction. Figure shows the temperature dependence of Cmag. A maximum in the Cmag appears at 3.3 K, but the shape is not a λ-type. Such a shape with a tail extending to the higher temperatures is characteristic of a short-range or low-dimensional ordering in Heisenberg spin systems arranged in a two-dimensional square lattice. The measurements of M and Cmol undoubtedly indicate an antiferromagnetic ordering near TN = 3.3 K with the spin easy axis parallel to the c-axis.
Figure 16 (a) Temperature dependences of χp (H= 10 kOe, T<20 K) and (b) field (H) dependences of M (T =1.9 K, H<50 kOe) for H∥a (red circles), H∥b (blue circles), and H∥c (green pluses) directions of the single crystal and for the polycrystalline sample (–) of (EDT-DSDTFVSDS)2•FeBr4 (Reproduced with permission from [Citation28].)
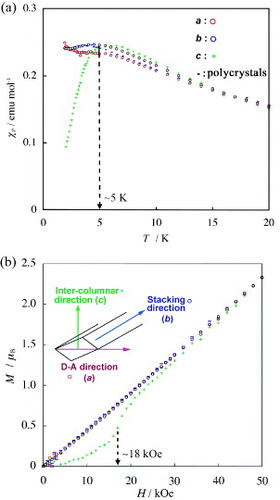
Figure 17 Temperature dependence of Cmag for (EDT-DSDTFVSDS)2•FeBr4.
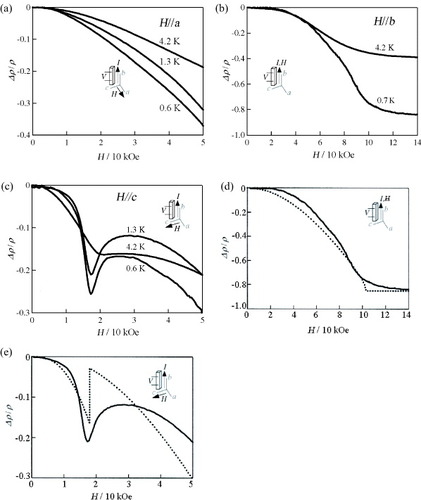
As mentioned above, ρ increases more rapidly in the FeBr4− salt than in the GaBr4− salt below 30 K. It is supposed that the stabilization of the insulating state in the FeBr4− salt is most plausibly due to the significant π–d interaction. To confirm this point, magnetoresistance was measured for both salts under a grease pressure of ∼0.2 kbar. A field of up to 50–140 kOe was applied parallel to either a-, b- or c-axis. For the GaBr4− salt, the magnetoresistance is ca. +3% at 50 kOe and 4.2 K. In contrast, the FeBr4− salt shows large and negative magnetoresistances of about –20% at 50 kOe, and about –40% at 140 kOe and 4.2 K, irrespective of the direction of the applied field. Figures (a)–(c) show the magnetoresistances along H∥a, H∥b and H∥c in the FeBr4− salt, respectively. A sharp dip appears near 18 kOe for H∥c without hysteresis, but no dip is observed for H∥a and H∥b. This is clear evidence for strong anisotropic π–d interaction. The saturated behavior under negative magnetoresistance continues beyond 100 kOe, and the magnetoresistance at 149 kOe and 0.7 K amounts to –85%.
Figure 18 Magnetoresistance of (EDT-DSDTFVSDS)2•FeBr4 for (a) H∥a at T = 0.6, 1.3 and 4.2 K and H < 50 kOe, (b) H∥b at T = 0.7 and 4.2 K and H < 140 kOe, (c) H∥c at T = 0.6, 1.3 and 4.2 K and H < 50 kOe, and experimental (—) and calculated (- - - -) results for (d) H∥b at T = 0.7 K and for (e) H∥c at T = 1.3 K. (Reproduced with permission from [Citation29].)
The angular dependences of magnetoresistance for the FeBr4− and GaBr4− salts were studied below 8 K. The result for the FeBr4− salt at 8.0 K is very similar to those at 4.2 and 1.4 K for the GaBr4− salt, suggesting that the π electronic state of the FeBr4− salt above 8 K is the same as that of the GaBr4− salt. However, below 4.2 K the angular dependence of magnetoresistance for the FeBr4− salt is distinctly different from that for the GaBr4− salt, indicating that the electrical conductivity of the FeBr4− salt is strongly affected by the Fe d spins.
The relation between the antiferromagnetic arrangement of the d spins and the enhancement of the insulating state was theoretically interpreted in [Citation29]. The more rapid increase in ρ in the FeBr4− salt than in the GaBr4− salt below 30 K is assumed as the activation-type gap enhancement caused by the periodic magnetic potential of the d spins under magnetic field, Qp(H). The magnetoresistance, Δρ(H)/ρ(0 T), is expressed as
6 Here R'Fe(H) =RGa exp(αQp(H)/kBT); α is a factor intrinsic to the material expressing the strength of the π–d interaction α = 2kBT/5 ln(RFe /RGa), and RFe and RGa are the electrical resistances of the FeBr4− and GaBr4− salts normalized to those at 300 K, respectively. Qp(H) is given by equations (Equation7
7 ) and (Equation8
8 )
7
8 Here g is the Zeeman splitting factor, assumed here as g = 2; HSF is the spin-flop field. The calculated results are in good agreement with the observed giant negative magnetoresistance for H∥b at 0.7 K (figure (d)). Additionally, the dip anomaly in magnetoresistance for H∥c at 1.3 K is well reproduced (figure (e)). These results support the model of the antiferromagnetic arrangement of the d spins that enhances the insulating state due to the π electrons through the π–d interaction.
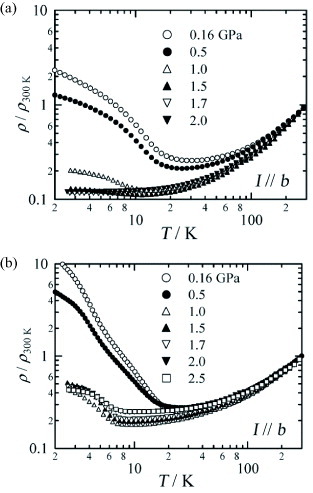
The effects of pressure on the ρ(T) dependences and on magnetoresistance were studied for the FeBr4− and GaBr4− salts [Citation30]. The insulating state of the GaBr4− salt is gradually suppressed by pressure, and at 2.0 GPa this salt becomes metallic in the whole temperature range (figure (a)). For the FeBr4− salt, the insulating state is also gradually suppressed with increasing pressure, and metallic behavior is observed down to 7 K (figure (b)). However, even at 2.5 GPa, the insulating state is still retained below 7 K, where the π–d interaction becomes significant. When the applied pressure exceeds 2.5 GPa, the insulating states in both salts are stabilized and the phase transition temperatures increases with pressure. There is almost no change in the magnetoresistance at 4.2 K upon applying a pressure of up to 2.0–2.5 GPa, at which the GaBr4− salt exhibits a metallic state, while a slightly insulating state is preserved for the FeBr4− salt.
Figure 19 Temperature dependences of ρ/ρ300 K for (a) (EDT-DSDTFVSDS)2•GaBr4 and (b) (EDT-DSDTFVSDS)2•FeBr4 under different pressures. (Reproduced with permission from [Citation30].)
Bent donor molecules containing an ethylenedioxy group: two-dimensional π-electron system with strong π–d interaction
The electronic structures of the salts described in chapter 2 are intrinsically one-dimensional that necessarily results in the instability of their metallic state. To realize stable metallic salts involving strong π–d interaction, further chemical modification of the donor molecule is carried out. It has been demonstrated that the TTF derivative containing a bi (ethylenedioxy) group BO has a strong tendency to provide two-dimensional stable metals due to a unique feature of the ethylenedioxy group, which has the ability to form hydrogen bonds (CH•••O) [Citation10]. In this chapter, we focus on the structures and properties of cation radical salts based on bent donor molecules containing an ethylenedioxy group.
(EDO-TTFVO)2•FeCl4
EDT-TTFVO is slightly modified by replacing the ethylenedithio group with an ethylenedioxy group, resulting in EDO-TTFVO. The 2 : 1 salt of EDO-TTFVO with the FeCl4− ion, (EDO-TTFVO)2•FeCl4, was obtained by electrocrystallization as a black needle-like crystals [Citation31]. Two crystallographically independent donor molecules (A and B) are involved in the crystal, and they are located on the mirror plane, indicating the complete planarity of their molecular structures (figure (a)). The donor molecules form an A–B–A–B-type lateral array along the c-axis with several short S•••S(O) contacts, suggesting a strong intermolecular interaction along this direction. In the bc-plane, the donor molecules form two identical diagonal stacks of the form A–A′–B–B′ along the [0 2 1] and [0 2 −1] directions. This donor array resembles the β''-type packing [Citation32] typical for BO salts. There is a relatively short hydrogen bond (CH•••O, 2.87 Å) between the ethylenedioxy groups along the p1 direction, which might explain this characteristic for BO salts packing. The FeCl4− ions form a two-dimensional rectangular arrangement in the bc-plane with a short Cl•••Cl contact (3.48 Å) along the b-axis. In addition, there is a short Cl•••S contact (3.60 Å) between the 1,3-dithiole ring of the donor molecule and the Cl atom of the FeCl4− ion, suggesting the possibility of a strong π–d interaction by virtue of the characteristic bent donor molecular structure of EDO-TTFVO.
Figure 20 (a) Crystal structure of (EDO-TTFVO)2•FeCl4 projected onto the ac-plane, (b) packing pattern of donor molecules with the intermolecular overlap integrals schematically shown, and (c) calculated Fermi surface of donor layers: observed and calculated (parenthesis) cross-sectional areas of α- and β-orbits.
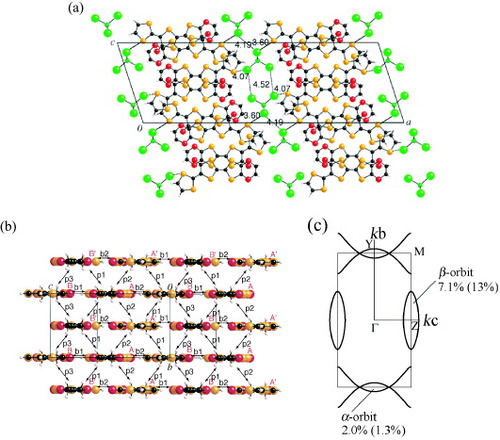
There are two types of overlap integrals (b1 = 7.0× 10⁻³ and b2 = 10.4× 10⁻³) along the lateral direction, and three types of overlap integrals (p1 (A–B) = 10.9× 10⁻³, p2 (A–A') =–4.3× 10⁻³ and p3 (B–B′) =–3.5× 10⁻³) along the diagonal stacking direction (figure (b)). The magnitudes of the overlap integrals along the lateral and diagonal directions are comparable to each other, suggesting a two-dimensional interaction in the conducting bc-plane. As a result, the calculated Fermi surface shows a two-dimensional feature and closes along line Y–M but opens along line Z–M, giving rise to one closed ellipse around point Z and two open Fermi surfaces along line M–Y–M (figure (c)).
The conductivities parallel and perpendicular to the conducting bc-plane are 8.4 and 0.02 S cm−1 at room temperature, respectively. The temperature dependences of both ρ∥ (I∥bc-plane) and ρ⊥ (I⊥bc-plane) are understood as stable and metallic down to 0.3 K. This salt is the first stable metal among the cation radical salts based on bent donor molecules. The stabilization of the metallic state originates from the formation of a two-dimensional electronic structure by introducing an ethylenedioxy group.
Susceptibility χp was measured under an applied field of 1 kOe using the polycrystalline sample in the temperature range 1.9–300 K. The temperature dependence of χp above 15 K can be well fitted with the Curie–Weiss law with C = 4.45 emu K mol −1 and Θ =–9.8 K, suggesting a relatively strong preferential antiferromagnetic interaction between the d spins of FeCl4− ions. Susceptibility χp was also measured on a single crystal in the temperature range 1.9–20 K along the a-, b- and c-axes. As shown in figure , a sudden decrease in χp is observed below ∼3 K when a field is applied along the a-axis. This indicates an antiferromagnetic ordering at TN≅ 3 K with the spin-easy axis parallel to the a-axis. The M curve measured at 1.9 K showed a spin-flop at approximately 12 kOe when a field was applied along the a-axis and a very slow increase in M compared with that of the Brillouin function with g = 2.0, S= 5/2 and T = 1.9 K. Because the metallic state is maintained even at the antiferromagnetic ordering, this salt is a new antiferromagnetic molecular metal at ambient pressure.
Figure 21 Temperature dependences of χp of (EDO-TTFVO)2•FeCl4 in the range 1.9−20 K under H = 1 kOe for a single crystal (blue: H∥a; red: H∥b; green: H∥c), and a Curie–Weiss fitting curve (solid line) with C = 4.45 emu K mol−1 and Θ =–9.8 K for a polycrystalline sample. (Reproduced with permission from [Citation31].)
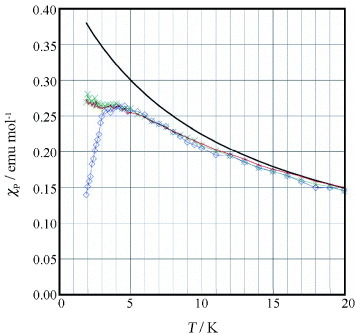
Figure (a) shows the magnetoresistance for magnetic fields of up to 140 kOe at different temperatures between 0.30 and 11.0 K, where the field is applied along the a-axis [Citation33]. At 11.0 K, the magnetoresistance increases as H2, which is simply explained in terms of the orbital effect due to the Lorenz force. However, a dip anomaly in magnetoresistance appears at TN and 60 kOe. The anomaly becomes more prominent and shifts to a higher H with decreasing T. At 0.30 K, the dip structure is observed near 80 kOe. In addition, no hysteresis is observed between increasing and decreasing H sweeps, indicating that this phase transition is of second order. The TN of the FeCl4− salt is determined as 3 K from the χp(T) measurements; thus this anomaly in the magnetoresistance near 80 kOe is likely caused by the transition from the antiferromagnetic to the paramagnetic state. For H up to 80 kOe, the field dependence of the magnetoresistance curve gradually changes from concave to convex on cooling. As shown in figure (b) for the magnetoresistance plotted versus H2, a large downward deviation from H2 dependence is observed below TN in the high-field region. Because the alignment of d spins in the FeCl4− ions is enhanced with increasing H and the π–d interaction becomes important below TN, this deviation can be attributed to the suppression of the spin-scattering effect by d spins in the FeCl4− ions under the external field.
Figure 22 (a) Magnetic field dependences of resistivity ρ(H) of (EDO-TTFVO)2•FeCl4 in the range of 0–140 kOe at different temperatures and (b) magnetoresistance data in the form of H2 plots in the H range 0−70 kOe. (Reproduced with permission from [Citation31].)
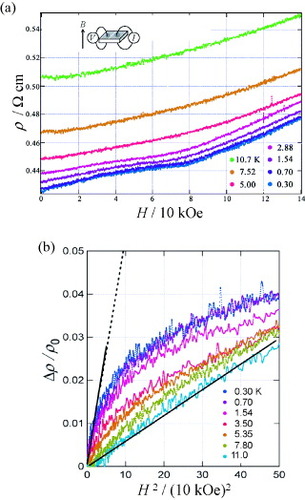
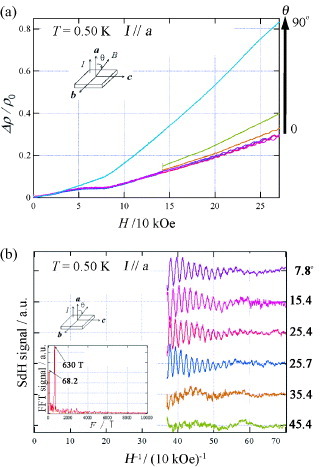
Figure (a) shows the magnetoresistance at 0.50 K for H up to 260 kOe when the angle θ between the field and the a∗-axis is varied between 0 and 90°. The dip anomaly at 80 kOe becomes more distinct near 0°. The magnitude of magnetoresistance strongly depends on the field direction above 30 kOe, but below 30 kOe it is isotropic or Zeeman-like. Thus, the Lorentz force plays a minor role in the magnetoresistance below 30 kOe. Under fields of above 170 kOe, Shubnikov–de Haas oscillation is clearly observed. The Fourier transform spectrum of the oscillations (figure (b)) shows two characteristic frequencies F(θ) of 600 and 6020 kOe, whose cross-sectional areas correspond to 2.0 and 7.1% of the first Brillouin zone, respectively. The frequencies of the oscillation are obtained from the equation F(θ)=F0 cos θ valid for the two-dimensional Fermi surface. The oscillation with F(θ) = 600 kOe is due to the α-orbit centered at point Y, while the cross-sectional area corresponding to the oscillation with F(θ) = 6020 kOe is the β-orbit centered at point Z of the first Brillouin zone (figure (c)). The observed cross-sectional areas are compatible with the values (13 and 1.3%) predicted by the band structure calculation.
Figure 23 (a) Magnetic field dependences of magnetoresistance for different angles θ= 0–90° at T = 0.50 K and (b) fast Fourier transform (FFT) of Shubnikov–de Haas oscillations for different angles at T = 0.5 K for (EDO-TTFVO)2•FeCl4.
(EDO-TTFVODS)2• FeBr4•(DCE)0.5
Another new bent donor molecule EDO-TTFVODS was synthesized, in which the 1,3-dithiole ring in EDO-TTFVO was replaced by a 1,3-diselenole ring, resulting in a stronger π–d interaction. A single crystal of (EDO-TTFVODS)2•FeBr4•(DCE)0.5 was obtained by electrocrystallization in 1,2-dichloroethane (DCE) [Citation34]. The crystal structure is shown in figure (a); it is very similar to that of (EDO-TTFVO)2•FeCl4 except for the difference in the anion layer. Each donor layer also has a two-dimensional β''-type stacking. In the lateral and diagonal donor arrays, there are comparatively close S•••S, S•••Se, and Se•••Se contacts. In each anion layer, two FeBr4− ions and one DCE molecule are alternately arranged along the intermolecular direction, whereas the intramolecular direction has a regular arrangement of FeBr4− ions. Hence the Br•••Br contacts for each pair of FeBr4− ions have comparatively short distances of 4.03 and 4.19 Å, whereas the distance is large (4.55 Å) between the Br atoms of the neighboring FeBr4− ions separated by one DCE molecule. On the other hand, the Br•••Br contact distance along the intracolumnar direction is 3.74 Å, which is shorter than the van der Waals distance 3.90 Å. There are also close contacts between the Se atoms of the donor molecule and the Br atoms of the FeBr4− ion.
Figure 24 (a) Crystal structure of (EDO-TTFVODS)2•FeBr4•(DCE)0.5 projected onto the bc-plane, (b) packing pattern of donor molecules with the intermolecular overlap integrals schematically shown, and (c) calculated Fermi surface of donor layers based on the crystal structure at room temperature.
As shown in figure (b), there are comparable lateral (b1 =–10.6× 10⁻³ and b2 =–5.15× 10⁻³) and diagonal (p1 =–11.1× 10⁻³, p2 =–3.28× 10⁻³, p3 =–2.63× 10⁻³, q1 =–9.79× 10⁻³, q2 =–2.41× 10⁻³ and q3 =−3.36 × 10⁻³) overlap integrals, indicating a two-dimensional interaction between the donor molecules in the conducting ab-plane. The Fermi surface obtained by the band structure calculation using the above overlap integrals is also two-dimensional but opens along the ka and kc directions because of the low symmetry of the space group (figure (c)). As a result, a rectangular electron pocket surrounds point C, while two different elliptic hole pockets surround points X and Y.
The ρ values of the single crystal in the ab-plane (ρ∥) and in the c∗-direction, perpendicular to the ab-plane (ρ⊥), are ∼0.1 and 20 Ω cm at 300 K, respectively. The temperature dependence of ρ∥ shows that metallic behavior persists down to 0.45 K in spite of a slight upturn in ρ∥ below 5 K. A similar trend is also observed in the ρ⊥(T) dependence. The slight increase in ρ∥ and ρ⊥ as T decreases below 5 K is most likely caused by the π–d interaction.
Magnetic susceptibility was measured for both polycrystalline and single-crystal samples of the FeBr4− salt in the temperature range 1.9–300 K. The temperature dependence of χp obeys the Curie–Weiss law with C = 4.48 emu K mol −1 and Θ =–18.7 K above 20 K. However, below 20 K the values of χp become smaller than those predicted by the above Curie–Weiss curve, and a peak appears near 4.5 K suggesting antiferromagnetic ordering. Measurement of χp using the single crystal confirms the value of TN and the easy axis of the magnetization. Figure shows χp(T) dependences below 15 K when a field of 5 kOe is applied along the a-, b-, and c∗-axes. A distinct decrease in χp is observed near 4 K only along the c∗-axis; therefore, TN is assigned to ∼4 K and the easy axis to the c∗-axis. More accurate value TN =4.5 K was determined from heat capacity measurements.
Figure 25 Temperature dependences of magnetic susceptibility (χp) for a single crystal of (EDO-TTFVODS)2•FeBr4•(DCE)0.5 for H∥a, H∥b and H∥c∗ below 15 K. (Reproduced with permission from [Citation34].)
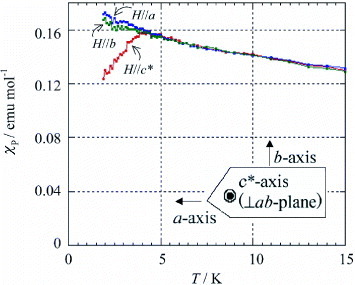
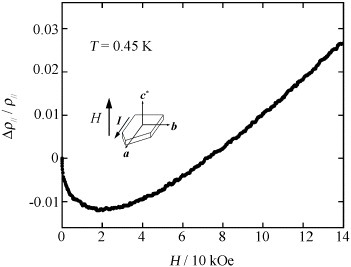
Figure shows magnetoresistance ρ∥ at 0.45 K in fields up to 140 kOe applied perpendicular to the conducting ab-plane. The magnetoresistance decreases with H up to 20 kOe, while above 20 kOe magnetoresistance increases with H. The minimum value of magnetoresistance is very small (1–2%) and a negative magnetoresistance persists until 70 kOe. Above 70 kOe the magnetoresistance becomes positive and increases up to 260 kOe. Near 160 kOe there is a kink, which appears to be due to the spin-flop, but no Shubnikov–de Haas oscillation is observed until 260 kOe in contrast to the case of (EDO-TTFVO)2•FeCl4, where the spin-flop occurs at 80 kOe and 0.5 K and the Shubnikov-de Haas oscillation appears at 180 kOe. This probably originates from the much stronger d–d and π–d interactions for this salt than for (EDO-TTFVO)2•FeCl4. If the crystal quality is good, the Shubnikov–de Haas oscillation might be observed at fields higher than 260 kOe.
Figure 26 Magnetoresistance of (EDO-TTFVODS)2•FeBr4•(DCE)0.5 in the field range H = 0–140 kOe at T = 0.45 K.
Magnitudes of π–d and d–d interactions in magnetic molecular conductors based on the bent donor molecules
In this chapter, the overall π–d and d–d interactions as well as their effects on TN and magnetoresistance in the above five cation radical salts are discussed. The values of TN are determined by both the magnitudes of direct and indirect interactions between the localized d spins, Jdd, and those between the conducting π electrons and the localized d spins, Jπd. On the other hand, the magnitude of negative magnetoresistance represents the strength of the π–d interaction. Mori and coworkers developed a method of estimating Jdd, Jπd, and TN for S = 5/2 spins from an extended Hückel molecular orbital calculation [Citation35, Citation36]. According to this method, Jdd, Jπd, and TN are given by
9
10
11 Here Udd is the on-site Coulomb interaction of the donor HOMO, Δπd is the energy difference between the donor HOMO and the FeX4− d orbitals, td and tπd are the transfer integrals between the FeX4− d orbitals and between the donor HOMO and the FeX4− d orbitals, respectively, kB is the Boltzmann constant, χq is the staggered susceptibility, and Cπ is the Curie constant due to the π spins (2Cπ/χq = 500 K is used in the present calculation).
Using this method, Jdd, Jπd and TN are calculated for the five FeX4− salts together with the other antiferromagnetic molecular metals of κ-(BETS)2•FeCl4,κ-(BETS)2•FeBr4, and λ-(BETS)2•FeCl4 which exhibit the strongest π–d interactions reported so far. Figure shows a summary of Jdd and Jπd for these eight FeX4− salts. Among them, the Jπd (17.7 K) of λ-(BETS)2•FeCl4 is largest, while (EDT-DSDTFVSDS)2•FeBr4 and (EDO-TTFVODS)2• FeBr4•(DCE)0.5 also have comparable large values of Jπd (15.6 and 14.5 K, respectively). Remarkably, the Jdd = 0.20 K of (EDT-DSDTFVSDS)2•FeBr4 is considerably smaller than that (0.64 K) of λ-(BETS)2• FeCl4, whereas (EDO-TTFVODS)2• FeBr4•(DCE)0.5 has a relatively large Jdd = 1.86 K. Judging from these values of Jπd and Jdd for the three salts, (EDT-DSDTFVSDS)2• FeBr4 is considered as a superior π–d system to λ-(BETS)2•FeCl4 because of its large Jπd and small Jdd, while (EDO-TTFVODS)2•FeBr4•(DCE)0.5 is considered as a novel π–d system with both large Jπd and large Jdd. On the other hand, Jπd is moderate for (EDT-TTFVO)2•FeBr4(7.26 K), (EDT-DSDTFVO)2•FeBr4 (7.58 K), and κ-(BETS)2•FeBr4 (7.93 K), and among them (EDT-TTFVO)2•FeBr4 has a relatively large Jdd (1.82 K). The FeCl4− salts, (EDO-TTFVO)2•FeCl4 and κ-(BETS)2•FeCl4, have small values of Jπd (2.91 and 3.12 K), but a comparatively large Jdd is observed for (EDO-TTFVO)2•FeCl4 (1.17 K). With the exception of (EDT-DSDTFVO)2•FeBr4, which exhibits no antiferromagnetic ordering down to 1.9 K, the observed antiferromagnetic ordering temperatures (TN) of the other salts are 4.5 K for (EDO-TTFVODS)2•FeBr4•(DCE)0.5, 3.3 K for (EDT-DSDTFVSDS)2• FeBr4, 3.0 K for (EDO-TTFVO)2•FeCl4, 2.5 K for κ-(BETS)2•FeBr4, 0.86 K for (EDT-TTFVO)2•FeBr4, and 0.45 K for κ-(BETS)2•FeCl4. TN for λ-(BETS)2•FeCl4 is rather high (8.5 K), while a metal-to-insulator transition is also observed at the same temperature. According to equation (Equation1111 ), TN is determined by the sum of Jπd and Jdd. Therefore, the high TN for (EDO-TTFVODS)2•FeBr4•(DCE)0.5 is due to both the large Jπd and large Jdd. The comparatively high TN for (EDO-TTFVO)2•FeCl4 originates from the large Jdd, while Jπd predominantly contributes to the high TN for (EDT-DSDTFVSDS)2•FeBr4. The moderate Jπd and large Jdd afford a higher TN than 0.86 K for (EDT-TTFVO)2•FeBr4, but the unexpectedly low TN might be due to the ferromagnetic ordering of the Fe(III) d spins through the antiferromagnetic interaction with the conducting π electrons.
Figure 27 Jdd and Jπd values of ferrimagnetic or antiferromagnetic molecular semiconductors or metals calculated by the extended Hückel molecular orbital method.
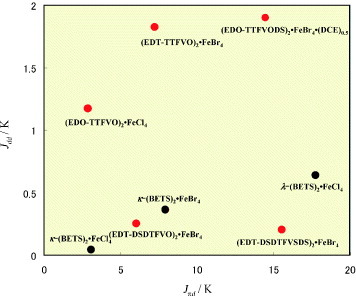
The negative magnetoresistance is caused by the π–d interaction in the FeX4− salts, and its magnitude is dependent on Jπd. In fact, remarkably large negative magnetoresistances are observed in (EDO-TTFVODS)2•FeBr4•(DCE)0.5 and particularly in (EDT-DSDTFVSDS)2•FeBr4, both of which have a large Jπd.
Summary
The crystal structures and properties of cation radical salts based on bent donor molecules with FeX4− (X = Cl, Br) anions are reviewed. All salts exhibit comparatively high electrical conductivity at room temperature and have quarter-filled band structures. Among them, the cation radical salts of the bent donor molecules containing an ethylenedioxy group, EDO-TTFVO and EDO-TTFVODS, afford two-dimensional electronic structures, and stable metallic behavior is maintained down to low temperatures. On the other hand, the cation radical salts of the bent donor molecules containing an ethylenediothio group, EDT-TTFVO, EDT-DSDTFVO, and EDT-DSDTFVSDS, afford intrinsically one-dimensional band structures, which result in the instability of the metallic state at low temperatures. The resistivity increase with decreasing temperature is more rapid for (EDT-DSDTFVSDS)2•FeBr4 than for the corresponding GaBr4− salt owing to the magnetic π–d interaction, which stabilizes the insulating state.
The Fe(III) (S = 5/2) d spins of FeX4− ions are ordered through both direct d–d and indirect π–d interactions, but the ordered states are still two-dimensional as proved by the measurements of M and Cp. All salts exhibit antiferromagnetic ordering (the ordering is also achieved at temperatures lower than 1.9 K for (EDT-DSDTFVO)2•FeBr4) except for (EDT-TTFVO)2• FeBr4, which exhibits a ferromagnetic ordering near 1 K. For the salts exhibiting antiferromagnetic ordering, the d(↑)–π(↓)–π(↑)–d(↓) interaction predominantly works together with the antiferromagnetic d–d interaction. In contrast, for (EDT-TTFVO)2•FeBr4, the d(↑)–π(↓)–d(↑) interaction is preferential to the antiferromagnetic d–d interaction, which results in the ferromagnetic ordering of the d spins, while the overall spin system is ferrimagnetic. By virtue of the π–d or d–π–d interaction, the electric dipoles on the donor molecule layers exhibit a dielectric slowing-down phenomenon toward this ferrimagnetic state. The mechanism of this anomalous dielectric phenomenon needs further investigation.
The magnetic exchange interactions, Jdd and Jπd, are obtained by molecular orbital calculations. The Jπd values of (EDT-DSDTFVSDS)2•FeBr4 and (EDO-TTFVODS)2• FeBr4•(DCE)0.5 are large and comparable to that of λ-(BETS)2•FeCl4. The Jdd of (EDT-DSDTFVSDS)2• FeBr4 is smaller, while the Jdd of (EDO-TTFVODS)2•FeBr4•(DCE)0.5 is larger than that of λ-(BETS)2•FeCl4. Corresponding to the strong π–d interaction, (EDT-DSDTFVSDS)2•FeBr4 exhibits a large negative magnetoresistance of 85% at H = 149 kOe and T = 0.7 K. The relatively high magnetic ordering temperatures are mainly determined by both Jdd and Jπd for (EDO-TTFVODS)2•FeBr4•(DCE)0.5, by Jπd for (EDT-DSDTFVSDS)2•FeBr4, and by Jdd for (EDO-TTFVO)2•FeCl4.
In inorganic ferromagnetic metals with a significantly larger t than U, the electron transport is not affected even by the strong interaction between the conduction s/p electrons and the localized d electrons(spins). In contrast, in molecular conductors, t is usually smaller than U. Accordingly, molecular π–d systems exhibit a variety of types of electron transport resulting from the π–d interactions. In λ-(BETS)2•FeCl4 the metallic conductivity is destroyed by the strong π–d interaction and is abruptly converted to the insulating state. Also, in (EDT-DSDTFVSDS)2•FeBr4 the insulating state generated in the low-temperature range is stabilized by the strong π–d interaction, whereas in (EDO-TTFVODS)2•FeBr4•(DCE)0.5 the strong π–d interaction has no effect on the metallic state. In view of these results, the π–d interactions can provide a variety of types of electron conduction and magnetism depending on the difference in magnitudes between t and U and the π–d interaction. Accordingly, it should be possible to realize an unprecedented ferromagnetic molecular metal with a strong π–d interaction, one of the targets of this study.
Acknowledgments
We are deeply grateful to collaborators, whose names appear in the papers cited in this review, for their valuable cooperation and discussion.
References
- RudermanMKittelC 1954 Phys. Rev. 96 99 http://dx.doi.org/10.1103/PhysRev.96.99
- KatsuyaT 1956 Prog. Theor. Phys. 16 45 http://dx.doi.org/10.1143/PTP.16.45
- YosidaK 1957 Phys. Rev. 106 893 http://dx.doi.org/10.1103/PhysRev.106.893
- SaitoG 2007 Bull. Chem. Soc. Japan 80 1 http://dx.doi.org/10.1246/bcsj.80.1
- OuahabLEnokiT 2004 Eur. J. Inorg. Chem. 933
- KobayashiHCuiH–BKobayashiA 2004 Chem. Rev. 104 5265 http://dx.doi.org/10.1021/cr030657d
- CoronadoEDayP 2004 Chem. Rev. 104 5419 http://dx.doi.org/10.1021/cr030641n
- EnokiTMiyazakiA 2004 Chem. Rev. 104 5449 http://dx.doi.org/10.1021/cr0306438
- YamadaJAkutsuHNishikawaHKikuchiK 2004 Chem. Rev. 104 5057 http://dx.doi.org/10.1021/cr0306687
- YamadaJSugimotoT 2003 TTF Chemistry—Fundamentals and Applications of Tetrathiafulvalene JYamada TSugimoto Kodansha Springer
- KobayashiHTomitaHNaitoTKobayashiASakaiFWatanabeTCassouxP 1996 J. Am. Chem. Soc. 118 368 http://dx.doi.org/10.1021/ja9523350
- CoronadoEGalán–MascarósJ RGómez–GarcíaC JLaukhinV N 2000 Nature 408 447 http://dx.doi.org/10.1038/35044035
- OjimaEFujiwaraHKatoKKobayashiHTanakaHKobayashiATokumotoMCassouxP 1999 J. Am. Chem. Soc. 121 5581 http://dx.doi.org/10.1021/ja990894r
- OtsukaTKobayashiAMiyamotoYKikuchiJWadaNOjimaEFujiwaraHKobayashiH 2000 Chem. Lett. 732
- SugimotoT 2008 Chem. Lett. 37 896 http://dx.doi.org/10.1246/cl.2008.896
- MatsumotoT et al 2002 J. Solid State Chem. 168 408 http://dx.doi.org/10.1006/jssc.2002.9688
- MatsumotoT et al 2002 Inorg. Chem. 41 4763 http://dx.doi.org/10.1021/ic020143h
- MatsumotoTSugimotoTAruga–KatoriHNoguchiSIshidaT 2004 Inorg. Chem. 43 3780 http://dx.doi.org/10.1021/ic049851o
- ArrottA 1957 Phys. Rev. 108 1394 http://dx.doi.org/10.1103/PhysRev.108.1394
- NoguchiSMatsumotoAMatsumotoTSugimotoTIshidaK 2004 Physica B 346–347 397 http://dx.doi.org/10.1016/j.physb.2004.01.114
- BlömbergenP 1977 Physica B 85 51
- FujimotoTYasuzukaSYokogawaKHayashiTHiraokaTFujiwaraHSugimotoTHedoMUwatokoYMurataK 2006 J. Low Temp. Phys. 142 613 http://dx.doi.org/10.1007/BF02679582
- NegishiEYabutaSMatsumotoTSugimotoTToyotaN 2004 J. Phys. IV France 114 125 http://dx.doi.org/10.1051/jp4:2004114027
- NegishiEYabutaSToyotaNMatsumotoTSugimotoT 2007 J. Phys. Soc. Japan 76 093703 http://dx.doi.org/10.1143/JPSJ.76.093703
- YamadaYFujiiYHattaI 1968 J. Phys. Soc. Japan 24 1053
- FujiwaraHHayashiTSugimotoTNakazumiHNoguchiSLiLYokogawaKYasuzukaSMurataKMoriT 2006 Inorg. Chem. 45 5712 http://dx.doi.org/10.1021/ic060034t
- LiLYasuzukaSWengYYokogawaKFujimotoTSugimotoTFujiwaraHHayashiTHiraokaTMurataK 2006 J. Low Temp. Phys. 142 469 http://dx.doi.org/10.1007/BF02679547
- HayashiT et al 2006 J. Am. Chem. Soc. 128 11746 http://dx.doi.org/10.1021/ja064307v
- FujimotoTYasuzukaSYokogawaKYoshinoHHayashiTFujiwaraHSugimotoTMurataK 2008 J. Phys. Soc. Japan 77 014704 http://dx.doi.org/10.1143/JPSJ.77.014704
- FujimotoTHayashiTSugimotoTYoshinoHMurataK 2009 J. Phys. Soc. Japan 78 014710 http://dx.doi.org/10.1143/JPSJ.78.014710
- FujiwaraH et al 2005 J. Am. Chem. Soc. 127 14166 http://dx.doi.org/10.1021/ja055263d
- MoriT 1998 Bull. Chem. Soc. Japan 71 2509 http://dx.doi.org/10.1246/bcsj.71.2509
- TeramuraMYokogawaKYasuzukaSSasakiTWadaKHiraokaTHayashiTFujiwaraHSugimotoTMurataK 2006 J. Low Temp. Phys. 142 485 http://dx.doi.org/10.1007/BF02679551
- XiaoXHayashiTFujiwaraHSugimotoTNoguchiSWengYYoshinoHMurataKAruga–KatoriH 2007 J. Am. Chem. Soc. 129 12618 http://dx.doi.org/10.1021/ja074840q
- MoriTKatsuharaM 2002 J. Phys. Soc. Japan 71 826 http://dx.doi.org/10.1143/JPSJ.71.826
- MoriTKatsuharaMAkutsuHKikuchiKYamadaJFujiwaraHMatsumotoTSugimotoT 2005 Polyhedron 24 2315 http://dx.doi.org/10.1016/j.poly.2005.03.068