Abstract
Superconducting incommensurate organic composite crystals based on the methylenedithio-tetraselenafulvalene (MDT-TSF) series donors, where the energy band filling deviates from the usual 3/4-filled, are reviewed. The incommensurate anion potential reconstructs the Fermi surface for both (MDT-TSF)(AuI2)0.436 and (MDT-ST)(I3)0.417 neither by the fundamental anion periodicity q nor by 2q, but by 3q, where MDT-ST is 5H-2-(1,3-dithiol-2-ylidene)-1,3-diselena-4,6-dithiapentalene, and q is the reciprocal lattice vector of the anion lattice. The selection rule of the reconstructing vectors is associated with the magnitude of the incommensurate potential. The considerably large interlayer transfer integral and three-dimensional superconducting properties are due to the direct donor–donor interactions coming from the characteristic corrugated conducting sheet structure. The materials with high superconducting transition temperature, Tc, have large ratios of the observed cyclotron masses to the bare ones, which indicates that the strength of the many-body effect is the major determinant of Tc. (MDT-TS)(AuI2)0.441 shows a metal–insulator transition at TMI=50 K, where MDT-TS is 5H-2-(1,3-diselenol-2-ylidene)-1,3,4,6-tetrathiapentalene, and the insulating phase is an antiferromagnet with a high Néel temperature (TN=50 K) and a high spin–flop field (Bsf=6.9 T). There is a possibility that this material is an incommensurate Mott insulator. Hydrostatic pressure suppresses the insulating state and induces superconductivity at Tc=3.2 K above 1.05 GPa, where Tc rises to the maximum, Tcmax=4.9 K at 1.27 GPa. This compound shows a usual temperature–pressure phase diagram, in which the superconducting phase borders on the antiferromagnetic insulating phase, despite the unusual band filling.
Introduction
In many organic superconductors, the ratio of the donor molecules to the anions is represented by an integer, typically D2A (D=donor molecule, A=anion) [Citation1–3]. The band filling of these compounds is 3/4, and this corresponds to effective half-filling in the presence of the dimerization gap. The donor–anion ratio takes a definite number for a given combination of donor and anion, and the ratio is constant; this differs from that in many inorganic compounds such as high-Tc cuprate superconductors, in which the ground state is determined by the carrier number. The ground states of organic compounds are regulated using the bandwidth by means of, for example, pressure.
Several groups have attempted to control the degree of charge transfer, i.e. band filling of organic conductors. The first method of controlling the charge transfer degree in organic conductors involves introducing composite anions of X− and Y2−, for example, GaCl4− and CoCl42−, respectively; this type of conductor changes from a band insulator to a metallic conductor, but does not show superconductivity [Citation4–6]. Yamamoto and Kato [Citation7] have used another approach; they have obtained several materials with unusual donor/anion ratios by mixing neutral molecules with the anions. They have not obtained a superconductor either. The use of noninteger composition, i.e. DAx (x≠m/n, m,n=1, 2, 3, …) is the third way, and compounds of this type include superconductors. Although there are many organic compounds with noninteger composition [Citation8], this type of compound showing superconductivity is very limited. In the 1980s, the appearance of a superconducting phase was reported in the incommensurate crystals κ-(ET)4Hg2.78Cl8 [Citation9] and κ-(ET)4Hg2.89Br8 [Citation10], where ET is bis(ethylenedithio)tetrathiafulvalene. In the beginning of the 21st century, another organic superconductor with noninteger composition (MDT-TSF)(AuI2)0.436 was developed, where MDT-TSF is methylenedithio-tetraselenafulvalene [Citation11].
Although there are many structurally incommensurate crystals they are classified into several categories, modulated structures, incommensurate composite crystals and quasicrystals [Citation12, Citation13]. An incommensurate charge–density–wave system and the high-Tc superconductor Bi2Sr2CaCu2O8+δ are in the category of modulated structures, and κ-(ET)4Hg3−δX8 (X=Br, Cl) and Hg3−δAsF6 are incommensurate composite crystals. In this article, we define an incommensurate organic conductor as an incommensurate composite crystal based on two interpenetrating lattice periodic structures that are mutually incommensurate. In general, we can describe the relation between the two real space lattices as
where
is an interlattice 3×3 matrix relating the real space translations of the sublattices [Citation14]. For the simplest case, when both the b- and c-axes are common for both lattices and the a′-axis is parallel to the a-axis, the matrix elements of
, σij (i,j=1,2, 3), are expressed as
In the case of σ11≠m/n (m,n=1, 2, 3,…) in equation (Equation2
), the crystal system is an incommensurate lattice structure.
An incommensurate composite crystal represents a single thermodynamic phase, and interactions between the subsystems are intrinsic to its existence, where the other subsystems act as incommensurate external potentials for the subsystem under consideration [Citation13]. Therefore, an incommensurate organic conductor is interesting from the viewpoint of not only band filling but also aperiodic (or double periodic) ordered systems. In this article, we review the new incommensurate organic superconductors, the MDT-TSF series superconductors, from the sample preparation to the physical properties.
Synthesis of MDT-TSF and its related donors and discovery of a series of superconductors
Chemistry of TSF donors
Before discussing the structural and physical aspects of the incommensurate superconductors based on MDT-TSF and its related donors in the following sections, we shall give a brief overview of the chemistry of the electron donors and how the present series of incommensurate superconductors were discovered. Until the latter half of the 1990s, the number and types of selenium variants of tetrathiafulvalene (TTF) were relatively limited [Citation15]. This is mostly because of the lack of suitable synthesis methods and intermediates (in other words, building blocks); selenium reagents and selenium-containing starting materials are generally less accessible, more expensive and even more toxic in some cases than their corresponding sulfur reagents [Citation16].
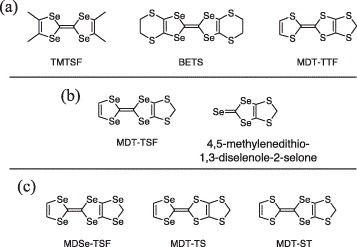
In the field of molecular conductors and superconductors, however, selenium-containing donors, particularly tetraselenafulvalene (TSF) derivatives, have played important roles; for example, the first molecular superconductors developed by Bechgaard et al [Citation17] were based on TMTSF [tetramethyltetraselenafulvalene (figure (a))], and the unusual interplay between magnetic anions and conducting donor layers based on BETS [bis(ethylenedithio)tetraselenafulvalene (figure (a))] resulted in intriguing ‘magnetic superconductors’ [Citation18]. Note that the TTF counterparts of these TSFs are known as electron donors capable of affording superconductors. In this regard, it is important to transform the TTF framework in the TTF-type donors yielding interesting conducting and/or superconducting radical cation salts into the TSF framework. One such molecular framework that remained unreachable was MDT-TTF [methylenedithio-tetrathiafulvalene (figure (a))] with a rather simple asymmetric electron donor framework, which was reported to afford a κ-type superconducting AuI2 salt with Tc of 4.1–4.3 K [Citation19, Citation20].
Figure 1 (a) Chemical structure of electron donors. (b) MDT-TSF (left) and its potential precursor (right). (c) Related electron donors of MDT-TSF.
Synthesis of MDT-TSF
The major reason for the difficulty in the synthesis of the TSF variant of MDT-TTF, i.e. MDT-TSF, as shown in figure (b), is the fact that no method can be used to synthesize its direct precursor, 4,5-methylenedithio-1,3-diselenole-2-chalcogenone. Although the successful synthesis of 4,5-methylenedithio-1,3-diselenole-2-selone (figure (b)) was achieved using one-pot synthesis of 1,3-diselenone-2-selone followed by direct annulation of the methylenedithio moiety in 1999 [Citation21], it turned out that all the attempts of phosphite-mediated coupling reaction of the precursor have failed. This forced us to devise another synthesis method capable of affording the methylenedithio-annulated TSF derivatives. After several trials, the synthesis strategy thus developed was the initial formation of the TSF skeleton followed by the construction of the methylenedithio moiety, as shown in figure [Citation11].
Figure 2 Synthesis of MDT-TSF.
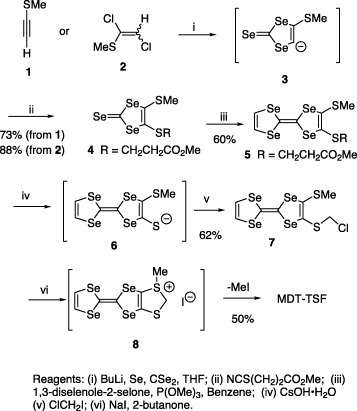
This route involves a combination of effective synthesis techniques newly developed, namely, one-pot formation of 1,3-diselenole-2-selone from a terminal alkyne [Citation22], a trialkyl phosphite-mediated coupling reaction to the TSF derivative, and finally heterocycle formation by transalkylation on a chalcogen atom [Citation23]. In addition, a deprotection/realkylation protocol of a protected TSF-thiolate building block 5 was newly established for this synthesis [Citation24]. For the first step, methylthioacetylene (1) [Citation25] or 1,2-dichloro-1-methylthioethane (2) [Citation26] was successively treated with nBuLi, selenium powder, and carbon diselenide, to generate in situ the vinyl anion intermediate (3), which was then quenched with 3-thiocyanatopropionic acid methyl ester [Citation27] to give a 1,3-diselenole-2-selone derivative (4) in 73 or 88% yield. Cross-coupling of 4 with unsubstituted 1,3-diselenole-2-selone gave the desired asymmetrical TSF derivative 5 in 60% yield. Treatment of 5 with cesium hydroxide monohydrate in N,N-dimethylformamide (DMF) generated the reactive TSF monothiolate (6), which was alkylated in situ with chloroiodomethane to give 7 in 62% isolated yield. Formation of the outer 1,3-dithiolene ring was achieved by an initial halogen exchange to the corresponding iodide followed by spontaneous transalkylation into MDT-TSF via the sulfonium salt 8.
AuI2 salt of MDT-TSF
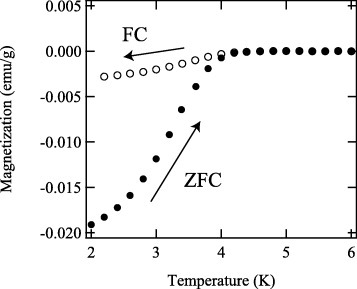
Because MDT-TTF gave the superconducting AuI2 salt, electrocrystallization of MDT-TSF in the presence of tetrabutylammonium diiodoaurate as a supporting electrolyte in chlorobenzene was first examined. Within a few days, needle-shaped crystals (figure ) were obtained: note that κ-(MDT-TTF)2AuI2 was reported to be platelike crystals. Its electrical conductivity measured along the needle direction was very high (2000 S cm−1, an average of 8 samples) at room temperature. Resistivity decreases with decreasing temperature and abruptly drops at 4.5 K, which is characteristic of the onset of a superconducting transition (figure ). The magnetization with a superconducting quantum interference device (SQUID) magnetometer also reveals its superconductivity (figure ). The diamagnetic shielding at 2 K shows 80% of the perfect diamagnetism, indicating that the salt is a bulk superconductor. In both zero-field-cooled (ZFC) and field-cooled (FC) measurements, the magnetization starts to decrease at 4.2 K, which is slightly lower than the value obtained in the resistivity measurement.
Figure 3 Needlelike crystals of (MDT-TSF)(AuI2)0.436.
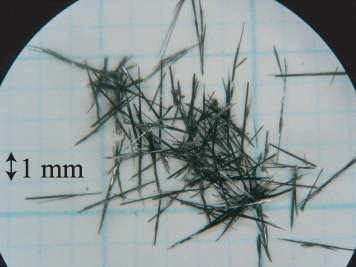
Figure 4 Temperature dependence of resistivity of (MDT-TSF)(AuI2)0.436.
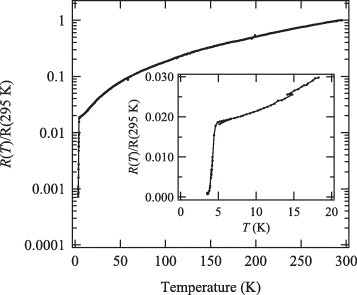
Figure 5 Temperature dependence of the magnetization of (MDT-TSF)(AuI2)0.436 at an applied field of 5 Oe. Filled circles represent zero-field-cooled (ZFC) data and open circles represent field-cooled (FC) data.
MDT-TSF radical salts with other linear anions
As will be mentioned in the following sections in detail, the characteristic features that differentiate the present MDT-TSF-AuI2 from ‘ordinary’ molecular superconductors are twofold, i.e. its crystal and electronic structures. In sharp contrast to the conventional molecular superconductors with dimeric donor structure, MDT-TSF-AuI2 consists of uniform donor stacks. Furthermore, the periodicity of the donor stacks is different from that of the anion lattice, resulting in an incommensurate structure with a noninteger donor:anion ratio of 1 : 0.436 [for this reason the salt is expressed as (MDT-TSF)(AuI2)0.436]; this ratio is unique among molecular superconductors, where the conventional ratio is 2 : 1 [Citation28].
For the development of such unique organic superconductors, it is important to determine whether the structural features of (MDT-TSF)(AuI2)0.436 are limited to this particular combination. From this standpoint, other MDT-TSF salts with various linear anions were synthesized, and it was found that combinations of MDT-TSF and trihalide anions such as I3− and I2Br− afford similar superconducting salts with incommensurate structures (figure and table 1) [Citation29].
Figure 6 Temperature dependence of resistivity of trihalide salts of MDT-TSF. The materials are distinguished by the X part (I3, I2Br, IBr2 and I2.9Cl0.1) of the supporting electrolyte (n-Bu4N)X used in the electrocrystallization.
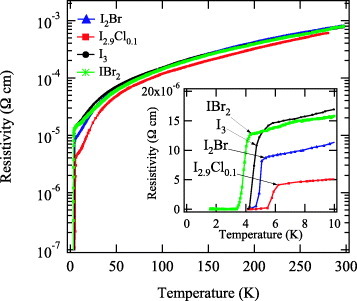
Table 1 Chemical composition, room temperature conductivity σrt, charge transfer degree ρ and superconducting transition temperature Tc of the incommensurate superconductors based on MDT-TSF and its related donors [Citation11, Citation28–34].
Related methylenedichalcogenotetrachalcogenafulvalenes
It was unclear whether only MDT-TSF could allow the formation of such unique incommensurate superconductors or if related electron donors could also do so. In this regard, it was already reported that MDT-TTF, i.e. an all-sulfur analogue of MDT-TSF, yielded a superconducting AuI2 salt, κ-(MDT-TTF)2AuI2 [Citation19, Citation20], but its crystal and electronic structures differ from those of (MDT-TSF)(AuI2)0.436. In addition, an all-selenium analogue of MDT-TSF, namely, MDSe-TSF [methylenediseleno-tetraselenafulvalene, figure (c)] yielded a superconducting bromine salt with a Tc of 4 K [Citation35], whereas its crystal structure was again classified as κ-type. The other related donors then focused on were two isomeric methylenedithio-diselenadithiafulvalenes [MDT-TS and MDT-ST, figure (c)].
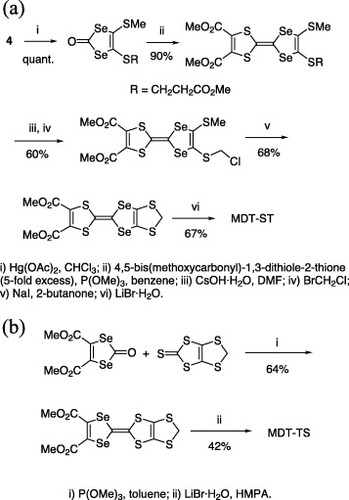
Although MDT-TS has been known since 1988 when Papavassiliou et al [Citation36] reported the donor in a conference proceedings, the isomeric donor MDT-ST has not been described at all. Taking advantage of new intermediate 4 and the synthesis methodologies developed for the synthesis of MDT-TSF, we successfully synthesized MDT-ST (figure (a)) [Citation30]. By contrast, the reported procedure for the synthesis of MDT-TS was not reproducible, and thus, a modified synthesis of MDT-TS was examined, which gave better results (figure (b)) [Citation31].
Figure 7 Syntheses of (a) MDT-ST and (b) MDT-TS.
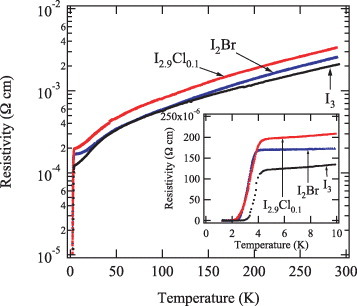
Electrocrystallizations of the donors with linear anions gave radical cation salts with the incommensurate anion structure (table 1). All three salts of MDT-ST were found to be superconducting under ambient pressure with Tc values slightly lower than those of MDT-TSF salts (figure ) [Citation30], whereas the conducting behavior of the AuI2 salt of MDT-TS was strikingly different from those of the other salts listed in table 1; the salt showed a resistivity minimum at Tρ=85 K and metal–insulator transition at TMI=50 K. Application of hydrostatic pressure (1.14 GPa), on the other hand, induced a superconducting transition at the onset Tc=4.7 K (midpoint Tc=4.0 K; see section 5 for details) [Citation31, Citation34].
Figure 8 Temperature dependence of resistivity of MDT-ST salts. The materials are distinguished by the X part (I3, I2Br and I2.9Cl0.1) of the supporting electrolyte (n-Bu4N)X used in the electrocrystallization.
The difference in the conducting behavior of the MDT-TS salts from those of the MDT-TSF and MDT-ST salts can be explained by considering that the intermolecular overlaps in the MDT-TS salt are insufficient to retain the metallic state to low temperature. In particular, the intermolecular overlaps between the donor stacks depend on the position of selenium atoms, as can be seen from the general molecular arrangement in the bc plane (figure ); it is highly likely that the introduction of selenium atoms in the central 1,3-dichalcogenole ring is crucial for stabilizing the metallic state.
Figure 9 General molecular arrangement in the incommensurate superconductors based on MDT-TSF, MDT-ST and MDT-TS. (a) Crystal structure projected along the molecular long axis and (b) projection onto the bc plane. Note that the inter-stack interaction through the central 1,3-dichalcogenole rings is most effective.
Summary
With the successful synthesis of MDT-TSF and the discovery of the first superconducting AuI2 salt as a starting point, a series of organic superconductors with an incommensurate anion lattice based on MDT-TSF and its related donors have been discovered. The present series of ‘incommensurate’ superconductors may raise several intriguing points that should be addressed, including the effects of incommensurate anion potential on the donor lattice, Tc depending on the degree of charge transfer, and chemical pressure effects caused by different chalcogene atoms in the same molecular framework. Some of these will be discussed in the following sections.
Incommensurate lattice and charge transfer degree
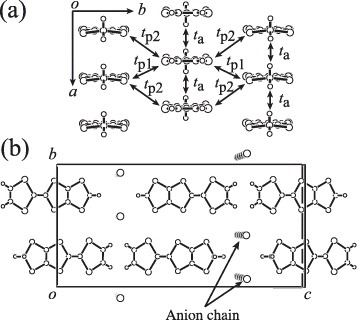
The x-ray crystal structure analysis of the AuI2 salt of the MDT-TSF has been performed [Citation11]. The space group is Pnma, and the lattice parameters are listed in table 2. The AuI2 salt has a uniform donor stacking with a head-to-head mode along the a-axis, and there is no disorder (figure (a)). The donors form a conducting sheet on the ab plane. It is characteristic of this crystal structure that, in contrast to other layered organic superconductors, the donor molecules form a corrugated sheet structure with direct donor–donor interactions along the c-axis (figure (b)). Although the linear anion AuI2− runs along the a-axis, the length of the a-axis is shorter than that of the AuI2− [Citation11]. These structural features are common to all MDT-TSF series conductors with linear anions.
Table 2 Experimentally determined charge transfer degrees ρ, superconducting transition temperatures Tc and lattice parameters [Citation11, Citation28–33, Citation37].
Figure is an x-ray oscillation photograph of (MDT-TSF)(AuI2)0.436, in which the vertical direction is parallel to the donor stacking axis (a∗-axis) [Citation28]. This photograph shows clear incommensurate layer lines at a/d=0.436, 1.321 and 1.762 reciprocal lattice units based on the donor subcell. All these layer lines are composed of well-defined spots even at room temperature, indicating the three-dimensional order of the anion molecules. The layer lines at a/d=0.436, 1.321 and 1.762 respectively correspond to h′=1, 3 and 4 lines of the subcell constant a′ =9.221 Å. Hereafter, we represent the donor and anion lattices as indices h and h′, respectively. The lattice constant of the anion cell is in agreement with the length of the AuI2− anion. The h′=2 line is not clearly observed despite the clear h′=3 line, because the latter (d=3.04 Å) comes from the average bond length of Au–I. The clear spots at h′=1 indicate that the anion structure is not a random infinite chain composed of Au and I, but has a discrete unit of I–Au–I.
Figure 10 X-ray oscillation photograph of (MDT-TSF)(AuI2)0.436 along the a∗-axis at room temperature.
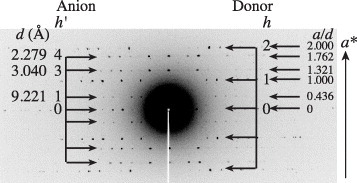
We consider that the b and c axes are common to both the donor and anion lattices. The ratio of a to a′ unambiguously determines the AuI2 content to be x=a/a′=0.436, namely, (MDT-TSF)(AuI2)0.436. The present compound has the same interlattice matrix as that expressed in equation (Equation2) with 1/σ11=0.436. This composition is consistent with the results of both energy dispersion spectroscopy (1 : 0.434) and elemental analysis (1 : 0.44). Although the closest integer ratio of donor to anion is 9 : 4 (1 : 0.444), this seems to exceed the error of the x-ray investigation. Therefore, we have to conclude an incommensurate composition, (MDT-TSF)(AuI2)0.436 on the basis of these three experiments.
The MDT-TSF series superconductors presented in this review have the same interlattice matrix type as that expressed in equation (Equation2), in which only the diagonal elements of
are not zero. By contrast, the interlattice matrix of κ-(ET)4Hg2.89Br8 is defined as the translation from the lattice of ET and Br to the lattice of Hg [Citation38]. The matrix is not as simple as that of the MDT-TSF series salts, i.e. σ12=σ21=σ23=σ31=σ32=0.
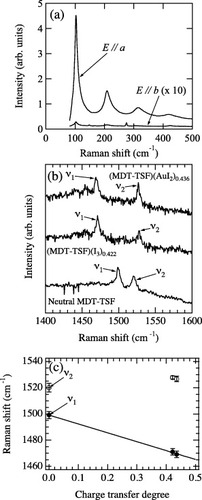
The x-ray oscillation photograph of (MDT-TSF)(I3)0.422 does not show the h′=1 line, indicating that the I3− unit is not definite [Citation29]. It is well known that iodide exists in the forms of I−, I2, I3− and I5− in solids, and the Raman spectrum can be used to determine the state of iodide [Citation39]. Figure (a) shows the Raman spectra of (MDT-TSF)(I3)0.422 at room temperature [Citation32]. The a-parallel spectrum consists of the 104 cm−1 peak and its overtones, which is known as the symmetric stretching mode of I3− in an infinite linear chain [Citation39, Citation40]. This demonstrates that the anion is a polyiodide chain composed of I3− units, which differs from a discrete I3−. By contrast, the b-parallel spectrum shows no Raman line originating from the iodide anion. These observations indicate the existence of the iodide chain running along the a-axis.
Figure 11 (a) Raman spectra of (MDT-TSF)(I3)0.422 and (b) Raman spectra of MDT-TSF salts and neutral MDT-TSF. (c) Charge-transfer degree dependence of the Raman shifts of MDT-TSF salts.
For (MDT-ST)(I3)0.417, the h′=2 line of the I3− anion lattice has been observed in the x-ray oscillation photograph [Citation33]. The interlattice matrix is the diagonal type with 1/σ11=0.417 and σ22=σ33=1. The a-parallel Raman spectrum of this salt also shows the symmetric stretching mode of I3− in an infinite linear chain [Citation33].
The obtained charge transfer degree of (MDT-TSF)(I3)0.422, ρ=0.422, is slightly smaller than that of (MDT-TSF)(AuI2)0.436. This is explained on the basis of the crystal structure and anion length. The a-axis of the donor lattice of the I3 salt, 4.013(4) Å, is almost the same as that of the AuI2 salt, 4.016(6) Å, and the length of I3− (a′=9.507 Å) is greater than that of AuI2− (a′=9.221 Å); this is in agreement with the usual relationship of the anion length between AuI2− and I3− [Citation1]. Consequently, the anion content, 0.422, determined from a/a′ is smaller than that of (MDT-TSF)(AuI2)0.436.
The Raman spectrum is sensitive to the charge on the organic donor or acceptor molecules. The ring C=C stretching mode, which is the C=C stretching mode along the molecular short axis, is Raman-active for the MDT-TSF molecule because of the symmetry of the molecular structure. The neutral MDT-TTF molecule with the same symmetry as MDT-TSF exhibits two strong Raman lines at 1510 and 1551 cm−1; the first line is assigned to the ring C=C bond [Citation41]. This Raman line shifts to 1470 cm−1 for κ-(MDT-TTF)2AuI2. This indicates that the Raman shift decreases by approximately 40 cm−1 for a 0.5 charge transfer degree. The Raman line at 1499 cm−1 labeled as ν1 in the neutral MDT-TSF, which linearly decreases as the charge transfer degree ρ increases, corresponds to the ring C=C bond, and is related to the degree of charge transfer as ν1=1499−67.63ρ, as shown in figures (b) and (c) [Citation32]. Although the linewidths of the present Raman spectra are considerably broad, the shift of ν1 is regarded as the second piece of evidence of the difference in the degree of charge transfer between the AuI2 and I3 salts.
In addition to the I3 salt, IxBry salts have been obtained (table 1). The ratio between iodide and bromine differs from the original composition, I2Br and IBr2; therefore, the anions are in a disordered state. However, all MDT-TSF, MDT-ST and MDT-TS salts with IxBry show superconductivity despite the disordered anions [Citation29, Citation30].
Electronic states of the ambient pressure superconductors: MDT-TSF salts and MDT-ST salts
Energy band calculation
The energy band calculation including an incommensurate anion potential is very complicated because of the use of superspace, and the band structures of only two incommensurate organic conductors, (BO)2.4I3 [Citation42], where BO is bis(ethylenedioxy)tetrathiafulvalene, and (ET)Hg0.776(SCN)2 [Citation43], have been calculated. The incommensurate potential effect on the Fermi surface depends on the materials in these calculations. Although small gaps open at the Fermi surface for (BO)2.4I3, the Fermi surface disappears in a large area for (ET)Hg0.776(SCN)2.
The energy band structure has been calculated on the basis of the atomic coordinates of the donor molecules in the donor cell without the anion lattice potential using the extended Hückel method and the tight binding approximation [Citation44]. The atomic orbital parameter set of Se strongly affects the results of the calculations [Citation45]. The parameter set tuned to BETS salts [Citation46] without both 3d orbitals of S and 4d orbitals of Se has turned out to be suitable for the MDT-TSF series conductors [Citation32, Citation47–49]. The transfer integrals, ti, are estimated from the intermolecular overlap integrals Si as ti=E×Si, in which the energy level of the highest occupied molecular orbital E is taken to be −10 eV. The interaction modes (a, p1 and p2) are defined in figure (a).
The calculated transfer integrals are shown in table 3, and the energy band structure and Fermi surface of (MDT-TSF)(AuI2)0.436 are shown in figure . The energy bands are degenerated on the C line of the zone boundary owing to the donor lattice symmetry (Pnma) [Citation50]. Therefore, the Fermi surface is composed of the overlapping cylinders, and there are two fundamental γ and δ orbits. The cross-sectional area ratios between the fundamental Fermi surface and the first Brillouin zone, AF/ABZ, are also shown in table 3. Although the γ pocket area depends on the transfer integrals ratio, the δ orbit area is equal to the degree of charge transfer and is independent of the transfer integral values.
Figure 12 Energy band structure and Fermi surface of (MDT-TSF)(AuI2)0.436.
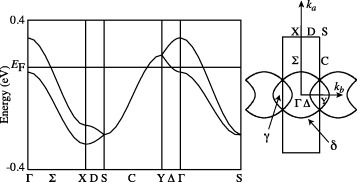
Table 3 Calculated transfer integrals and the cross-sectional area of the fundamental closed orbits, γ and δ orbits, based on the room temperature atomic coordinates [Citation32–34, Citation48].
The polarized optical reflectance is a useful tool for estimating the band parameters for organic conductors [Citation51]. The plasma frequencies obtained from the optical reflectance spectra of (MDT-TSF)(AuI2)0.436 are ωp,a=0.88 eV for the a-axis and ωp, b=0.55 eV for the b-axis [Citation48]. The α-direction plasma frequency is calculated using the following equation derived from the Boltzmann equation [Citation51]:
where n is the carrier number density, e is the elementary electric charge, ∊0 is the vacuum permittivity,
is the Plank constant, E(k) is the energy dispersion and f(E(k)) is the Fermi–Dirac distribution function. The calculated values of ωp, a=0.85 eV and ωp,b=0.61 eV are in good agreement with the experimental estimation. Thus, we have adopted the method to calculate the band structure based on the x-ray crystal structure analysis of the donor lattice.
Incommensurate anion potential effect on the Fermi surface
For many years, the Fermi surface topologies of metals and organic conductors have been studied using techniques such as the de Haas–van Alphen and Shubnikov–de Haas oscillations [Citation3, Citation52, Citation53]. In this respect, the Fermi surface under a superlattice structure is of interest because when a superlattice potential is added to the original lattice, the Brillouin zone is reconstructed in accordance with the new reciprocal lattice. If the periodicity of the superlattice potential is commensurate with the original one, it is easy to define the new Brillouin zone; for instance, the original Brillouin zone is simply halved along the a∗-axis of the reciprocal lattice if the superlattice vector q is a∗/2. However, when the q vector is incommensurate, we cannot generally define the Brillouin zone. Azbel first dealt with this problem within the generalized Kronig–Penny model, and pointed out that the incommensurate periodic potential is a natural intermediate between periodicity and randomness [Citation54]. It creates a devil's stair-type energy spectrum, and then one may expect fine structures in the quantum oscillations.
An incommensurate potential as a modulated structure is introduced on electronic states by density wave formation in various materials. In η-Mo4O11 [Citation55] and NbSe3 [Citation56], for instance, the electronic states are subject to the incommensurate superlattice potential by the charge-density-wave formation. In these materials, the Shubnikov–de Haas oscillations with very low frequencies have been observed below the charge-density-wave transition temperature, which can be ascribed to small closed orbits formed by the Fermi surface reconstruction using the fundamental periodic vector q of the charge-density-wave. In the case of incommensurate composite crystals, Hg3−δAsF6 and Hg3−δSbF6, the results of the de Haas–van Alphen measurements have also been explained on the basis of the Fermi surface reconstruction using the fundamental periodic vector q=a∗(δ,±δ,0) of the incommensurate mercury-chain sublattice [Citation57, Citation58]. The validity of such simple zone-folding procedures, which have been empirically adopted to explain the experimental results in many cases, is not trivial because the obtained energy bands do not meet the translational symmetry of the superlattice or sublattice.
An incommensurate potential effect on the Fermi surface has been investigated using the Shubnikov–de Haas oscillation measurements of the MDT-TSF series superconductors, because the above problem has not been discussed in detail. The Shubnikov–de Haas oscillation of (MDT-TSF)(AuI2)0.436 is shown in figure (a) [Citation47]. The oscillatory part (Shubnikov-de Haas signal) of the resistance is represented by [R(B)−R0(B)]/R0(B), rescaled using the nonoscillatory background R0(B) (figure (b)). Figure (c) shows the fast Fourier transformation spectra obtained in various field regions defined as I–III in figure (b). The fast Fourier transformation spectra show six closed orbits, α, β, γ1, γ2, δ1 and δ2. The angular dependence of the Shubnikov–de Haas frequencies indicates that the Fermi surfaces are cylindrical. The Shubnikov–de Haas signals have been analyzed conventionally using the Lifshitz–Kosevich formula. The obtained Shubnikov–de Haas parameters are summarized in table 4.
Figure 13 (a) Magnetoresistances of (MDT-TSF)(AuI2)0.436, (MDT-TSF)(I3)0.422, and (MDT-ST)(I3)0.417. (b) Shubnikov–de Haas signals. The inset is the high field region. (c) Fast Fourier transformation spectra of the Shubnikov–de Haas oscillations of (MDT-TSF)(AuI2)0.436 in the field regions I–III defined in (b). (d) Fast Fourier transformation spectra of the Shubnikov–de Haas oscillations in (MDT-TSF)(AuI2)0.436, (MDT-TSF)(I3)0.422 and (MDT-ST)(I3)0.417.
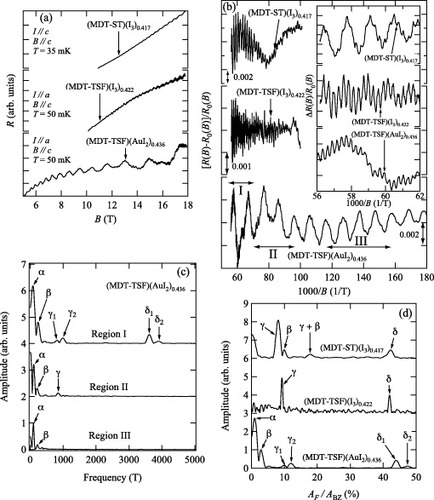
Table 4 Shubnikov–de Haas frequencies, cross-sectional Fermi surface area ratios, effective cyclotron masses and the Dingle temperatures [Citation32, Citation47, Citation49].
The band calculation based on the donor arrangement gives overlapping cylindrical Fermi surfaces (figure ), in which the cross section of the large cylinder is 43.6%, and the small overlapping area is approximately 8.5% of the first Brillouin zone. The observed cross section of the δ1 orbit, AF,δ1/ABZ=43.7%, is in agreement with the large cross section estimated from the band calculation. This number is also equal to the amount of charge transfer coming from the anion content of (MDT-TSF)(AuI2)0.436. The γ orbit is assigned to the 8.5% overlapping area. Although the energy bands are degenerated on the C line owing to the donor lattice symmetry, the incommensurate anion lattice along the a-axis may destroy this symmetry. This broken symmetry makes the δ1 orbit a magnetic breakdown orbit that appears only at high fields.
In figure (c), two close Shubnikov–de Haas frequencies tend to appear as pairs, δ1–δ2 and γ1–γ2 coming from the interlayer transfer integral. From these pairs, the interlayer transfer integral is roughly estimated as t⊥∼2 meV under a parabolic energy band approximation, and the value is consistent with the results (t⊥=1 meV) of the analysis of the resistance peak structure under the magnetic field almost parallel to the conducting sheet in the angular magnetoresistance [Citation48], which is explained on the basis of the Fermi surface warping [Citation59]. The large t⊥ is due to the direct donor–donor interactions coming from the corrugated conducting sheet structure (figure (b)).
Two low-frequency orbits, the α and β orbits, are not explained by the band calculation. This indicates that the incommensurate anion potential reconstructs the Fermi surface. The Fermi surface reconstruction using the fundamental anion periodicity q=0.436a∗, 2q and 3q is shown in figure (a), where we assume the Fermi surface shape to be an ellipse with the overlapping area corresponding to the γ1 orbit. Although the vector q does not make a new pocket, 2q and 3q lead to new overlapping regions. The 3q vector makes two new pockets, which are approximately 3 and 0.3% of the first Brillouin zone. The former is assigned to the β orbit. Although the latter pocket does not exactly agree with the α orbit, the small pocket is considered to be sensitive to the reconstruction. Therefore, the α orbit can be assigned to this smallest pocket. The 2q vector makes a new overlapping area of 25%, but this is too large to be interpreted as the observed α and β orbits. Then, the observed orbits are explained on the basis of the 3q reconstruction of the Fermi surface.
Figure 14 Fermi surfaces reconstructed using q (dash-dotted lines), 2q (dashed lines), and 3q (dotted lines) of (a) (MDT-TSF)(AuI2)0.436 and (b) (MDT-ST)(I3)0.417. The original Fermi surfaces (solid lines) are also represented in both panels. The first Brillouin zone is calculated from the donor cell. The calculated closed area of the AuI2 salt is based on the room temperature atomic coordinates, and that of the I3 salt is based on 18.5 K atomic coordinates.
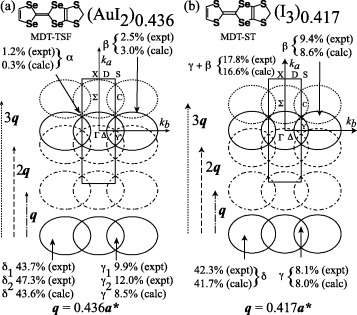
In contrast to the mercury chain compounds explained on the basis of a simple q vector originating in the incommensurate mercury chain, the Fermi surface of the present compound is reconstructed by 3q. This characteristic reconstruction is related to the intensity of the anion sublattice reflections observed in the x-ray oscillation photograph. Although the spots of both q and 3q are clearly observed, the 2q spot is not found in the x-ray photograph (figure ). This is associated with the absence of the 2q reconstruction. The x-ray 3q intensities are even stronger than the q intensities. The q vector comes from the fundamental repeating period of the AuI2 anion, while the 3q potential is strong because this is associated with the average distance of Au–I and I–I. The conduction electrons mainly feel the additional incommensurate potential generated by the interatomic distance of the AuI2 chain.
The fine structure in the quantum oscillations predicted by Azbel has not been observed. The reason is probably as follows: the incommensurate potential is significantly smaller than that made by the donor molecules, and the conduction electrons perturbatively feel the incommensurate potential. In real materials, the magnitudes of various sublattice potentials are different, and only one or a few modulations are usually predominant. The predominant potential makes larger energy gaps in the original bands at the boundaries of the new Brillouin zone than the other higher-order sublattice potentials. In the Shubnikov–de Haas experiments, such small energy gaps formed by the higher-order potentials are not observable because of the magnetic breakdown. This scenario affords the selection rule of the reconstructing vectors. The selection rule is probably validated only when the incommensurate potential is treated perturbatively. The present system provides a very rare case in which the principal potential is not of the fundamental periodicity.
(MDT-ST)(I3)0.417 also has the Fermi surfaces reconstructed by the incommensurate anion potential [Citation49]. The energy band calculation results cannot explain the β and γ+β orbits in figure . The x-ray oscillation photograph of this compound shows that the intensity of the 3q (=3×0.417a∗) spots is even stronger than that of the other nq spots, where n is an integer [Citation33]; the vector 3q is associated with the average distance of I–I in the real space. The selection rule requires that the shift vector of the Fermi surface should be 3q. The observed orbits are explained on the basis of the 3q reconstruction of the Fermi surface, as shown in figure (b). Although two new closed orbits, α and β, appear in the case of (MDT-TSF)(AuI2)0.436 (figure (a)), the α orbit vanishes and the β orbit area becomes larger (8.6% of the first Brillouin zone) than the γ orbit area in the case of (MDT-ST)(I3)0.417 (figure (b)), where we assume the Fermi surface shape of the δ orbit to be an ellipse with the overlapping area corresponding to the γ orbit. These results are closely associated with the difference in the charge transfer degree between (MDT-ST)(I3)0.417 and (MDT-TSF)(AuI2)0.436.
The Shubnikov–de Haas oscillations of (MDT-TSF)(I3)0.422 have also been measured, as shown in figure [Citation32]. The observed δ orbit is in agreement with the charge transfer from the anion content 0.422, and this value is the third piece of evidence that the charge transfer degree is slightly smaller than that of (MDT-TSF)(AuI2)0.436 as shown in figure (d). The selection rule requires that the Fermi surface is reconstructed by 3q=3×0.422a∗ on the basis of the x-ray oscillation photograph, and the new closed orbit, β orbit with F∼520 T, should be observed. However, the fast Fourier transformation spectrum does not show such an extra orbit. This indicates that the interaction between the donor molecules and the incommensurate anion potential is extremely small, and the conduction electrons do not perturbatively feel the incommensurate potential.
Staggered warping Fermi surface of (MDT-ST)(I3)0.417
The angular magnetoresistance oscillation of (MDT-ST) (I3)0.417 is shown in figure (a) [Citation49]. The field orientation is defined using a tilt angle θ and an azimuthal angle φ in the inset of figure (a). Although the usual shape of angular magnetoresistance oscillations has a minimum at θ=0° in a quasi-two-dimensional system, the present data have a broad peak at θ=0°, whose magnitude increases with increasing |φ|. This peak is not observed in (MDT-TSF)(AuI2)0.436 with similar Fermi surfaces [Citation48].
Figure 15 (a) Angular magnetoresistance oscillations of (MDT-ST)(I3)0.417. (b) p-type staggered warping Fermi surface. The magnitude of the kc-axis warping has been increased to emphasize the corrugation shape.
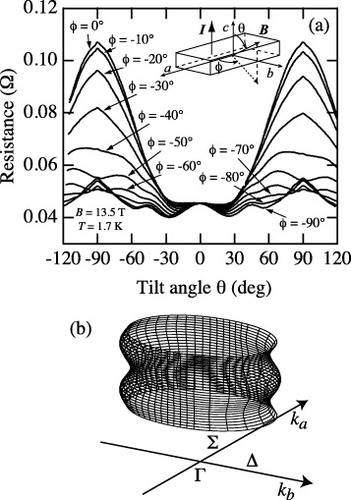
Yagi and Iye have demonstrated that the θ=0° peak appears when the Fermi surface has p-type or dxy-type staggered warping [Citation60]. The angular magnetoresistance oscillation for p-type corrugation has a twofold symmetry with respect to the azimuthal angle φ, whereas dxy-type corrugation gives a fourfold symmetrical angular magnetoresistance oscillation. Moreover, they have pointed out that the θ=0° peak intensity decreases with decreasing |φ| for p-type corrugation. The observed angular magnetoresistance oscillation of the present compound in figure (a) meets the requirements of p-type corrugation. All Fermi surfaces are made on the basis of the zone folding of the single energy band corresponding to the δ orbit. Therefore, it is reasonable to assume that the energy band of the δ orbit has p-type energy dispersion. The energy dispersion relation of the corrugated cylindrical Fermi surface is generally
where mi is the effective mass along the ki direction, d⊥ is the effective interlayer spacing (d⊥=c/2=12.643(2) Å at 18.5 K [Citation33]), and t⊥(φ) is the interlayer transfer integral depending on the azimuthal angle φ. For p-type warping, t⊥(φ) is described as
where tc is the constant transfer integral along the kc direction [Citation60]. This formula demonstrates that the interlayer transfer integral is zero on the Σ-line in the first Brillouin zone, as shown in figure (b), for the fundamental Fermi surface, the δ orbit. Therefore, the field inclination at φ=0° is least affected by the p-type corrugation of the Fermi surface, and hence, the θ=0° peak is minimized at this special φ. The θ=0° peak is also observed for the high-Tc cuprate superconductor Tl2Ba2CuO6+δ; the feature is explained in terms of a higher-order corrugation with a fourfold symmetry in the fundamental Fermi surface [Citation61].
Superconductivity
The superconducting properties of (MDT-TSF)(AuI2)0.436, (MDT-TSF)(I3)0.422, and (MDT-ST)(I3)0.417 have been investigated using magnetoresistance measurements [Citation28, Citation32, Citation62]. For example, the upper critical fields, Bc2, of (MDT-TSF)(I3)0.422 are shown in figure (a). The Ginzburg–Landau coherence lengths, ξ‖a, ξ‖b, and ξ‖c, estimated from Bc2‖i(T)=Φ0/[2πξ‖j(T)ξ‖k(T)], where Φ0 is the flux quantum, are listed in table 5. The in-plane coherence lengths, ξ‖a and ξ‖b, are much shorter than the cyclotron radius of the δ-orbit (0.15 μm at 14 T for (MDT-TSF)(I3)0.422) estimated from the Shubnikov–de Haas oscillations. Therefore, these compounds are clean-limit superconductors. The transverse coherence length [ξ‖c as shown in figure (b)] is greater than the thickness of the conducting sheet c/2∼12.8 Å, indicating that the superconductivity is three-dimensional (3D).
Figure 16 Temperature dependence of the (a) upper critical fields and (b) Ginzburg–Landau coherence lengths. (c) Angular dependence of the upper critical field. The solid and dotted lines represent the results of calculations based on the anisotropic 3D model and 2D model, respectively. The inset in (c) is the low-angle region. The material for all panels is (MDT-TSF)(I3)0.422.
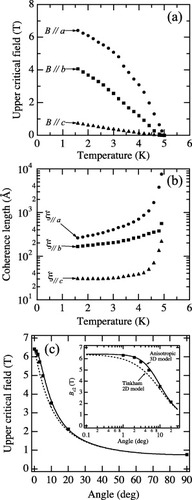
Table 5 Charge transfer degree ρ, superconducting transition temperature Tc, calculated density of states at the Fermi level N(EF), effective cyclotron mass ratio m∗/m0, calculated cyclotron mass ratio mc/m0, ratio between the effective and calculated cyclotron masses m∗/mc, and Ginzburg–Landau coherence length at 1.6 K (ξ‖a, ξ‖b, and ξ‖c) [Citation28, Citation32, Citation47, Citation49, Citation62]. The total density of states N(EF) is given in units of (total states) eV−1 (donor molecule)−1.
The field angle dependence of the upper critical field depends on the superconducting dimensionality. For anisotropic 3D superconductors, the field angle dependence of the upper critical field is
where θ is the angle of the field from the conducting plane (‖ab-plane) [Citation63]. The observed upper critical fields of (MDT-TSF)(I3)0.422 are well reproduced using the anisotropic 3D model (figure (c)). Anisotropic 3D superconductivity is characteristic of the MDT-TSF and MDT-ST superconductors and is due to the direct donor–donor interactions coming from the corrugated conducting sheet structure (figure (b)).
A thermodynamic study has been performed for (MDT-TSF)(AuI2)0.436 [Citation64]. The electronic heat capacity coefficients have been determined; γ∗ for the superconducting state and γN for the normal state are 6 and 9 mJ K−2 mol−1, respectively. Although the thermodynamic Tc is 3.0 K and the present compound is a bulk superconductor, the superconducting transition is broad despite the sharp transition in the transport measurements.
The superconducting transition temperature of (MDT-TSF)(I3)0.422 is slightly higher than that of (MDT-TSF)(AuI2)0.436. For the Bardeen–Cooper–Schrieffer-type superconductors, the larger density of states and Debye temperature give the higher Tc. As shown in table 5, however, the calculated density of states, N(EF), of the I3 salt is smaller than that of the AuI2 salt, in disagreement with the Bardeen–Cooper–Schrieffer formula.
Although the cross-sectional area of the Fermi surface of the I3 salt is smaller than that of the AuI2 salt, the effective cyclotron masses of the γ and δ orbits estimated from the Shubnikov–de Haas oscillations of the I3 salt are heavier than those of the AuI2 salt, as shown in table 5. In κ-(ET)2Cu(NCS)2 and α-(ET)2NH4Hg(SCN)4, the Shubnikov–de Haas oscillations under high pressure show that the higher Tc state has the heavier effective cyclotron mass [Citation65, Citation66].
The bare cyclotron mass, mc, is associated with the cyclotron frequency, ωc, by
This mass involves an average of the dispersion relation along the periodic orbit. Equation (Equation7
) can be rearranged to give
where AF(EF) is the cross-sectional area of the closed Fermi surface defined using the circuit of the carrier motion in the presence of a magnetic field B [Citation67]. The effective cyclotron mass, m∗, obtained from the quantum oscillations includes not only the band dispersion but also all interactions, i.e. electron–phonon and electron–electron interactions. Therefore, we have written the observed effective cyclotron mass as m∗ to distinguish the bare cyclotron mass mc. The effective cyclotron mass of the quasiparticle is expressed as
where λep is an electron–phonon interaction and λee is an electron–electron interaction. Therefore, the ratio m∗/mc denotes the magnitude of the interactions. We can estimate the ratio between the effective cyclotron mass determined using the Shubnikov–de Haas oscillations and the bare cyclotron mass estimated using equation (Equation8
) from the band calculation [Citation68, Citation69]. The calculated results, mc/m0 and m∗/mc, are also listed in table 5 [Citation32]. The obtained m∗/mc increases with increasing Tc. This tendency shows us that the mass enhancement, i.e. the strong many-body effect, is the major factor that increases Tc. A similar relation has been found between Tc and m∗/mc for other organic superconductors, κ-(ET)2X and κ-(BETS)2X [Citation69].
Metal–insulator transition and superconductivity of (MDT-TS)(AuI2)0.441
The noninteger composition, (MDT-TS)(AuI2)0.441, has been determined from the ratio of the donor lattice (a=3.992(3) Å) to the anion lattice (a′=9.045(6) Å) as a/a′=0.4413(3) [Citation31]. This compound shows a metal–insulator transition at low temperatures. Owing to the sulfur substitution, the total bandwidth, W, of (MDT-TS)(AuI2)0.441 is 26% smaller than that of (MDT-ST)(I3)0.417 [Citation34]. Therefore, the electronic correlation of the MDT-TS salt is the strongest among the MDT-TSF series conductors. The calculated Fermi surface of (MDT-TS)(AuI2)0.441 is, however, a 2D one, not markedly different from the superconducting selenium analogs.
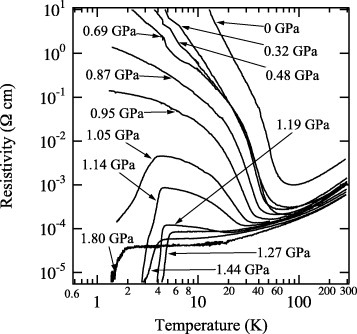
The resistivities under various pressures are shown in figure [Citation34, Citation37]. At ambient pressure, the resistivity decreases with decreasing temperature and increases below Tρ=85 K, where d(lnR)/d(1/T) is zero at Tρ. The metal–insulator transition temperature, TMI, is determined from the peak of d(lnR)/d(1/T) as TMI=50 K at ambient pressure. Tρ and TMI shift to lower temperatures as the pressure increases, and the superconducting phase appears above Pc=1.05 GPa below onset Tc=4.3 K (midpoint Tc=3.2 K). The resistance peak observed above 1.05 GPa corresponds to the superconducting onset Tc. The resistance peak is suppressed with increasing pressure, and Tc increases with increasing pressure. At 1.27 GPa, the resistance peak vanishes and the normal Fermi-liquid-like behavior appears. The maximum midpoint (onset) Tc is 4.9 K (6.2 K) at 1.27 GPa, and Tc decreases with dTc/dP∼−6 K GPa−1 above this pressure value.
Figure 17 Temperature dependence of the resistivity under various pressures.
The uniaxial strain effects of the present compound have been investigated [Citation70]. The superconducting state appears under uniaxial strains in all directions. The superconducting critical pressure decreases in the order of Pc, ‖a>Pc,‖b>Pc, ‖c, and these are larger than the critical value of the hydrostatic pressure.
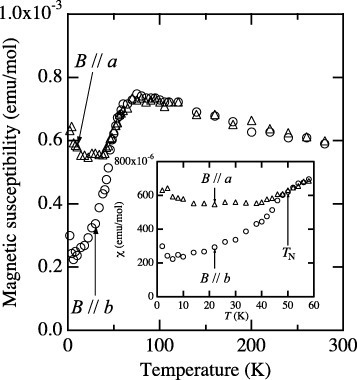
Figure shows the static magnetic susceptibility (χa and χb), where we define 1 mol as (MDT-TS)2.27(AuI2) [Citation34]. Despite the decreasing resistivity at high temperatures, the spin susceptibility gradually increases with decreasing temperature, indicating a strongly correlated state. To the best of our knowledge, there is no organic conductor showing decreasing resistivity together with increasing susceptibility. Both χa and χb have a broad peak at 75 K, and decrease below this temperature. The magnetic susceptibility shows anisotropic behavior below the antiferromagnetic transition at TN=50 K. This temperature agrees with the metal–insulator transition temperature, TMI, observed in the resistivity. The easy axis corresponds to the crystallographic b-axis. The temperature at which the susceptibility has a peak is close to Tρ, suggesting that the resistivity minimum is potentially associated with the magnetic fluctuations above TMI.
Figure 18 Temperature dependence of the static magnetic susceptibilities. The inset shows the data in the low-temperature region.
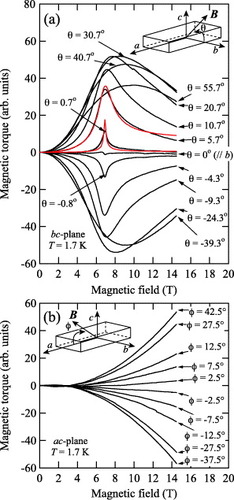
The antiferromagnetism has been confirmed from the results of the magnetic torque measurements, as shown in figures (a) and (b) [Citation37]. The magnetic torque curves have a peak at 6.9 T under |θ|=0.7° in the bc-plane (figure (a)), coming from the spin–flop transition from the low-field antiferromagnetic state to the high-field canted antiferromagnetic state. By contrast, the magnetic torque curves do not show peak structure in the ac-plane (figure (b)), indicating that the ground state is a uniaxial antiferromagnetic ordered state with the easy axis parallel to the b-axis. The present compound does not show a clear signal above the spin–flop field owing to the transition from the canted antiferromagnetic state to the field-induced ferromagnetic state up to 14.5 T.
Figure 19 Magnetic torque curves of (MDT-TS)(AuI2)0.441 at 1.7 K under various magnetic field directions of θ and φ, which are the angles tilted (a) from b to c and (b) from a to c axes, respectively. The red lines in (a) are the fitted results.
The magnetic torque, τ, for a uniaxial antiferromagnet is expressed as
where χ‖ and χ⊥ are the spin susceptibilities parallel and perpendicular to the easy axis, respectively, θ is the angle between the applied field and the easy axis, Bsf is the spin–flop field, μ0 is the vacuum magnetic permeability, and Ku is the anisotropy energy [Citation71, Citation72]. The spin–flop field, Bsf=6.9 T, is obtained by fitting with these equations. The anisotropy energy is estimated as Ku=1.4×10⁻¹ J mol−1 under χ‖=0 and χ⊥=6.0×10⁻⁴ emu mol−1. The peak structure of the magnetic torque curve vanishes at 52 K, in agreement with TN=50 K defined from the anisotropic behavior of the spin susceptibility.
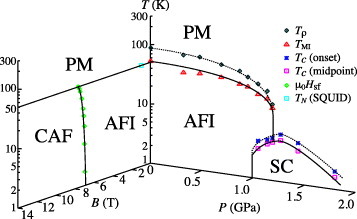
Figure shows the temperature–pressure–magnetic field phase diagram of (MDT-TS)(AuI2)0.441 based on the transport and magnetic measurements [Citation37]. This is similar to the phase diagram of (TM)2X [Citation73] and that of κ-(ET)2X [Citation74], where TM is the general abbreviation for tetramethyltetrathiafulvalene (TMTTF) and TMTSF. It seems that the superconducting phase exists under the insulating phase at approximately 1.1 GPa in figure . This relationship between the superconducting and insulating phases is the same as those of κ-(ET)2Cu[N(CN)2]Cl [Citation75], β′-(ET)2ICl2 [Citation76], and (TMTSF)2AsF6 [Citation77].
Figure 20 Phase diagram of (MDT-TS)(AuI2)0.441 (PM: paramagnetic metal, AFI: antiferromagnetic insulator, SC: superconductor, CAF: canted antiferromagnetic state). The solid and dotted lines are guides for the eye.
The magnetic insulating state below TN=50 K is not a simple antiferromagnetic state with alternate spins like β′-(ET)2ICl2, as shown in figure (a), because each molecule or dimer does not have one carrier. In this sense, the insulating state is regarded as a kind of spin-density-wave state. In contrast to (TM)2X, however, the electronic state of the present compound is two-dimensional, and the Fermi surface does not nest. This new electronic state is simply understood by assuming a localized state that is incommensurate to the donor sites. One of the possible carrier and spin arrangements is shown in figure (b), where the unit of 2.27 (=1/0.441) donor molecules has one carrier and spin; this is commensurate to the anion lattice [Citation34].
Figure 21 Model of spin arrangements for (a) β′-(ET)2ICl2 and (b) (MDT-TS)(AuI2)0.441. Dotted circles in (a) represent dimers.
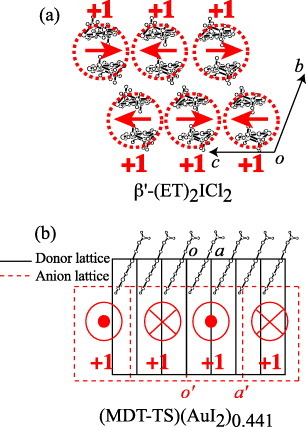
Yoshioka et al [Citation78] have shown the possibility of the metal–insulator transition in organic conductors with noninteger carrier number based on the one-dimensional extended Hubbard model, where donor carriers slightly deviate from 3/4-filling, under an incommensurate periodic potential from anions. They have pointed out that the incommensurate Mott insulator can be generated using the anion potential and the ratio between the on-site Coulomb repulsion and the nearest-neighbor transfer integral without the nearest-neighbor Coulomb repulsion. Seo et al [Citation79] have found an antiferromagnetic insulating state as a mean-field solution in the two-dimensional model for (MDT-TS)(AuI2)0.441. The solution shows that the charge disproportionation occurs owing to the incommensurate anion potential, and the period of the spin arrangement matches the anion periodicity. They note that the present insulating state should be distinguished from the charge ordering observed in 3/4-filled systems, which is accompanied with symmetry breaking in the charge degree of freedom. In their results, the charge disproportionation occurs even in the paramagnetic metallic state owing to the incommensurate anion potential, and the metal–insulator transition has no symmetry breaking in the charge degree of freedom.
Table 6 lists the characteristic parameters of (MDT-TS)(AuI2)0.441 [Citation37], β′-(ET)2ICl2 [Citation76, Citation80] (TMTSF)2AsF6 [Citation77, Citation81] and (TMTTF)2Br [Citation82, Citation83]. The latter three compounds show three types of antiferromagnetic ordered states, antiferromagnetic Mott insulating state, incommensurate spin-density-wave state and commensurate spin-density-wave state. The TMTSF and TMTTF salts have almost the same antiferromagnetic parameters and superconducting transition temperatures. By contrast, β′-(ET)2ICl2 has much larger parameters than (TM)2X. This indicates some relationship between the antiferromagnetic parameters and Tc. Although all antiferromagnetic parameters of (MDT-TS)(AuI2)0.441 are much larger than those of the other compounds listed in table 6, the highest Tc is much lower than that of β′-(ET)2ICl2.
Table 6 Néel temperature TN, spin–flop field Bsf, anisotropy energy Ku, maximum midpoint superconducting transition temperature Tcmax under pressure P, energy band filling, and ground state (AFI: antiferromagnetic insulator; AF Mott: antiferromagnetic Mott insulator; IC-SDW: incommensurate spin-density-wave state; C-SDW: commensurate spin-density-wave state) for (MDT-TS)(AuI2)0.441 [Citation37], β′-(ET)2ICl2 [Citation76, Citation80], (TMTSF)2AsF6 [Citation77, Citation81], and (TMTTF)2Br [Citation82, Citation83].
There are two important differences between the MDT-TS and β′-ET superconductors listed in table 6. The first one is the energy band filling. The β′-ET salt has an effective half-filled band because of its strong dimerized structure. By contrast, the band filling of the MDT-TS salt is 0.7794(2). The electronic correlation of the β′-ET salt should be stronger than that of the MDT-TS salt. In the layered organic superconductors, the κ-type ET superconductors and MDT-TSF ones show that the strength of the many-body effect is the major determinant of Tc [Citation32, Citation69]. Therefore, the difference in the band filling is a possible reason for the difference in Tc. The second point is the incommensurate anion potential. The relationship between the incommensurate potential and the appearance of the superconducting phase is unknown. However, the present results suggest that the incommensurate potential suppresses the superconducting phase.
Summary and outlook
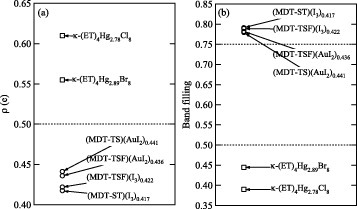
The charge transfer degree, ρ, of the incommensurate organic superconductors is shown in figure (a). The present values of ρ of κ-(ET)4Hg3−δX8 are calculated by assuming (Hg2+)3−δ(X−)8. Although ρ of the MDT-TSF series salts is smaller than 0.5 of the usual D2A salts, ρ of κ-(ET)4Hg3−δX8 is larger than 0.5. The κ-type arrangement has a strong dimerized structure, then κ-(ET)4Hg3−δX8 has a nearly effective half-filled band system, i.e. the doped Mott insulator. By contrast, the MDT-TSF series salts have a nearly 3/4-filled band system, as shown in figure (b).
Figure 22 Charge transfer degree (a) and effective energy band filling (b) of the incommensurate organic superconductors.
Many physical properties of κ-(ET)4Hg3−δX8 have been reported [Citation38, Citation84–91. The thermodynamic superconducting transition of κ-(ET)4Hg2.89Br8 is broad, similar to that of (MDT-TSF)(AuI2)0.436, which suggests that the broad phase transition is characteristic behavior of the incommensurate superconductors [Citation89]. High-pressure resistance measurements of κ-(ET)4Hg3−δX8 show the pressure-induced insulating phase at low temperature above 3.0 GPa for the X=Br salt [Citation86] and 5.0 GPa for the X=Cl salt [Citation91]. However, it is not clear whether this insulating phase originated in the incommensurate potential. In this regard, a resistance measurement under extremely high pressure should be carried out for the MDT-TSF series superconductors. By contrast, the Fermi surface reconstruction observed for both (MDT-TSF)(AuI2)0.436 and (MDT-ST)(I3)0.417 is a clear new phenomenon certainly caused by the incommensurate lattice potential.
The mechanism of the metal–insulator transition of (MDT-TS)(AuI2)0.441 is important, because there is a possibility of a new type of insulating state, i.e. the incommensurate Mott insulator. The present experimental results do not provide any information on the microscopic magnetic structure, i.e. the periodicity of the spin arrangement. Therefore, the mechanism of the metal–insulator transition of the present compound is unclear. Neutron diffraction, x-ray magnetic diffraction, and NMR measurements are potential tools to clarify the mechanism.
Recently, nonlinear transport properties have been investigated for an incommensurate organic conductor (MDT-TS)I0.85Br0.41, and this compound shows current oscillations under dc voltage, the thyristor effect, in the antiferromagnetic insulating phase [Citation92]. By contrast, an inorganic compound, Ba2NaNb5O15, called BSN, shows self-generated voltage oscillations under dc current below 873 K, and this oscillation becomes chaotic at approximately 773 K [Citation93, Citation94]. The voltage oscillation phenomenon does not appear in the structural-incommensurate phase (ferroelastic and ferroelectric) existing below the ferroelastic phase transition temperature TI∼573 K. Therefore, the role of the incommensurate potential is unclear in the organic thyristor.
The MDT-TSF series superconductors have extended the frontier of incommensurate composite crystals among organic superconductors. We hope that new physical phenomena based on the incommensurate potential will be discovered.
Acknowledgments
We are grateful to the coauthors of our own works cited in the references, particularly Professors T Mori, T Otsubo and Dr S Uji for valuable discussion in our collaborative studies, and for many valuable comments on this review.
References
- WilliamsJ MFerraroJ RThornR JCarlsonK DGeiserUWangH HKiniA MWhangboM-H 1992 Organic Superconductors (Including Fullerenes) Englewood Cliffs, NJ Prentice-Hall
- IshiguroTYamajiKSaitoG 1998 Organic Superconductors 2nd edn Berlin Springer
- ToyotaNLangMMüllerJ 2007 Low-Dimensional Molecular Metals Berlin Springer
- KumaiRAsamitsuATokuraY 1998 J. Am. Chem. Soc. 120 8263 http://dx.doi.org/10.1021/ja9816178
- KatsuharaMKimuraSMoriTMisakiYTanakaK 2002 Chem. Mater. 14 458 http://dx.doi.org/10.1021/cm010808y
- MoriHKamiyaMHaemoriMSuzukiHTanakaSNishioYKajitaKMoriyamaH 2002 J. Am. Chem. Soc. 124 1251 http://dx.doi.org/10.1021/ja010567v
- YamamotoH MKatoR 2000 Chem. Lett. 29 970 http://dx.doi.org/10.1246/cl.2000.970
- MoriT 2004 Chem. Rev. 104 4947 http://dx.doi.org/10.1021/cr030660x
- LyubovskayaR NLyubovskii˘R BShibaevaR PAldoshinaM ZGol'denbergL MRozenbergL PKhidekel'M LShul'pyakovY F 1985 JETP Lett. 42 468
- LyubovskayaR NZhilyaevaE IPesotskii˘S ILyubovskii˘R BAtovmyanL OD'yachenkoO ATakhirovT G 1987 JETP Lett. 46 188
- TakimiyaKKataokaYAsoYOtsuboTFukuokaHYamanakaS 2001 Angew. Chem., Int. Ed. Engl. 40 1122 http://dx.doi.org/10.1002/1521-3773(20010316)40:6<1122::AID-ANIE11220>3.0.CO;2-V
- CumminsH Z 1990 Phys. Rep. 185 211 http://dx.doi.org/10.1016/0370-1573(90)90058-A
- van SmaalenS 2007 Incommensurate Crystallography New York Oxford University Press
- PetricekVMalyKCoppensPBuXCisarovaIFrost-JensenA 1991 Acta Crystallogr. A 47 210 http://dx.doi.org/10.1107/S0108767390012065
- SchukatGFanghänelE 1996 Sulfur Rep. 18 1 http://dx.doi.org/10.1080/01961779608047896
- OguraFTakimiyaK 1999 in Organoselenium Chemistry T GBack Oxford Oxford University Press p 257
- JéromeDMazaudARibaultMBechgaardK 1980 J. Physique Lett. 41 L95 http://dx.doi.org/10.1051/jphyslet:0198000410409500
- KobayashiHKobayashiACassouxP 2000 Chem. Soc. Rev. 29 325 http://dx.doi.org/10.1039/b002095h
- PapavassiliouG CMousdisG AZambounisJ STerzisAHountasAHiltiBMayerC WPfeifferJ 1988 Synth. Met. 27 B379 http://dx.doi.org/10.1016/0379-6779(88)90172-5
- KiniA M et al 1989 Solid State Commun. 69 503 http://dx.doi.org/10.1016/0038-1098(89)90229-9
- MorikamiATakimiyaKAsoYOtsuboT 1999 Org. Lett. 1 23 http://dx.doi.org/10.1021/ol990505y
- TakimiyaKMorikamiAOtsuboT 1997 Synlett 1997 319 http://dx.doi.org/10.1055/s-1997-787
- JigamiTTakimiyaKOtsuboTAsoY 1998 J. Org. Chem. 63 8865 http://dx.doi.org/10.1021/jo981024f
- TakimiyaKOharudaAMorikamiAAsoYOtsuboT 2000 Eur. J. Org. Chem. 2000 3013 http://dx.doi.org/10.1002/1099-0690(200009)2000:17\langle3013::AID-EJOC3013\rangle3.0.CO;2-\#
- BrandsmaLWijersH EJonkerM C 1963 Rec. Trav. Chim. 82 208
- TakimiyaKKataokaYNiiharaNAsoYOtsuboT 2003 J. Org. Chem. 68 5217 http://dx.doi.org/10.1021/jo034145a
- HiskeyR GCarrollF I 1961 J. Am. Chem. Soc. 83 4644 http://dx.doi.org/10.1021/ja01483a033
- KawamotoTMoriTTakimiyaKKataokaYAsoYOtsuboT 2002 Phys. Rev. B 65 140508 http://dx.doi.org/10.1103/PhysRevB.65.140508
- TakimiyaKKodaniMKataokaYAsoYOtsuboTKawamotoTMoriT 2003 Chem. Mater. 15 3250 http://dx.doi.org/10.1021/cm034222i
- TakimiyaKTakamoriAAsoYOtsuboTKawamotoTMoriT 2003 Chem. Mater. 15 1225 http://dx.doi.org/10.1021/cm025758r
- TakimiyaKKodaniMNiiharaNAsoYOtsuboTBandoYKawamotoTMoriT 2004 Chem. Mater. 16 5120 http://dx.doi.org/10.1021/cm049144t
- KawamotoTMoriTKonoikeTEnomotoKTerashimaTUjiSKitagawaHTakimiyaKOtsuboT 2006 Phys. Rev. B 73 094513 http://dx.doi.org/10.1103/PhysRevB.73.094513
- KawamotoTMoriTUjiSYamauraJKitagawaHTakamoriATakimiyaKOtsuboT 2005 Phys. Rev. B 71 172503 http://dx.doi.org/10.1103/PhysRevB.71.172503
- KawamotoTBandoYMoriTTakimiyaKOtsuboT 2005 Phys Rev. B 71 052501 http://dx.doi.org/10.1103/PhysRevB.71.052501
- KodaniMTakamoriATakimiyaKAsoYOtsuboT 2002 J. Solid State Chem. 68 582 http://dx.doi.org/10.1006/jssc.2002.9755
- PapavassiliouG CMousdisG AYiannopoulosS YZambounisJ S 1988 Synth. Met. 27 B373 http://dx.doi.org/10.1016/0379-6779(88)90171-3
- KawamotoTBandoYMoriTKonoikeTTakahideYTerashimaTUjiSTakimiyaKOtsuboT 2008 Phys. Rev. B 77 224506 http://dx.doi.org/10.1103/PhysRevB.77.224506
- LiRPetricekVYangGCoppensPNaughtonM 1998 Chem. Mater. 10 1521 http://dx.doi.org/10.1021/cm9706457
- MarksT JKalinaD W 1983 Extended Linear Chain Compounds vol I J SMiller New York Plenum chapter 6
- CowieM et al 1979 J. Am. Chem. Soc. 101 2921 http://dx.doi.org/10.1021/ja00505a021
- ZambounisJ SPatsisA PKamitsosE IMayerC WPapavassiliouG C 1995 J. Raman Spectrosc. 26 9 http://dx.doi.org/10.1002/jrs.1250260104
- CisarovaIMalyKBuXFrost-JensenASommer-LarsenPCoppensP 1991 Chem. Mater. 3 647 http://dx.doi.org/10.1021/cm00016a017
- CoppensP 1995 Acta Crystallogr. B 51 402 http://dx.doi.org/10.1107/S0108768195003235
- MoriTKobayashiASasakiYKobayashiHSaitoGInokuchiH 1984 Bull. Chem. Soc. Japan 57 627 http://dx.doi.org/10.1246/bcsj.57.627
- WhangboM-HWalshW M JrHaddonR CWudlF 1982 Solid State Commun. 43 637 http://dx.doi.org/10.1016/0038-1098(82)90480-X
- MoriTKatsuharaM 2002 J. Phys. Soc. Japan 71 826 http://dx.doi.org/10.1143/JPSJ.71.826
- KawamotoTMoriTTerakuraCTerashimaTUjiSTakimiyaKAsoYOtsuboT 2003 Phys. Rev. B 67 020508 http://dx.doi.org/10.1103/PhysRevB.67.020508
- KawamotoTMoriTTerakuraCTerashimaTUjiSTajimaHTakimiyaKAsoYOtsuboT 2003 Eur. Phys. J. B 36 161 http://dx.doi.org/10.1140/epjb/e2003-00330-1
- KawamotoTMoriTEnomotoKKonoikeTTerashimaTUjiSTakamoriATakimiyaKOtsuboT 2006 Phys. Rev. B 73 024503 http://dx.doi.org/10.1103/PhysRevB.73.024503
- KosterG F 1957 Solid State Phys. 5 173
- JacobsenC S 1988 Semiconductors and Semimetals vol 27 EConwell Tokyo Academic chapter 5
- ShoenbergD 1984 Magnetic Oscillations in Metals Cambridge Cambridge Universisty Press
- WosnitzaJ 1996 Fermi Surfaces of Low Dimensional Organic Metals and Superconductors Berlin Springer
- AzbelM Y 1979 Phys. Rev. Lett. 43 1954 http://dx.doi.org/10.1103/PhysRevLett.43.1954
- HillS et al 1997 Phys. Rev. B 55 2018 http://dx.doi.org/10.1103/PhysRevB.55.2018
- EversonM PJohnsonALuH-AColemanR VFalicovL M 1987 Phys. Rev. B 36 6953 http://dx.doi.org/10.1103/PhysRevB.36.6953
- RazaviF SDatarsW RChartierDGillespieR J 1979 Phys. Rev. Lett. 42 1182 http://dx.doi.org/10.1103/PhysRevLett.42.1182
- BatallaERazaviF SDatarsW R 1982 Phys. Rev. B 25 2109 http://dx.doi.org/10.1103/PhysRevB.25.2109
- HanasakiNKagoshimaSHasegawaTOsadaTMiuraN 1998 Phys. Rev. B 57 1336 http://dx.doi.org/10.1103/PhysRevB.57.1336
- YagiRIyeY 1994 Solid State Commun. 89 275 http://dx.doi.org/10.1016/0038-1098(94)90697-1
- HusseyN EAbdel-JawadMCarringtonAMackenzieA PBalicasL 2003 Nature 425 814 http://dx.doi.org/10.1038/nature01981
- KawamotoTMoriTTerashimaTUjiSTakamoriATakimiyaKOtsuboT 2005 J. Phys. Soc. Japan 74 1529 http://dx.doi.org/10.1143/JPSJ.74.1529
- TinkhamM 1996 Introduction to Superconductivity 2nd edn New York McGraw-Hill
- IshikawaTNakazawaYYamashitaSOguniMSaitoKTakimiyaKOtsuboT 2006 J. Phys. Soc. Japan 75 074606 http://dx.doi.org/10.1143/JPSJ.75.074606
- CaulfieldJLubczynskiWPrattF LSingletonJKoD Y KHayesWKurmooMDayP 1994 J. Phys. Condens. Matter 6 2911 http://dx.doi.org/10.1088/0953-8984/6/15/013
- BrooksJ S et al 1995 Phys. Rev. B 52 14457 http://dx.doi.org/10.1103/PhysRevB.52.14457
- ZimanJ M 1972 Principles of the Theory of Solids 2nd edn Cambridge Cambridge University Press
- MerinoJMcKenzieR H 2000 Phys. Rev. B 62 2416 http://dx.doi.org/10.1103/PhysRevB.62.2416
- KawamotoTMoriT 2006 Phys. Rev. B 74 212502 http://dx.doi.org/10.1103/PhysRevB.74.212502
- BandoYKawamotoTMoriTTakimiyaKOtsuboT 2008 J. Phys. Soc. Japan 77 014706 http://dx.doi.org/10.1143/JPSJ.77.014706
- YosidaK 1951 Prog. Theor. Phys. 6 691 http://dx.doi.org/10.1143/PTP.6.691
- NagamiyaTYosidaKKuboR 1955 Adv. Phys. 4 1 http://dx.doi.org/10.1080/00018735500101154
- JéromeD 1991 Science 252 1509 http://dx.doi.org/10.1126/science.252.5012.1509
- KanodaK 1997 Hyperfine Interact. 104 235 http://dx.doi.org/10.1023/A:1012696314318
- LefebvreSWzietekPBrownSBourbonnaisCJéromeDMézièreCFourmiguéMBatailP 2000 Phys. Rev. Lett. 85 5420 http://dx.doi.org/10.1103/PhysRevLett.85.5420
- TaniguchiHMiyashitaMUchiyamaKSatohKMôriNOkamotoHMiyagawaKKanodaKHedoMUwatokoY 2003 J. Phys. Soc. Japan 72 468 http://dx.doi.org/10.1143/JPSJ.72.468
- BrusettiRRibaultMJéromeDBechgaardK 1982 J. Physique 43 801
- YoshiokaHSeoHFukuyamaH 2005 J. Phys. Soc. Japan 74 1922 http://dx.doi.org/10.1143/JPSJ.74.1922
- SeoHYoshiokaHOtsukaY 2008 J. Phys.: Conf. Ser. 132 012018 http://dx.doi.org/10.1088/1742-6596/132/1/012018
- YoneyamaNMiyazakiAEnokiTSaitoG 1999 Bull. Chem. Soc. Japan 72 639 http://dx.doi.org/10.1246/bcsj.72.639
- MortensenKTomkiewiczYBechgaardK 1982 Phys. Rev. B 25 3319 http://dx.doi.org/10.1103/PhysRevB.25.3319
- ParkinS S PScottJ CTorranceJ BEnglerE M 1982 Phys. Rev. B 26 6319 http://dx.doi.org/10.1103/PhysRevB.26.6319
- BalicasLBehniaKKangWCanadellEAuban-SenzierPJéromeDRibaultMFabreJ M 1994 J. Physique I 4 1539 http://dx.doi.org/10.1051/jp1:1994205
- SekretarczykGGrajaAPichetJLyubovskayaR NLyubovskiiR B 1988 J. Physique 49 653 http://dx.doi.org/10.1051/jphys:01988004904065300
- SchirberJ EOvermyerD LVenturiniE LWangH HCarlsonK DKwokW KKleinjanSWilliamsJ M 1989 Physica C 161 412 http://dx.doi.org/10.1016/0921-4534(89)90353-5
- Bud'koS LGapotchenkoA GLuppovA ELyubovskayaR NLyubovskiiR B 1992 Sov. Phys.—JETP 74 983
- LyubovskiiR BLyubovskayaR NDyachenkoO A 1996 J. Physique I 6 1609 http://dx.doi.org/10.1051/jp1:1996178
- OhmichiEIshiguroTSakonTSasakiTMotokawaMLyubovskiiR BLyubovskayaR N 1999 J. Supercond. 12 505 http://dx.doi.org/10.1023/A:1007775916461
- NaitoANakazawaYSaitoKTaniguchiHKanodaKSoraiM 2005 Phys. Rev. B 71 054514 http://dx.doi.org/10.1103/PhysRevB.71.054514
- TaniguchiHOkuhataTNagaiTSatohKMôriNShimizuYHedoMUwatokoY 2007 J. Phys. Soc. Japan 76 113709 http://dx.doi.org/10.1143/JPSJ.76.113709
- TaniguchiHOkuhataTNagaiTMiyashitaMUchiyamaKSatohKMôriNHedoMUwatokoY 2007 J. Phys. Soc. Japan 76 168 (Suppl A)
- MoriTBandoYKawamotoTTerasakiITakimiyaKOtsuboT 2008 Phys. Rev. Lett. 100 037001 http://dx.doi.org/10.1103/PhysRevLett.100.037001
- MartinSLeberHMartienssenW 1984 Phys. Rev. Lett. 53 303 http://dx.doi.org/10.1103/PhysRevLett.53.303
- MartinSMartienssenW 1986 Phys. Rev. Lett. 56 1522 http://dx.doi.org/10.1103/PhysRevLett.56.1522