Abstract
Our periodic orbit resonance (POR) results on quasi-two-dimensional (q2D), highly anisotropic q2D and quasi-one-dimensional (q1D) organic conductors are reviewed together with our rotational cavity magneto-optical measurement system. Higher order POR up to seventh order has been observed in the q2D system (BEDT-TTF)2Br(DIA), and the experimental conditions to observe POR and the cyclotron resonance (CR) are discussed. Highly anisotropic q2D Fermi surface (FS) in β″-(BEDT-TTF)(TCNQ), which was considered to have q1D FS previously, is proposed by our POR measurements, and the possible interpretations of other experimental results of β″-(BEDT-TTF)(TCNQ) are discussed assuming the highly anisotropic q2D FS. Finally, detailed q1D FS of (DMET)2I3, obtained from our POR results, is discussed in connection with the typical q1D system (TMTSF)2ClO4.
Introduction
Molecular conductors have attracted much interest since the discovery of superconductivity in a series of quasi-one-dimensional (q1D) molecular conductors, TMTSF salts [Citation1], followed by a series of quasi-two-dimensional (q2D) molecular conductors, BEDT-TTF salts [Citation2]. Recently, field-induced superconductivity has also been reported in BETS salts [Citation3]. Moreover, a rich variety of peculiar physical phenomena, such as a charge density wave (CDW), a spin density wave (SDW) and a charge order, have been revealed in molecular conductors. These phenomena are closely related to the low-dimensional character of their electronic structure. Especially, the Fermi surface (FS) plays an important role. Therefore, the experiments to study the FS topologies are crucial to understand the low-dimensional molecular conductors.
In order to study the FS topologies, high magnetic field techniques, such as Shubnikov–de Haas oscillation (SdH), de Haas–van Alphen oscillation (dHvA) and angle dependent magnetoresistance oscillation (ADMRO) measurements (see review [Citation4] for details), are often employed. Moreover, the cyclotron resonance (CR) measurement is one of the useful and well-known techniques in magneto-optical measurements on semiconductors and metals. The CR measurement is a comprehensive technique for SdH and dHvA measurements because it gives direct information of carrier's effective mass and scattering time. Singleton et al [Citation5] observed CRs in α-(BEDT-TTF)2KHg(SCN)4 using static magnetic field and suggested that the effective masses obtained from CRs were smaller than those obtained by dHvA and SdH measurements. They pointed out that this result can be explained by the ‘Kohn's theorem’ [Citation6]. The theorem suggests that the effective mass obtained by CR is independent of the electron–electron interaction, whereas the effective mass obtained by dHvA and SdH is enhanced by the electron–electron interaction in the system. Using the pulsed magnetic field, we obtained, for the first time, a similar result for α-(BEDT-TTF)2KHg(SCN)4 [Citation7] and extended the CR measurements to various q2D molecular conductors [Citation8–14]. In particular, we observed several CRs in α-(BEDT-TTF)2RbHg(SCN)4 suggesting the reconstruction of the FS below the transition temperature [Citation9], and CRs from the close orbit (α-orbit) and the breakdown orbit (β-orbit) in θ-(BEDT-TTF)2I3 [Citation12–14]. ‘Kohn's theorem’ seems to hold in all our results.
Besides CR, a novel magneto-optical resonance called the periodic orbit resonance (POR) has also been proposed [Citation15, Citation16]. POR is closely related to ADMRO where POR and ADMRO correspond to σ(ω≠0) and σ(ω=0) conductivity measurements, respectively. However, POR measurement will provide more detailed information about the FS topologies than ADMRO measurement which will be shown later. Moreover, POR provides the information about not only the q2D FS topology but also on the q1D FS topology, which is not possible by the common quantum oscillation measurements such as SdH or dHvA measurements. Therefore, POR measurements have been performed on several q2D and q1D molecular conductors and q2D layered ruthenium oxide superconductor [Citation15–21].
This review is focused mainly on our recent POR measurements on molecular conductors and is organized as follows. In section 2, we discuss our experimental setups and describe the analyses. Our POR results on q2D, highly anisotropic q2D and q1D molecular conductors are discussed in sections 3, 4 and 5, respectively. They are followed by the summary in section 6.
Experiments and analyses
The measurements were performed at the High Field Laboratory for Superconducting Materials (HFLSM), Institute for Materials Research (IMR), Tohoku University. The measurement system consists of a superconducting magnet (up to 15 or 18 T), a cryostat, a resonant cavity and a millimeter vector network analyzer (MVNA). MVNA is a source and detector system of millimeter waves. The available temperature and the frequency ranges of the present system are 1.5–4.2 K and ∼50–100 GHz, respectively.
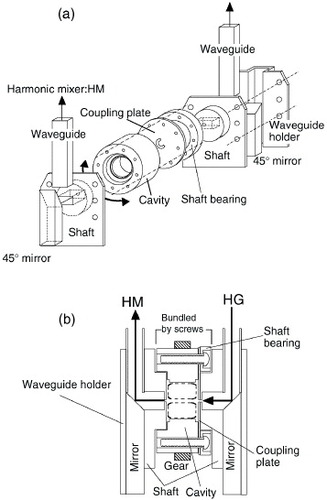
The experiments utilized a cavity perturbation technique. The rotational resonant cavity, which can rotate continuously in a magnetic field at low temperatures, was developed to perform detailed angular dependent measurements [Citation22]. A schematic diagram of the rotational resonant cavity is shown in figure . The rotational axis of the cavity is parallel to the cylindrical axis which is perpendicular to the axis of the solenoid. The coupling holes are made at the ‘Shaft’ in figures (a) and (b), and the holes are located at the off-axis position of the end plate of the cylindrical cavity. Therefore, microwaves through the waveguides can be coupled to TE01p modes, where p is an integer. Almost all measurements are performed using TE011 and TE012 modes. They are the basic modes of a cylindrical cavity and have fairly high Q-values [Citation23]. The ‘Coupling plate’ with a fan-shaped hole is bundled with the ‘Cavity’ and the ‘Shaft bearing’ by screws. This is the rotational part of the cavity. Because of the fan-shaped hole, the coupling hole is not covered in a wide angular range (∼270°), and the positions of the coupling holes do not depend on the rotation. The inner dimensions of the cylindrical cavity are 7 mm in diameter and 6 mm in height. Therefore, TE011 and TE012 frequencies are given at about 58 and 72 GHz, respectively. The measured quality factors (Q-values) of the empty cavity are about 21 000 and 17 000 for TE011 and TE012 modes at 4.2 K, respectively. These high Q-values are kept in the whole angular range of the measurement. The previously reported rotational resonant cavity was a rectangular one with the Q-value of 1500 at 4.2 K [Citation16, Citation24]. In the case of the electron spin resonance (ESR), the minimum detectable number of spins is inversely proportional to the Q-value [Citation23]. Therefore, high Q-value leads to a high sensitivity. We have succeeded in obtaining a very high sensitivity using the cylindrical resonant cavity and its basic modes. Similar work has been performed independently by other group around the same time [Citation25].
Figure 1 (a) Schematic diagram of the rotational resonant cavity. For simplification, the gear wheel in the cavity is not described. The parts connected by dashed lines were bundled together with screws in the experiments. (b) Cross section of the rotational resonant cavity. Oxygen-free copper is used for the cavity, the shaft, the coupling plate and the mirror . The waveguides are made of Cu–Ni and the other parts are made of brass. (Reprinted with permission from [Citation22].)
Periodic orbit resonance in quasi-one-dimensional (q1D) conductors
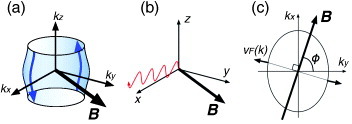
The POR in q1D system (q1D-POR) corresponds to the Lebed resonance for high-frequency alternating current [Citation26]. Several groups have treated this phenomenon both theoretically and experimentally [Citation16, Citation19], [Citation26–28]. A brief introduction is given below. When the magnetic field is tilted from the z-axis by θ in the plane which is parallel to the q1D-FS, quasiparticle traverses perpendicular to the magnetic field in the FS (see figure ). The frequency of the real-space waving motion (ωc) is proportional to the field strength (B) and the averaged Fermi velocity (vF). The waving motion also depends on the corrugation character of the q1D-FS. The q1D band model near the Fermi level with a linearized approximation for an oblique lattice is written as
where b, c and d are the parameters related to the lattice constant shown in figure (c), m and n are integers and tmn is the effective transfer integral along the lattice vector Rmn=(0,mb+nd,nc). Using the semiclassical equations of motion and the Boltzmann transport equation, the resonance condition is given by [Citation19, Citation26]
where ω is a frequency of electro-magnetic wave. In equation (Equation2
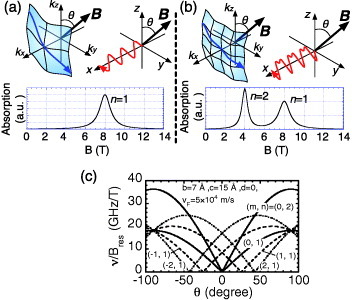
), the content of bracket in the right-hand side expresses the warping of the q1D-FS; m and n are numbers of the period of FS warping in the first Brillouin zone (FBZ) along the y- and z-directions, respectively. Figures (a) and (b) show examples of the relation between the FS warping and POR absorption lines. If only one warping exists in the FBZ (single warping), we would observe only one absorption which corresponds to n=1 (figure (a)). On the other hand, if the single warping and the double warping exist (double warping is a doubled corrugation of a single warping), two absorption lines corresponding to n=1, 2 would be observed (figure (b)). This means that the integers m and n correspond to the Fourier components of FS corrugations. The integers m and n can be decided by the angular-dependent measurements. The θ-dependences of ν/Bres (ν=ω/2π, and Bres is the resonance field of the POR) for several combinations of (m, n) are shown in figure (c). Hence, we can estimate the Fourier components of typical FS corrugations separately from the q1D-POR measurement, while only the ratio m/n of the Fourier components of FS corrugations can be estimated from the Lebed resonance.
Figure 2 (a) Schematic picture of the q1D-FS and a quasiparticle trajectory in a k space when the magnetic field is applied in the plane parallel to the FS. (b) The corresponding trajectory in a real space. (c) The crystal lattice model in the bc-plane for an oblique lattice.
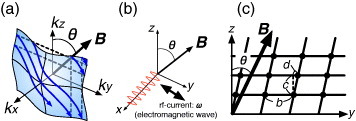
Figure 3 Schematic figures of a quasiparticle trajectory and the POR absorption line for (a) the single warping FS and (b) the more complicated FS which has a single and a double warpings. (c) The example of the θ-dependence of ν/Bres of q1D-PORs for typical parameters printed in the figure. The (m, n) combinations correspond to the typical Fourier components of the q1D-FS.
The q1D-POR is a powerful tool to study the shape of the q1D-FS. However, the q1D-POR corresponding to the Fourier component of n=0 corrugation is usually not observable. (In general, PORs are mainly dominated by the inter-plane ac conductivity, while the FS corrugations of n=0 contribute to the in-plane conductivity only). Thus, the information on the in-plane corrugation cannot be obtained in the above field configuration. Here below, angular dependence of the q1D-POR resonance fields is treated when the magnetic field is applied parallel to the conducting plane [Citation29]. Angle φ is the angle from the ky direction in the conducting plane. We consider simpler q1D band model which corresponds to the case of n=1, m=1 and d=0 in equation (Equation1). In the present field configuration, ωc for n=1 corrugation becomes
, i.e. θ=90° in equation (Equation2
). The φ dependence of the normalized resonance field (≡Bres/ν) is given by
where η (
) is the parameter which expresses the anisotropy between the x- and the y-axes (tb=t10 in equation (Equation1
)). If η=0 (i.e. completely one-dimensional FS), resonance condition becomes
which is the conventional φ dependence of q1D-PORs assumed in previous studies [Citation19, Citation30]. If we consider the tight-binding quarter-filled band, η can be written as
, so that we can estimate the ratio of the in-plane transfer integrals from the φ dependence of the resonance field. Here, a and ta are the lattice constant and the transfer integral along the x-direction, respectively.
Periodic orbit resonance in quasi-two-dimensional (q2D) conductors
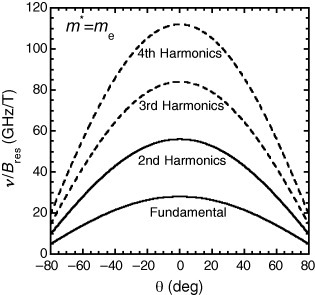
The q2D-POR is similar to the conventional cyclotron resonance, but it dominated by the interlayer ac conductivity. Hill has calculated the ac conductivity along the interlayer direction (z-direction), and pointed out that the interlayer ac conductivity has harmonic components ω=nωc of the fundamental cyclotron frequency defined as ωc=eB/m∗, where m∗ is the effective mass averaged over the cyclotron orbit [Citation15]. He has also demonstrated from his semiclassical calculation that the 2nd harmonics has the strongest absorption, and the anisotropy of q2D FS is crucial to observe these harmonic components. Moreover, McKenzie and Moses have calculated the ac interlayer conductivity for general field angles [Citation18]. Thus, the resonance condition is given by ω=nωccos θ. Transforming the equation, we obtain
where n is the integer, and Bres, n is the resonance field of the nth POR. The θ dependence of ν/Bres is shown in figure .
Figure 4 Example of the θ dependence of ν/Bres for q2D-PORs. The cyclotron effective mass is taken as the free electron mass.
We have treated above the q2D POR when the magnetic field is close to z-direction. However, that treatment is no longer valid when the magnetic field direction is very close to that of the conducting layer, because the quasiparticle trajectory is not anymore a cyclotron motion, and the open orbit along the kz-direction will appear as shown in figure (a). The frequency of the quasiparticle periodic motion will be proportional to the magnetic field strength and the velocity component perpendicular to the magnetic field. Hence, the period strongly depends on the in-plane wave vector. The resonance will occur when the periodicity of the quasiparticle trajectory matches the frequency of the electromagnetic wave. Therefore, the in-plane Fermi velocity can be mapped out from the measurement with various in-plane magnetic field angles. This effect has been treated semiclassically [Citation20]. The resonance condition of the POR for this case is given by
Here, vxm and vym are the maximal Fermi velocities along the kx- and the ky-directions, respectively. Therefore, we can map the in-plane Fermi velocity vF(φ) by measuring this POR at various field angles in the conducting plane. If we assume the band structure, we can also map the shape of the FS in the conducting plane.
Figure 5 (a) Schematic description of the quasiparticle trajectory on the q2D-FS when the magnetic field is applied parallel to the conducting plane. (b) The corresponding quasiparticle orbit in a real space. (c) Geometrical configuration between the magnetic field and the q2D-FS which has an in-plane anisotropy.
POR in q2D system
In the previous section, we have shown the principle of POR and that the features of the resonance differ considerably between q1D- and q2D-POR. In this section, the results are presented for low-dimensional molecular conductors which have a simple q2D FS. We show below that the q2D-POR, which is a resonant absorption related to the interlayer conductivity, has some unique features.
(BEDT-TTF)2Br(DIA)
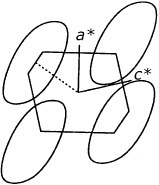
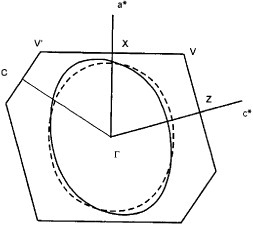
(BEDT-TTF)2Br(DIA), where DIA is diiodoacetylene, is one of the families of molecular conductors which contains supramolecular assemblies with halide anions and neutral molecules [Citation31]. The supramolecular assemblies form one-dimensional chain ···Br···DIA·· ·, while the donor molecules (i.e. BEDT-TTF) fit into the channels formed by those chains. Therefore, fractional band-filling control is possible by changing the length of the 1D supramolecular assemblies. The band structure of (BEDT-TTF)2Br(DIA) is very simple and the FS is predicted to have a simple closed orbit from the band calculation (figure ). The FS is anisotropic, and the major axis of the elliptical FS extends toward the ka∗+kc∗ direction.
Figure 6 The Fermi surface of (BEDT-TTF)2Br(DIA).
(BEDT-TTF)2Br(DIA) is metallic down to 0.3 K, and the residual resistivity ratio (RRR) has a fairly large value of about 1500. Magnetotransport measurements (i.e. SdH and ADMRO) on (BEDT-TTF)2Br(DIA) have been performed by Uji et al [Citation32]. The results indicate presence of a q2D FS with an elliptic cross-sectional area of about 51% of the first Brillouin zone, which is consistent with the band calculation. The obtained effective mass m∗ is 4.3me.
Magneto-optical measurements on (BEDT-TTF)2 Br(DIA) have been reported by Oshima et al [Citation33]. Figure (a) shows typical spectra of (BEDT-TTF)2 Br(DIA) observed at 0.5 K. The magnetic field is applied perpendicular to the conducting plane (i.e., B∥b∗). The sample is set to the off-centered position for a half-radius length of the cavity as shown in figure (c). Since the cavity mode is TE011 for 57.735 GHz, the oscillatory -field is coupled with the in-plane direction of the sample. Note that this is the usual sample configuration for observing conventional CR (i.e., σ∥(ω)). In a conventional CR, there is only one FS orbit. Therefore, single absorption line should be observed. However, multiple absorption lines, which strengthen as the field increases, are observed for each frequency (figure (a)). Similar multiple absorptions are also observed for 72.199 and 90.908 GHz where the sample is coupled to the oscillatory
and
-field, respectively.
Figure 7 (a) Typical cavity transmission spectra of (BEDT-TTF)2Br(DIA) observed at 0.5 K. (b) The inverse-field plot of the 72.199 GHz spectrum of (a). (Reprinted with permission from [Citation33].) (c) Schematic drawing of the sample configuration.
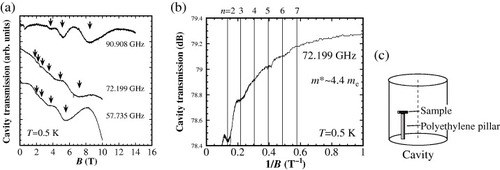
Figure (b) is the inverse magnetic field plot of the spectrum observed at 72.199 GHz. It is clear that the harmonic absorption lines appear periodically as a function of the inverse magnetic field. If the resonances are q2D-POR, the resonance condition will be ω=nωc, where ωc(=eB/m∗) and ω(=2πν) are the cyclotron and the incident microwave frequencies, respectively [Citation15].
From the above condition, the resonance periodicity against the inverse magnetic field is described as follows:
where Bres, n is the resonance field of nth-order harmonics and m∗ is the cyclotron effective mass. Therefore, from the periodicity of the resonances, which is 0.088 T−1 in figure (b), the estimated effective mass would be around 4.4me. From the relation ω=nωc and the obtained effective mass m∗, now we know which resonance belongs to the nth-harmonic. The order of harmonics n is given on the upper axis of figure (b). The strongest absorption corresponds to the second harmonic, which is the strong evidence for the observation of q2D-POR. It is also worth to mention that harmonics up to the seventh order were observed, and fundamental resonance (i.e., n=1) was not observed for this configuration.
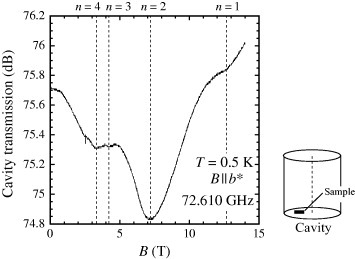
Figure is another cavity transmission spectrum using different sample configuration. The sample is set on the end-plate of the cavity as shown in a schematic drawing and is coupled with the oscillatory -field. As one can see, the lineshape is quite different from the one observed in figure . By the procedure mentioned above, the order of harmonics is given in the upper axis of figure . The fundamental resonance (n=1) is now observed for this configuration. The intensity of the 2nd harmonic is still the strongest that reflects the feature of q2D-POR. As it is described in the previous section, the intensity of the harmonics depends on the angle of the magnetic field. Therefore, the magnetic field might just happen to be in the appropriate orientation for observing high-order harmonics or the fundamental resonance. However, as it is shown above, the lineshape of q2D-POR differs considerably upon only changing the sample configuration. This suggests that the lineshape of POR is very sensitive to the sample's electrodynamics induced by the oscillatory
or
-field. Hence, we believe that sample configuration, sample quality and sample size are also the important parameters for the observation of higher harmonics. The relation between the lineshape of POR and the electrodynamics within the sample is discussed elsewhere [Citation17, Citation33–35].
Figure 8 Typical cavity transmission spectra of (BEDT-TTF)2Br(DIA) with a different sample configuration at 0.5 K. The vertical broken lines are the order of harmonics. Schematic drawing shows its sample configuration. In this configuration, the oscillatory -field is applied in any frequency.
The analysis of q2D-POR spectra for each frequency in figure (a) leads to the average effective mass of m∗=4.7±0.1me. In some molecular conductors, smaller effective masses were obtained in the CR experiment than those of SdH and dHvA oscillation measurements [Citation5, Citation7, Citation11–14]. It is known for a long time that the CR's effective mass is not affected by the electron–electron interactions since the applied ac electric field couples only with the center-of-mass motion to which the internal force (i.e. electron–electron interaction) does not contribute. Therefore, for a system where the electron–electron interaction is not negligible, the effective mass obtained by quantum oscillation will be larger than CR's mass since the former is enhanced by the electron–electron interaction. This is known as the ‘Kohn's theorem’ [Citation6]. However, for (BEDT-TTF)2Br(DIA), the effective mass obtained by SdH measurement, 4.3me, is close to the mass obtained from q2D-POR. The Kohn's theorem is based on a model considering only the conventional CR (i.e. in-plane conductivity). However, POR is a resonant absorption which is related to the interlayer conductivity. In that case, the Kohn's argument may break down considering that other q2D-POR results have also revealed a similar effective mass value with quantum oscillation measurements. This may suggest that the q2D-POR's effective mass is enhanced and is different from the conventional CR's effective mass.
(BEDT-TTF)3Cl(DFBIB)
(BEDT-TTF)3Cl(DFBIB), where DFBIB is (1,4-difluoro-2,5-bis (iodoethynyl) benzene), is in the same family of (BEDT-TTF)2Br(DIA) which contains supramolecular assemblies. Since the 1D supramolecular chains DFBIB are longer than the DIA, the 3 : 1 donor/anion ratio is achieved [Citation36]. This salt exhibits metallic behavior down to 1.6 K and the RRR is fairly large. Note that this salt is the first metallic BEDT-TTF salt where the formal charge of donor is +1/3.
Tight-binding calculation shows that the q2D-FS is anisotropic (figure ). As it is shown in figure , the FS's anisotropy of (BEDT-TTF)3Cl(DFBIB) is due to the anisotropic chemical pressure of its supramolecular assemblies. The ratio of the major axis to the minor axis of the elliptic FS is 1.39.
Figure 9 The Fermi surface of (BEDT-TTF)3Cl(DFBIB) (solid line).
SdH and ADMRO measurements were reported by Yasuzuka et al [Citation37]. ADMRO was observed for this salt and the area of FS was estimated as 48.3% of the first Brillouin zone. The ratio of the major axis to the minor axis of the ellipse is 1.21 for (BEDT-TTF)3Cl(DFBIB) which is slightly smaller than the value deduced from the band calculation. SdH oscillations are also observed for this salt, namely two oscillations, minimum and maximum cross-sectional area of the q2D FS, with the frequencies 2262.7 T (49.8% of the Brillouin zone) and 2318.8 T (51.1% of the Brillouin zone). The effective mass of Cl(DFBIB) salt is 2.1me.
Here, we show the typical spectra of (BEDT-TTF)3Cl(DFBIB) observed at 0.5 and 4.2 K in figure . The frequency is about 72 GHz and the two spectra for each temperature show upward and downward magnetic field scans. In the 4.2 K spectra, we see a large gradient due to magnetoresistivity. However, there are some additional small absorption lines at 0.5 K.
Figure 10 Typical cavity transmission spectra of (BEDT-TTF)3Cl(DFBIB) observed at 0.5 and 4.2 K. The inset shows the ratio of 0.5 spectra to 4.2 K spectra.
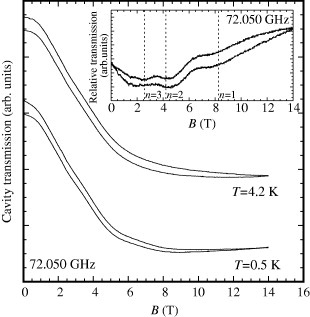
To show clearly the additional absorption lines and get rid of the gradient, we have divided the 0.5 K spectra by the 4.2 K spectra. The divided spectra are shown in the inset of figure . The harmonic absorption lines are clearly seen, and the positions of the multiple absorption lines are reproducible in both spectra. The second harmonics (n=2) is the strongest one which suggests the observed absorption lines are q2D-POR. Fundamental POR (i.e. n=1) is also observed, which may be due to the sample misalignment or tilting of FS [Citation15]. The crystal structure of (BEDT-TTF)3Cl(DFBIB) is triclinic, thus probably the FS is tilted.
The observation of q2D-POR is in a good agreement with the band calculation and ADMRO results which suggest anisotropic q2D FS, and the obtained effective mass 2.9me is slightly larger than that of SdH measurements result (i.e. 2.1me). The SdH effective mass is obtained by fitting the Lifshitz–Kosevich formula to the temperature dependence of the oscillation's amplitude, which means that the mass is obtained indirectly and may be ambiguous. Therefore, we think that the q2D-POR's mass 2.9me and the SdH mass 2.1me are more or less consistent as it was for (BEDT-TTF)2Br(DIA). This may suggest, again, that the effective mass is enhanced for q2D-POR and is different from the conventional CR's mass.
It is interesting to see that some q2D molecular conductors show POR and CR. For example, θ-(BEDT-TTF)2I3 is one of the typical molecular conductors which shows CR [Citation14, Citation38]. The effective mass is almost the half of that of SdH measurements, which is explained by the Kohn's theorem. There are still some controversies in the community for the CR/POR observation; however, we have proposed the condition for observing CR/POR [Citation38]. Based on the idea proposed by Hill and co-workers [Citation17, Citation34, Citation35], we have presumed that the skin depth, which is related to the sample's dc conductivity, plays an important role for the observation of CR/POR. Generally speaking, CR is the resonance related with the real part of the in-plane conductivity of the sample, while POR is the dissipation of the interlayer conductivity. Hence, the sample volume, which contributes to the amplitude of POR, is proportional to the interlayer skin depth. The skin depths in the interlayer direction differ considerably for each sample. For instance, the dc conductivity differs ten times between θ-(BEDT-TTF)2I3 and Cl(DFBIB) salts. The sample in which CR is observed has skin depth of 20–40 μm (for 60 GHz). Meanwhile, the sample in which POR is observed has a skin depth of hundreds μm (for 60 GHz). (BEDT-TTF)2Br(DIA), in which the clearest POR is observed, has a largest interlayer skin depth of about 200 μm. Nevertheless, both resonances arise from the same cyclotron motion of carriers, CR and POR seem to appear selectively depending on the sample condition such as the skin depth or dc conductivity.
There are some common conditions for observing CR/POR, such as low temperature, high magnetic field and clean sample (i.e. ωτ>1). Although there are still some discussions on CR/POR observation, we propose additional conditions for CR/POR observation in a q2D system. For POR in a q2D system (e.g. [Citation15, Citation27, Citation38, Citation45], it is necessary that (i) the sample has an anisotropic q2D FS (elliptic FS), (ii) the interlayer skin depth is relatively long (e.g. over 100 μm), i.e. bad conductor, and (iii) it is preferable that the sample is coupled with an oscillatory -field, but can also be observed with
-field.
For CR in a q2D system (e.g. [Citation2, Citation5, Citation7, Citation14, Citation17, Citation38], it is necessary that (i) the FS has a closed orbit, (ii) the interlayer skin depth is relatively short (about 20–40 μm), (iii) the sample is coupled with an oscillatory -field. For a system where electron–electron interactions are not negligible, the effective mass obtained by CR is smaller than those obtained by SdH or dHvA measurements. This fact is explained by the Kohn's theorem.
POR in highly anisotropic q2D system
Here, we report the low-temperature FS shapes of β″-(BEDT-TTF)(TCNQ) (x=0 salt), and of a related compound, β″-(BEDT-TTF)(TCNQ)0.95(F1-TCNQ)0.05 (x=0.05 salt) estimated from the magneto-optical measurements. The β″-(BEDT-TTF)(TCNQ) salt (BEDT-TTFbis (ethylenedithio)tetrathiafulvalene and TCNQ
tetracyanoquinodimethene) was synthesized by Yamamoto et al [Citation40, Citation41]. The temperature dependence of electric resistivity shows metallic behavior below room temperature down to 0.5 K, and three anomalies were observed at 175, 80 and 20 K [Citation40–42]. According to the optical spectroscopy measurements, the charge disproportion of the BEDT-TTF layer, which may be caused by the electron–electron interaction, is observed at room temperature and is destroyed at 175 K. Therefore, this anomaly may originate from the destruction of charge disproportion [Citation43]. On the other hand, the origins of the hump structures in the resistance curve at 80 and 20 K are not clear at the moment [Citation40, Citation41].
The unit cell contains one BEDT-TTF molecule and one TCNQ molecule. It is considered that each molecule forms individual q1D conducting layers, and these conducting layers are stacking one by one along the b∗-axis. The conducting directions of the BEDT-TTF layer and the TCNQ layer are parallel to the a- and c-axes of the crystal, respectively. Consequently, this salt has a crossing FS comprising two pairs of sheet-like q1D-FSs at right angles [Citation40, Citation41]; namely, one FS associated with BEDT-TTF layers is a pair of parallel sheets normal to the ka-axis, while another FS associated with TCNQ layers is normal to the kc-axis. For the x=0 salt, the anomalous behavior of the ADMRO has been reported by Yasuzuka et al [Citation42]. In the simple ADMRO picture, the period of magnetoresistance dips or peaks does not change against the tangent of the magnetic field angles θB throughout the whole angular range. Here, θB is the angle between the magnetic field direction and the least conducting axis, which is the b∗-axis in the present case. However, for the x=0 salt, when the magnetic field is rotated in the bc-plane, the ADMRO period changes from Δtan θB≈0.37 to ≈0.70 at tan θB≈5 [Citation42]. This ADMRO behavior is considered to result from the q1D-FS associated with BEDT-TTF layers, which is predicted by the band calculation. However, the period of the observed ADMRO cannot be explained quantitatively in terms of the lattice parameters at room temperature. Moreover, several SdH oscillations are also observed at low temperature. The rough shapes of observed FSs are q2D, and cross-sectional areas correspond to 1–5% of the first Brillouin zone (FBZ) [Citation42]. The cylindrical axis of q2D-FS is approximately oriented along the b∗-axis. The existence of these small q2D orbits is not predicted by the band calculation.
The hump structures observed at 80 and 20 K in the x=0 salt are suppressed by doping 5% F1-TCNQ (F1-TCNQ2-fluoro tetracyanoquinodimethane) [Citation40, Citation41]. As the crystal structure of x=0.05 salt is similar to that of x=0 salt, the FS at room temperature should be similar too. Therefore, a comparison of the low-temperature FSs of both salts provides direct information about the origin of the two hump structures observed in the resistivity measurement on the x=0 salt. Hence, in order to clarify the low-temperature FS and the origin of the resistivity humps at 80 and 20 K of x=0 salt, we have performed magneto-optical measurements on β″-(BEDT-TTF)(TCNQ)1−x(F1-TCNQ)x (x=0, 0.05) [Citation44, Citation45].
The plate-like samples with the typical dimensions of 0.7×0.4×0.1 mm3 were used. The external dc magnetic field was rotated with the angles θ and φ, where θ and φ are angles from the b∗- and c-axes, respectively.
x=0 salt (β″-(BEDT-TTF)(TCNQ))
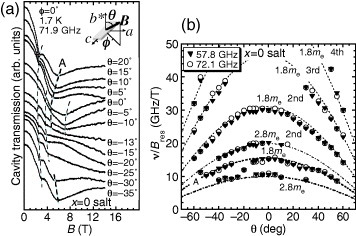
The θ dependence of transmission spectra of the x=0 salt for φ=0° is shown in figure (a). The measurement temperature and frequency are 1.6 K and 71.9 GHz, respectively. Several resonances are indicated by the dashed lines. The resonance fields shift to higher fields as θ increases. The observed θ dependence of ν/Bres is shown in figure (b), and they show the typical behavior of q2D-POR. The obtained effective masses are 1.8me and 2.8me, which are almost consistent with the values obtained from SdH measurements (α-orbit: 1.5me, β-orbit: 2.6me) [Citation42]. Therefore, the q2D-PORs in our measurements are associated with the small q2D-FSs observed in SdH measurements by Yasuzuka et al.
Figure 11 (a) θ dependence of the transmission spectra of the x=0 salt for φ=0°. Dashed lines are the guides for the eyes for several resonances. (b) θ dependence of the ν/Bres for the resonances observed in (a). Dashed lines are the lines fitted by equation (Equation4). The angular dependence of the resonances indicated by the bold dashed line A in (a) corresponds to the bold dashed line A in (b).
In order to clarify the cross-sectional shape of the q2D-FSs, the φ dependence in the conducting plane was measured. Figure (a) shows the φ dependence of the absorption lines at 1.6 K. Two series of resonances are observed as indicated by solid and dashed lines B and C. If we assume an elliptical FS cross section, the resonance condition in the present case is [Citation20]
Here vFmax and vFmin are the Fermi velocities along the short and the long axes of the elliptical FS, respectively; ξ is the angle between the c-axis and the long axis of the elliptical FS. The symbols in figure (b) show the polar plot of hν/Breseb∗ versus (φ−90°). The dashed lines are the fit by equation (Equation7
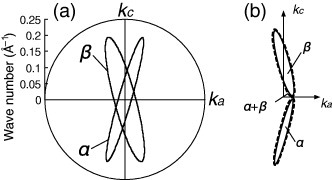
), from which we obtain vFmax=1.1×10⁵ m s−1, vFmin=1.1×10⁴ m s−1 for mode B, and vFmax=6.6×10⁴ m s−1, vFmin=1.1×10⁴ m s−1 for mode C. The ellipses shown by solid lines are FS cross sections in the velocity space. From these results, we can estimate the anisotropy of FSs in the conducting plane as 1 : 10 for the FS of mode B and 1 : 6 for the FS of mode C. The long axes of the FSs of B and C are tilted at 15° and −15° to the a-axis, respectively. The area of the FS cross section is given by πkFminkFmax, where kFmin and kFmax are the Fermi wave numbers for the long and the short axes of the elliptical FS. Hence, using the cross-sectional areas of q2D-FSs of this system obtained by the SdH measurements (1.3×10⁻² Å−2 and 2.0×10⁻² Å−2 for the α- and β-orbits, respectively), we can estimate the FS shape in the wave number space. If we adopt the anisotropies of 1 : 10 and 1 : 6 for the α- and β-orbits, respectively, we obtain kFmin(α)=0.020 Å−1, kFmax(α)=0.20 Å−1 for the α-orbit, and kFmin(β)=0.033 Å−1, kFmax(β)=0.20 Å−1 for the β-orbit. The cross-sectional shapes of the α- and β-orbits are described in figure (a). The example of the relative configuration between the α- and the β-orbits is shown in figure (b).
Figure 12 (a) φ dependence of the transmission spectra when the magnetic field is rotated in the conducting plane of the x=0 salt. Solid and dashed lines show two different series of resonances. (b) Polar plot of hν/Breseb∗ for the resonances observed in (a). The solid triangles and the open circles indicate the two series of resonances B and C, respectively. The fine solid lines are calculated using equation (Equation7), and ellipses are the obtained FS cross section in the velocity space.
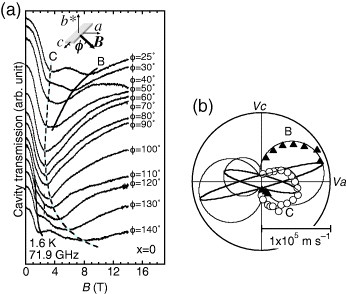
Figure 13 (a) Schematic picture of FS cross sections of α- and β-orbits in the x=0 salt. (b) An example of relative configuration between α- and β-orbits. The magnetic breakdown orbit (α+β) is shown by the dashed line.
The strangest feature of the x=0 salt is the inconsistency between ADMRO [Citation42] and the magneto-optical measurements: our results suggest the low-temperature FS of x=0 salt consists only from q2D orbits. That is to say, the short period in the small tan θB region is associated with the magnetic breakdown orbit, while the long period in the large tan θB region is associated with the fundamental closed orbit. In fact, the predicted ADMRO periods in the b∗c-plane rotation for the fundamental orbit and the magnetic breakdown orbit are close to the observed values. The expected ADMRO periods Δtan θB are ∼π/b∗vFmax=0.78 and ∼2π/b∗vFmax=0.39 for the fundamental and the magnetic breakdown α+β orbit, respectively. These values are close to the observed two periods in ADMRO measurements, i.e., ∼0.70 and ∼0.37. The multiple ADMRO periods due to the magnetic breakdown have been observed in some organic conductors, e.g., θ-(BEDT-TTF)2I3 and κ-(BETS)2FeBr4 [Citation46, Citation47].
x=0.05 salt (β″-(BEDT-TTF) (TCNQ)0.95(F1-TCNQ)0.05)
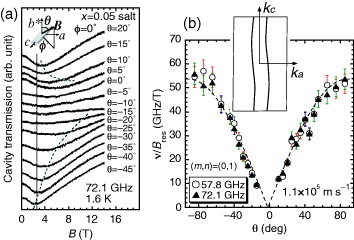
Figure (a) shows the θ dependence of the absorption lines of the x=0.05 salt at φ=0° for T=1.6 K and ν=72.1 GHz. A series of broad resonances was observed and the resonance fields shifted to lower fields with increasing θ. This behavior is quite different from the case of the x=0 salt. The plot of ν/Bres versus θ is shown in figure (b). This angular dependence is similar to that of the (m, n)= (0, 1) mode in figure (c), so that the observed resonances can be attributed to the q1D-PORs. As the angular dependence of q1D-POR for this system is given by equation (Equation2), we can obtain the Fermi velocity from the fitting. The best fit can be obtained with vF=1.1×10⁵ m s−1, as shown by the dashed line in figure (b). This result indicates the existence of q1D-FS originating from the BEDT-TTF layers. We also performed the measurement rotating magnetic field in the a∗b∗-plane to check the existence of q1D-FS originating from the TCNQ layer. However, no resonance was observed in this configuration. Therefore, the q1D-FS originating from the TCNQ layer does not exist at low temperatures in the x=0.05 salt. A schematic picture of the FS of the x=0.05 salt is shown in the inset of figure (b). Although the band calculation of the x=0 salt predicts the existence of q1D-FS from the TCNQ layer, the reason for the absence of TCNQ q1D-FS is not clear at the moment.
Figure 14 (a) θ dependence of transmission spectra of the x=0.05 salt for φ=0°. Sharp absorption lines at around 2.5 T are the ESRs. (b) Plot of ν/Bres versus θ from panel (a). The dashed lines are obtained from the angular dependence of the q1D-POR for the x=0.05 salt. Inset of (b) shows a schematic picture of the low-temperature FS of the x=0.05 salt estimated in the present study.
The origin of the difference in the low-temperature FS between x=0 and the 0.05 salt may be the FS reconstruction as reported in some other systems, e.g. α-(BEDT-TTF)2KHg(SCN)4 and β″-(BEDT-TTF)2AuBr2 [Citation48–50]. It is possible that the origin of the humps (80 and 20 K) is the nesting of the q1D-FS observed in the x=0.05 salt. If imperfect nesting occurs in the x=0 salt, the very small cross-sectional areas of the observed q2D-FSs seem reasonable. It is also reasonable that the kFmax directions of q2D-FSs are almost parallel to the c-axis because the q1D-FS from the BEDT-TTF layer is parallel to the b∗c-plane. Actually, superlattice reflections are observed in the x-ray diffraction measurement at 10 K. Imperfect nesting may yield the electron and the hole FS pockets which have almost equal size, i.e. α- and β-orbits. On the other hand, the x=0.05 salt does not have any hump in the resistivity in the whole temperature region. Hence, it seems that the nesting of q1D-FS does not occur in this salt. This is consistent with our observation of BEDT-TTF q1D-FS.
POR in q1D system
In this section, an example of the POR in q1D system is reported. A coexistence of q1D-POR and q2D-POR in β″-(BEDT-TTF)2CsCd(SCN)4 can be found in [Citation51]. The sample compound measured in this study is (DMET)2I3. DMET denotes dimethylsethylenedithioddiselenadithiafulvalene, which is a non-centrosymmetric molecule synthesized by a half of TMTSF and a half of BEDT-TTF molecules. DMET molecules stack along the b-axis in the crystal and the conducting plane is the ab-plane [Citation52]. The temperature dependence of the resistivity in the zero magnetic field shows a metallic behavior below room temperature, and a superconducting transition occurs around 0.5 K [Citation53]. The results of the ADMRO measurements suggest existence of q1D-FS [Citation54]. In high magnetic fields, the magnetic-field-induced SDW (FISDW) phase appears above 10 T for T=0.5 K. However, the transition field of the FISDW (=BT ) is relatively high compared with typical q1D organic conductors, e.g. BT≈4 T at 0.5 K for (TMTSF)2ClO4. This fact seems to indicate that the dimensionality of the q1D-FS of (DMET)2I3 is higher than that of the TMTSF salt because the BT is basically determined by the nesting property of the q1D-FS. However, the clear differences between the FS of (DMET)2I3 and the FSs of the other q1D systems have not been shown by the ADMRO measurements. Hence, we have performed the magneto-optical measurements to clarify the detailed FS shape of (DMET)2I3. Although preliminary results without using the rotational cavity were reported previously [Citation30, Citation55], we focus on the more precise results obtained using the rotational cavity [Citation22, Citation45, Citation56].
A plate-like sample with the typical dimensions of 0.7×0.4×0.1 mm3 was mounted in the resonant cavity. The quality factor of the cavity was about 10 000. The external dc magnetic field was rotated in the c∗a′-plane with the angle θ and in the ba′-plane with φ, where θ and φ are measured from the c∗- and a′-axes, respectively; a′-axis is the projection of the a-axis to the plane perpendicular to the b-axis, and the c∗-axis is perpendicular to the ba′-plane.
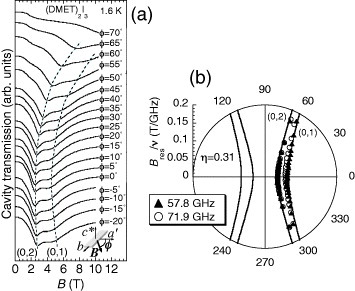
Figures (a) and (b) show the θ dependence of the cavity transmission spectra and their second-derivative curves at 1.6 K and 71.9 GHz, respectively. Magnetic field was rotated in the c∗a′-plane (i.e. φ=0°). Two strong absorption lines and small additional absorption lines were observed as indicated by dashed lines. The positions of absorption lines shift to lower fields as the absolute value of θ increases. This angular dependence is typical for the q1D-POR. The PORs are indicated by the different combinations of integers in figures (a) and (b). There are very weak PORs which are not clear in figure (a), but we can find the angular dependence of those PORs in figure (b).
Figure 15 (a) θ dependence of cavity transmission spectra at 1.6 K and 71.9 GHz for (DMET)2I3 and (b) their second derivative curves for several field angles. Dashed lines are the guides for the eyes.
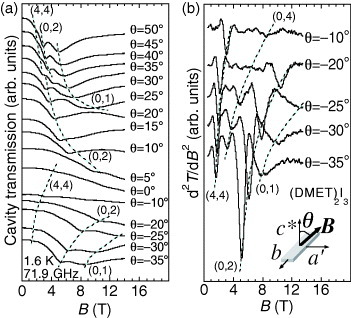
Figure is the plots of observed ν/Bres versus θ. The θ dependence of ν/Bres for q1D-PORs of present systems in this field configuration can be expressed as
Figure 16 Observed θ dependence of ν/Bres. Solid lines were calculated using equations (Equation8) and (Equation9
). Best fit was obtained with the Fermi velocity of 4.0×10⁴ m s- 1.
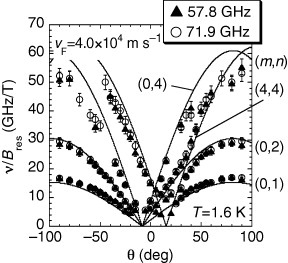
These equations are obtained by the transformation of equation (Equation2). Here, a′ =a sin γ, c∗ is the interlayer distance between the a′b-planes, and a″ is the obliquity parameter given by c∗ tan(β−90°). Taking the Fermi velocity as a free parameter and using the lattice parameters of present systems (a=6.7096 Å, b=7.769 Å, c=15.797 Å, α=90.06°, β=98.15°, γ=78.14° [Citation57, Citation58]), the data points can be fitted by the solid lines in figure . The best fit can be obtained with the Fermi velocity of 4.0×10⁴ m s−1. In the present study, the POR modes corresponding to the combinations of (m,n)= (0,1), (0,2), (0,4) and (4,4) were observed. This is consistent with the ADMRO result because the resistance dips corresponding to m/n=0, 1 and −1 are observed in the ADMRO measurement [Citation54]. Although the POR mode corresponding to m/n=−1 was not detected in our measurement, the observed dip of m/n=−1 was not clear in the ADMRO spectra [Citation54]. Hence, the corrugation of m/n=−1 is not dominant, and the POR corresponding to m/n=−1 may not be observed due to the insufficient sensitivity of the measurement.
In the present study, the high-order PORs corresponding to (m, n)= (0,2), (0,4) and (4,4) were observed. In general, POR intensities are proportional to (ntmn)2, where tmn is the effective transfer integrals [Citation18, Citation59]. Intuitively, the high-order tmn originates from the transfer integral between distant (not nearest neighbor) molecules (e.g. interaction between next-nearest-neighbor molecules). Therefore, it is interesting that the high-order PORs are observed, although the other lower-order PORs (e.g. (m,n)=(±1, 1)) are not observed. We think that the present high-order PORs are not originating from the transfer integrals between distant molecules, but they reflect the characteristic FS shape of the present material. The theory of the POR's angular dependence (i.e. equations (Equation8) and (Equation9
)) is based on the linearized q1D band model near the FS; thus POR measurements may detect the tmn, which are introduced effectively to reproduce the actual band structure. If the actual band structure deviates from a simple cosine function, the quasiparticle orbit has the high-order component of the fundamental frequency. In other words, the actual band structure cannot be described by a simple cosine function but described by the superposition of some appropriate cosine functions; the actual band structure would be expanded by the Fourier coefficients tmn. The origin of the deviation from the simple cosine shape of the FS is not clear at the moment. Further investigation of the detailed band structure may be necessary. Nevertheless, the t±1, 1 may be rather large. Then, the non-observation of the PORs corresponding to (m, n)=(±1, 1) is not clear. One possibility is that the PORs corresponding to n>1 are enhanced by the factor of n2: POR intensities are proportional to (ntmn)2. Therefore, the high-order PORs become easily observable compared with the (±1, 1) PORs even if the high-order tmn are smaller than t±1, 1.
Figure (a) shows the φ dependence of absorption lines at 1.6 K and 71.9 GHz. Because of the q1D electronic structure, resonances shift to the higher fields as φ increases. Figure (b) presents the polar plot of the normalized resonance fields (≡Bres/ν) versus φ revealing slightly curved lines. We can fit the data points with equation (Equation3) as indicated by the solid lines in figure (b). The best fit was obtained with η=0.31. The Fermi velocities estimated from the POR measurements when the magnetic field was rotated in the a′c∗-plane (i.e. 4.0×10⁴ m s−1) are used for the simulations in figure . From the tight-binding band approximation, Fermi velocity is given by
, and
can be obtained for a 1/4 filled band. Therefore, we can estimate the ratio of transfer integrals as
. The obtained value of η leads the ratio ta′/tb=0.13. This value is about 30% larger than the value for (TMTSF)2ClO4 obtained from the third angular effect (TAE) measurement [Citation60]. The transition field of FISDW phase is related to the incompleteness of the nesting of q1D-FS. The incompleteness of the nesting may be strongly related to the magnitude of the ta′/tb: the nesting becomes worse as the magnitude of ta′/tb increases. Moreover, our present results show that the q1D-FS of (DMET)2I3 has high-order corrugations along the interlayer direction. These results indicate that the q1D-FS of (DMET)2I3 has stronger 3D character and is more corrugated compared with the typical q1D system (TMTSF)2ClO4: the PORs corresponding to n>1 are not observed in (TMTSF)2ClO4 [Citation21]. Hence, the nesting of (DMET)2I3 is worse than of (TMTSF)2ClO4, so that the difference of the FISDW transition field can be understood.
Figure 17 (a) φ dependence of cavity transmission spectra when the magnetic field was rotated in the conducting plane. The temperature and the microwave frequency are 1.6 K and 71.9 GHz, respectively. Dashed lines are the guides for the eyes. (b) Polar plot of normalized resonance fields versus φ. Corresponding q1D PORs are indicated by the (m, n). Solid lines were calculated using equation (Equation3), and η of 0.31 was obtained.
Summary
POR measurements is a comprehensive method to the ADMRO measurement and a powerful means to study q2D and q1D FSs of low-dimensional organic conductors. We have shown three typical examples, that is, q2D ((BEDT-TTF)2Br(DIA)), highly anisotropic q2D (β″-(BEDT-TTF)(TCNQ)) and q1D ((DMET)2I3) cases. Especially, in the β″-(BEDT-TTF)(TCNQ)(1−x)(F1-TCNQ)x case, we have shown that we can clearly distinguish the q2D nature of the x=0 system and the q1D nature of the x=0.05 system while the discussion still remains about the relation with the density wave transition in the system. As a whole, the magneto-optical measurement using POR can be a very useful method to study the FS topologies of low-dimensional organic conductors together with SdH, dHvA and ADMRO measurements.
Acknowledgments
We would like to acknowledge H M Yamamoto (RIKEN), R Kato (RIKEN), H Nishikawa (Tsukuba University), K Kikuchi (Tokyo Metropolitan University) and I Ikemoto (Tokyo Metropolitan University) for the sample preparations, K Koyama, M Motokawa (Tohoku University) for the experiments and S Uji (NIMS), K Kishigi (Kumamoto University), S Sugawara and K Kajita (Toho University) for the stimulating discussions. This work was performed at the High Field Laboratory for Superconducting Materials, Institute for Materials Research, Tohoku University. It was partly supported by a Grant-in-Aid for Scientific Research (B) (No. 16340106) from the Japan Society for the Promotion of Science (JSPS) and by Grants-in-Aid for Scientific Research on Priority Area (No. 18028017 ‘Novel Functions of Molecular Conductors under Extreme Conditions’, No. 17072005 ‘High Field Spin Science in 100T’) from the Ministry of Education, Culture, Sports, Science and Technology (MEXT) of Japan. One of the authors (MK) was supported by the Research Fellowship of the Japan Society for the Promotion of Science for Young Scientists.
References
- JéromeDMazaudARibaultMBechgaardK 1980 J. Physique Lett. 41 L95 http://dx.doi.org/10.1051/jphyslet:0198000410409500
- IshiguroTYamajiKSaitoG 1998 Organic Superconductors Berlin Springer
- UjiSShinagawaHTerashimaTYakabeTTeraiYTokumotoMKobayashiATanakaHKobayashiH 2001 Nature 410 908 http://dx.doi.org/10.1038/35073531
- SingletonJ 2000 Rep. Prog. Phys. 63 1111 http://dx.doi.org/10.1088/0034-4885/63/8/201
- SingletonJPrattF LDoportoMJanssenT J B MKurmooMPerenboomJ A A JHayesWDayP 1992 Phys. Rev. Lett. 68 2500 http://dx.doi.org/10.1103/PhysRevLett.68.2500
- KohnW 1961 Phys. Rev. 123 1242 http://dx.doi.org/10.1103/PhysRev.123.1242
- AkiokaKOhtaHKimuraSOkuboSKanodaKMotokawaM 1998 Physica B 246–247 311 http://dx.doi.org/10.1016/S0921-4526(97)90923-6
- OhtaHYamamotoYAkiokaKMotokawaMSasakiTFukaseT 1997 Synth. Met. 86 2011 http://dx.doi.org/10.1016/S0379-6779(97)81002-8
- OhtaHYamamotoYAkiokaKMotokawaMKanodaK 1997 Synth. Met. 86 1913 http://dx.doi.org/10.1016/S0379-6779(97)80961-7
- AkiokaKOhtaHYamamotoYMotokawaMKanodaK 1997 Synth. Met. 86 2051 http://dx.doi.org/10.1016/S0379-6779(97)81022-3
- OhtaHOshimaYNakagawaNAkiokaKOkuboSKanodaK 1999 Synth. Met. 103 1913 http://dx.doi.org/10.1016/S0379-6779(98)00621-3
- OshimaYNakagawaNAkiokaKOhtaHOkuboSTamuraMNishioYKajitaK 1999 Synth. Met. 103 1919 http://dx.doi.org/10.1016/S0379-6779(98)00627-4
- OshimaYOhtaHOkuboSKoyamaKMotokawaMTamuraMNishioYKajitaK 2001 Synth. Met. 120 853 http://dx.doi.org/10.1016/S0379-6779(00)00711-6
- OshimaYOhtaHOkuboSKoyamaKMotokawaMTamuraMNishioYKajitaK 2001 Physica B 294–295 431 http://dx.doi.org/10.1016/S0921-4526(00)00693-1
- HillS 1997 Phys. Rev. B 55 4931 http://dx.doi.org/10.1103/PhysRevB.55.4931
- ArdavanASchramaJ MBlundellS JSingletonJHayesWKurmooMDayPGoyP 1998 Phys. Rev. Lett. 81 713 http://dx.doi.org/10.1103/PhysRevLett.81.713
- HillSBrooksJ SMaoZ QMaenoY 2000 Phys. Rev. Lett. 84 3374 http://dx.doi.org/10.1103/PhysRevLett.84.3374
- McKenzieR HMosesP 1999 Phys. Rev. B 60 R11241 http://dx.doi.org/10.1103/PhysRevB.60.R11241
- KovalevA EHillSQuallsJ S 2002 Phys. Rev. B 66 134513 http://dx.doi.org/10.1103/PhysRevB.66.134513
- KovalevA EHillSKawanoKTamuraMNaitoTKobayashiH 2003 Phys. Rev. Lett. 91 216402 http://dx.doi.org/10.1103/PhysRevLett.91.216402
- TakahashiSHillSTakasakiSYamadaJAnzaiH 2005 Phys. Rev. B 72 024540 http://dx.doi.org/10.1103/PhysRevB.72.024540
- KimataMKoyamaKOhtaHOshimaYMotokawaMNishikawaHKikuchiHIkemotoI 2005 Japan J. Appl. Phys. 44 4930 http://dx.doi.org/10.1143/JJAP.44.4930
- PooleC P Jr 1997 Electron Spin Resonance, A Comprehensive Treatise on Experimantal Techniques 2nd edn New York Dover
- SchramaJ M et al 2001 J. Phys.: Condens. Matter 13 2235 http://dx.doi.org/10.1088/0953-8984/13/10/317
- TakahashiSHillS 2005 Rev. Sci. Instrum. 76 023114 http://dx.doi.org/10.1063/1.1852859
- OsadaTKagoshimaSMiuraN 1992 Phys. Rev. B 46 1812 http://dx.doi.org/10.1103/PhysRevB.46.1812
- TakahashiS et al 2005 Mod. Phys. B 18 3499 http://dx.doi.org/10.1142/S0217979204026895
- HillSTakahashiS 2006 Microwave Spectroscopy of Q1D and Q2D Organic Conductors, The Physics of Organic Superconductors and Conductors Berlin Springer p 457
- SugawaraSUenoTKawasugiYTajimaNNishioYKajitaK 2006 J. Phys. Soc. Japan 75 053704 http://dx.doi.org/10.1143/JPSJ.75.053704
- OshimaYKimataMKishigiKOhtaHKoyamaKMotokawaMNishikawaHKikuchiKIkemotoI 2003 Phys. Rev. B 68 054526 http://dx.doi.org/10.1103/PhysRevB.68.054526
- YamamotoH MYamauraJKatoR 1998 J. Am. Chem. Soc. 120 5905 http://dx.doi.org/10.1021/ja980024u
- UjiSTerashimaTYasuzukaSYamauraJYamamotoH MKatoR 2003 Phys. Rev. B 68 064420 http://dx.doi.org/10.1103/PhysRevB.68.064420
- OshimaYOhtaHKoyamaKMotokawaMYamamotoH MKatoR 2002 J. Phys. Soc. Japan 71 1031 http://dx.doi.org/10.1143/JPSJ.71.1031
- HillS 2000 Phys. Rev. B 62 8699 http://dx.doi.org/10.1103/PhysRevB.62.8699
- PalassisCMolaM MHillSBrooksJ SMaenoYMaoZ Q 2001 Physica C 364–365 386 http://dx.doi.org/10.1016/S0921-4534(01)00804-8
- YamamotoH MMaedaRYamauraJKatoR 2001 J. Mater. Chem. 11 1034 http://dx.doi.org/10.1039/b008170l
- YasuzukaSUjiSYamamotoH MYamauraJTerakuraCTerashimaTYakabeTTeraiYMaedaRKatoR 2005 J. Phys. Soc. Japan 74 679 http://dx.doi.org/10.1143/JPSJ.74.679
- OshimaYOhtaHKoyamaKMotokawaMYamamotoH MKatoRTamuraMNishioYKaijitaK 2003 J. Phys. Soc. Japan 72 143 http://dx.doi.org/10.1143/JPSJ.72.143
- KimataMOshimaYOhtaHKoyamaKMotokawaMYamamotoH MKatoR 2007 Phys. Rev. B 75 045126 http://dx.doi.org/10.1103/PhysRevB.75.045126
- YamamotoH MHagiwaraMKatoR 2003 Synth. Met. 133–134 449 http://dx.doi.org/10.1016/S0379-6779(02)00268-0
- YamamotoH MTajimaNHagiwaraMKatoRYamauraJ-I 2003 Synth. Met. 135–136 623 http://dx.doi.org/10.1016/S0379-6779(02)00808-1
- YasuzukaSTerakuraCTerashimaTYakabeTTeraiYYamamotoH MKatoRUjiS 2003 Synth. Met. 135–136 647 http://dx.doi.org/10.1016/S0379-6779(02)00760-9
- UruichiMYakushiKYamamotoH MKatoR 2006 J. Phys. Soc. Japan 75 074720–1 http://dx.doi.org/10.1143/JPSJ.75.074720
- KimataMOshimaYKoyamaKOhtaHMotokawaMYamamotoH MKatoR 2005 Synth. Met. 153 369 http://dx.doi.org/10.1016/j.synthmet.2005.07.308
- KimataM 2007 Fermiology of low dimensional molecular conductors by magneto-optical measurements Doctor Thesis, Kobe University
- TerashimaTUjiSAokiHTamuraMKinoshitaMTokumotoM 1995 Synth. Met. 70 845 http://dx.doi.org/10.1016/0379-6779(94)02675-O
- KonoikeTUjiSTerashimaTNishimuraMYasuzukaSEnomotoKFujiwaraHFujiwaraEZhangBKobayashiH 2005 Phys. Rev. B 72 094517–1 http://dx.doi.org/10.1103/PhysRevB.72.094517
- KartsovnikM VKovalevA EKushchN D 1993 J. Phys. I 3 1187 http://dx.doi.org/10.1051/jp1:1993264
- IyeYYagiRHanasakiNKagoshimaSMoriHFujimotoHSaitoG 1994 J. Phys. Soc. Japan 63 674 http://dx.doi.org/10.1143/JPSJ.63.674
- HouseA AHarrisonNBlundellS JDeckersISingletonJHerlachFHayesWPerenboomJ A A JKurmooMDayP 1996 Phys. Rev. B 53 9127 http://dx.doi.org/10.1103/PhysRevB.53.9127
- KimataMOhtaHKoyamaKMotokawaMKondoRKagoshimaSTanakaHTokumotoMKobayashiHKobayashiA 2006 J. Phys.: Conf. Ser. 51 359 http://dx.doi.org/10.1088/1742-6596/51/1/084
- YoshinoHSaitoKKikuchiKNishikawaHKobayashiKIkemotoI 1995 J. Phys. Soc. Japan 64 2307 http://dx.doi.org/10.1143/JPSJ.64.2307
- KikuchiKMurataKHondaYNamikiTSaitoKIshiguroTKobayashiKIkemotoI 1987 J. Phys. Soc. Japan 56 3436 http://dx.doi.org/10.1143/JPSJ.56.3436
- UjiSTerakuraCTerashimaTAokiHNishikawaHIkemotoIKikuchiK 1998 Proc. Phys. Phenomena High Magn. Fields (PPHMF) III London World Scientific p 277
- OshimaYKimataMKishigiKOhtaHKoyamaKMotokawaMNishikawaHKikuchiKIkemotoI 2004 Physica B 346–347 387 http://dx.doi.org/10.1016/j.physb.2004.01.112
- KimataMOshimaYKoyamaKOhtaHMotokawaMNishikawaHKikuchiKIkemotoI 2006 J. Low Temp. Phys. 142 523 http://dx.doi.org/10.1007/BF02679560
- AldoshinaM ZAtovmyanL OGol'denbergL MKrasochkaO NLyubovskayaR NLubovskiiR BKhidekel'M L 1986 Dokl. Akad. Nauk SSSR 289 1140 (in Russian)
- IshikawaY 1989 Crystal structure of organic superconductors based on unsymmetrical donor DMET Master Thesis Tokyo Metropolitan University
- BlundellS JSingletonJ 1995 Phys. Rev. B 53 5609 http://dx.doi.org/10.1103/PhysRevB.53.5609
- OsadaTKagoshimaSMiuraN 1996 Phys. Rev. Lett. 77 5261 http://dx.doi.org/10.1103/PhysRevLett.77.5261