Abstract
Comprehensive gene expression analysis using DNA microarrays has become a widespread technique in molecular biological research. In the biomaterials field, it is used to evaluate the biocompatibility or cellular toxicity of metals, polymers and ceramics. Studies in this field have extracted differentially expressed genes in the context of differences in cellular responses among multiple materials. Based on these genes, the effects of materials on cells at the molecular level have been examined. Expression data ranging from several to tens of thousands of genes can be obtained from DNA microarrays. For this reason, several tens or hundreds of differentially expressed genes are often present in different materials. In this review, we outline the principles of DNA microarrays, and provide an introduction to methods of extracting information which is useful for evaluating and designing biomaterials from comprehensive gene expression data.
Introduction
DNA microarrays are tools for analyzing the expression of genes ranging in number from several to tens of thousands at a time. In recent years, DNA microarrays for comprehensive gene analysis of various animal and plant species, including humans, have been commercially available, and have become a widespread technology in genomics research. Comprehensive gene expression analysis with DNA microarrays has also been used in the field of biomaterials, where the main purpose is to evaluate the effects that materials have on cells at the molecular level. In addition, methods have been reported that use comprehensive gene expression analysis to extract material properties that affect cells; their results can provide valuable feedback for designing novel biomaterials.
In many cases, evaluation of biomaterials is performed in vivo after an initial in vitro evaluation. DNA microarrays are frequently used for the evaluation of biomaterials in vitro. Previous reports on biomaterials, which used DNA microarrays in vitro, can be divided in two groups. The first one evaluates the direct effects of biomaterials on cells. Many of these studies consist of comprehensive gene expression analyses of cells cultured on different materials. The effects that each material has on cells are then inferred by identifying genes expressed differentially in the presence of each material. The second group of reports evaluates the indirect effects of biomaterials on cells. In many of these studies, comprehensive gene analyses are performed to elucidate the effects that substances (in many cases metal ions) that leech out from biomaterials (many of which are metal materials) have on cells or tissues at the molecular level. Additionally, for nano-substances, which gained popularity in recent years, comprehensive gene expression analysis with DNA microarrays probes the direct or indirect effects that these substances have on organisms [Citation1–8].
Few studies, however, have used DNA microarrays to evaluate biomaterials in vivo. Generally, comprehensive gene expression analysis is useful only when a single type of cell is being studied. In cases where comprehensive gene expression analysis is performed on tissues comprising 2 or more cell types, the resulting gene expression information is complex, and accurate analysis at the molecular level is difficult. When using DNA microarrays to analyze the effects of biomaterials transplanted into animals, manipulations are necessary for isolating homogeneous cell populations from the tissue receiving the transplant.
Until now, evaluations of the effects of biomaterials on cells at the molecular level have been performed primarily by quantifying the levels of gene expression or protein for several marker molecules. Because the amount of information obtainable by DNA microarrays increases largely, it is crucial to know how to extract and process the necessary information. In this review, we outline methods for comprehensive gene expression analysis using DNA microarrays and introduce their use for evaluating biomaterials. In addition, we discuss analytical methods for obtaining information which is useful for designing biomaterials.
Principles of comprehensive gene expression analysis using DNA microarrays
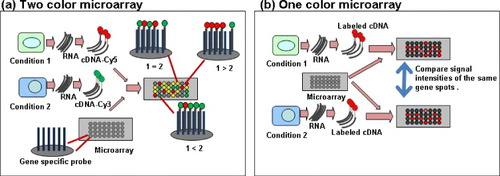
Figure shows the flow of gene expression analysis using DNA microarrays. In general, mRNA is extracted from cells or tissues, and complementary DNA (cDNA) labeled with a fluorescent dye is synthesized by reverse transcription. This cDNA is hybridized with the DNA on microarrays, and the intensity of the fluorescent dye is measured using a confocal laser scanner. We describe each of the processes below.
Figure 1 General schemes of the microarray experiments. (a) Two color microarray experiment. Isolate RNAs from cells or tissues treated in two different conditions. Prepare labeled cDNA (cRNA) samples from these RNAs using two different dyes (e.g. Cy3 and Cy5) for each sample. Mix those two labeled samples before hybridizing with a microarray. The relative expression levels between two conditions of each gene are determined according to the signal intensities of the two dyes. (b) One color microarray experiment. Isolate RNAs from cells or tissues treated in two different conditions. Prepare labeled cDNA (cRNA) samples with a dye (e.g. Cy5) from each RNA. Hybridize those labeled samples with microarrays separately. The relative expression levels between two conditions of each gene are determined according to the relative signal intensities of the two microarrays.
Types of DNA microarrays
Generally, microarrays possess between several and tens of thousands bits of DNA, which are arrayed in high densities on a glass or other solid substrate. The term ‘probe’ is used to refer to the DNA immobilized on a solid substrate, and ‘target’ corresponds to the DNA synthesized from the sample of interest. DNA microarrays can be divided into cDNA microarrays and oligo-DNA microarrays depending on the form of the DNA immobilized on the solid substrate. A cDNA microarray uses double-stranded DNA—obtained by synthesizing cDNA from mRNA and amplifying it with PCR—which is spotted onto a solid substrate at high density. An oligo-DNA microarray utilizes an oligonucleotide which has been synthesized on the solid substrate by photolithography [Citation9]. Since it is possible to immobilize full-length cDNAs as probes on microarrays, they have superior specificity for the target DNA [Citation10]. However, cross-hybridization is a problem which occurs between genes sharing a high degree of sequence homology such as those belonging to gene families. Oligo-DNA microarrays are loaded with oligonucleotide probes, ranging in length between 25 and 70 nucleotides [Citation11–13]. Specific sequences, which are non-overlapping or minimally overlapping, can be synthesized to increase the hybridization sensitivity, since oligo-DNA arrays are designed based on sequence information. Among commercially available oligo-DNA microarrays, those produced by Affymetrix Inc. are known as Gene chips or DNA chips. Affymetrix's GeneChip® 3′ Expression Array is loaded with multiple probes designed from the 3′ terminal sequence of a single gene on its solid substrate. Analytical errors due to cross-hybridization are reduced by measuring multiple probes against the same gene. It is difficult to determine which type of microarrays is more sensitive because there are few data on direct comparison between cDNA microarray and oligonucleotide microarray; however, most commercially available DNA microarrays adopt oligo-DNA type.
Membrane arrays have also been developed, in which DNA is immobilized on nylon membranes [Citation14–16]. Compared with DNA microarrays which utilize solid (glass) substrates, membrane arrays have a larger array area and are sometimes called macroarrays. While membrane arrays have the advantage that they can be repeatedly stripped and reprobed, the maximum number of probe DNA types that can be loaded on an array is approximately 1500, and hence its degree of integration is low.
Labeling of target DNA (aRNA or cRNA)
In gene expression analysis using DNA microarrays, a target DNA labeled with fluorescent dye is hybridized with probe DNA on the DNA microarray, and the fluorescence intensity at each spot is measured with a confocal laser scanner.
When synthesizing cDNA from the mRNA extracted from cells or tissues via a reverse transcription reaction, it is possible to produce fluorescent labels by adding either dUTP (Cy3-dUTP or Cy5-dUTP) or dCTP (Cy3-dCTP or Cy5-dCTP), labeled with Cy3 or Cy5, to the synthesis reaction. Cy3 and Cy5 are water-soluble fluorescent dyes of the cyanine dye family. The emission peak appears around 570 and 670 nm in Cy3 and Cy5, respectively. During reverse transcription from mRNA, rather than incorporation of Cy3 or Cy5 directly into the target DNA, the target DNA can be labeled by synthesizing cDNA which has incorporated amino-allyl-dUTP (aa-dUTP) and coupling it to Cy3 or Cy5 monofunctional dye. Target DNA that has been labeled by this method exhibits stronger fluorescence than DNA which incorporates Cy3 or Cy5 directly [Citation17]. In addition, rather than direct incorporation of fluorescent dye into the target, it is also possible to label the DNA by synthesizing cDNA in the presence of biotinylated UTP or CTP and subsequently binding streptavidin–phycoerythrin to biotin [Citation18].
While the quantity of RNA needed for reverse transcription depends on the size and type of the DNA microarray, the quantity of total RNA should be 15–200 μg (mRNA comprises 1–2% of total RNA). When a sufficient quantity of RNA cannot be obtained from cells or tissues, the RNA can be amplified by in vitro transcription (IVT) [Citation19]. IVT uses T7 RNA polymerase to amplify RNA levels, with the dual-strand cDNA synthesized by an RNA oligo(dT)24-T7 primer (including the T7 promoter sequence) as a template. If amplification is performed twice, mRNA can be amplified around 106 times [Citation20]. The amplified RNA is called antisense RNA (aRNA) or complementary RNA (cRNA). When RNA amplification is performed in the presence of Cy3 (or Cy5)-dUTP (or dCTP), it is possible to obtain a fluorescence-labeled target aRNA (or target cRNA). In addition, it is possible to label aRNA (cRNA) with phycoerythrin, with the incorporation of biotinylated UTP or CTP [Citation18].
For membrane arrays, the target DNA is labeled with a radioisotope (32P) rather than a fluorescence marker; this increases the sensitivity 100–1000 times. Radioisotopes cannot be used in DNA microarrays because signals interfere among probe DNAs if the degree of integration of probe DNAs is high.
Signal detection using hybridization
Labeled target DNAs (aRNA or cRNA) are hybridized with probe DNAs on the DNA microarray. Hybridization is performed either with a two-color method, in which two types of target DNA (aRNA or cRNA) labeled with Cy3 and Cy5 are competitively reacted, or with a one-color method, in which only one type of target DNA (aRNA or cRNA) is reacted (figure ). In the two-color method, a comparison of gene expression between two samples can be analyzed with a single microarray plate. The two-color method is a competitive reaction, so the data obtained are ratios of gene expression levels between the two samples. In the one-color method, the data represent the absolute gene expression levels, and it is necessary to use two microarray plates when comparing gene expression between 2 samples. Differences in experimental conditions between the two microarray plates are therefore a likely source of error.
With the two-color method, the spot fluorescence intensities are analyzed for each sample with a confocal laser scanner. The obtained data include the mean and standard deviation of the signal and background fluorescence intensities. The signal fluorescence is obtained by subtracting the background.
It is often the case that when comparing two samples, the actual quantities of target DNA (aRNA or cRNA) are different, despite attempts to equalize them. In addition, in the two-color method, each of the fluorescent dyes (Cy3 and Cy5) has different color-forming and color-fading characteristics. Because these factors emerge as sources of error in the data, it is necessary to revise the obtained numbers. There are two correction methods [Citation21]: global normalization and internal normalization. Global normalization assumes that the sum of the expressed quantities of all genes is the same for any sample. In other words, corrections are performed by assuming that the total fluorescence intensities of Cy3 and Cy5 are equal for all spots on the DNA microarrays [Citation22, Citation23]. This correction method is effective when the difference in the conditions between the two samples is relatively small, or when analyzing a multitude of genes (tens of thousands). Internal normalization is based on the assumption that the expression levels of specific genes such as housekeeping genes (control genes) do not change between samples [Citation24–26]. In other words, the fluorescence intensity of all spots is corrected so that Cy3 and Cy5 signals are the same for the control genes on the DNA microarray. This correction is effective when the difference in the conditions between the samples is large or when the kinds of genes (spot numbers) on the DNA microarray are few (several hundred to several thousand).
The fluorescence intensity of the two obtained samples is expressed as a ratio Cy3/Cy5 or Cy5/Cy3. After taking base 2 logarithm, this ratio becomes either positive or negative. When using Cy3/Cy5 for example, if Cy3>Cy5 then log2(Cy3/Cy5) is positive; if Cy3<Cy5 then log2(Cy3/Cy5) is negative; and if Cy3=Cy5 then log2(Cy3/Cy5)=0. There is no clear standard on how much the ratios of gene expression must differ between two samples for that difference to be considered real, and the judgment is left to the researcher. It is possible to calculate a statistically significant difference if the experiment is repeated many times, however, if not, it is common to set a cut-off value. In many studies, expression level changes in genes for which the ratio of expression changes more than two to three times are regarded as significant.
Application of DNA microarray analysis to biomaterials evaluation
Evaluation of biomaterials can be carried out in vitro and in vivo. In vitro evaluation is commonly performed as a precursor to in vivo evaluation, and involves evaluations on cell adhesion to biomaterials, cell proliferation, and expression of cell function. Cell adhesion is the first event that occurs during contact between a cell and a substrate. With few exceptions, should cell adhesion not occur, subsequent cell proliferation or expression of cell function also does not take place. Thus, cell adhesion is the minimal condition required for a material to be considered useful. Cell proliferation is affected by the effects of the micro-environment of the material on the cells. If the material is toxic then cell proliferation is blocked. Biomaterials are evaluated by their ability to induce a desired function in a target tissue. Cell adhesion is generally evaluated by microscopic observation. Measures of cell proliferation can be obtained by counting cell numbers, quantifying DNA levels, and with other tests. In addition, the ratio of living cells/dead cells can also be calculated. Cell function is often evaluated by either quantifying marker genes or proteins or by histochemical methods. The evaluation of biomaterials in vivo is conducted primarily using histochemical methods. Comprehensive gene analysis is conducted with DNA microarrays in order to understand cell adhesion, cell proliferation, expression of cell function in vitro, as well as the processes that occur at the molecular-level in cells and tissues which have invaded a transplanted material and/or the area surrounding it in vivo. However, when comprehensive gene expression analysis is used to evaluate biomaterials, each researcher conducts it their own way; general methods of analysis have yet to be established.
Comparison of gene expression between two types of materials
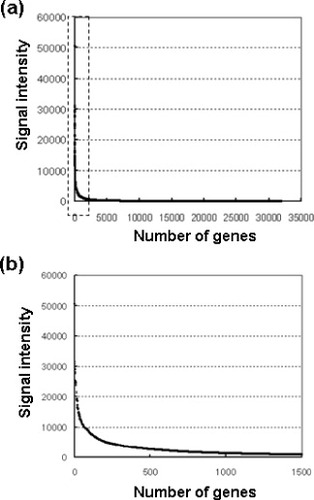
There are approximately 25 000 genes comprising the human genome. These genes can be divided into those that are essential for cell survival and those that are necessary for maintenance of cell function. It is believed that genes belonging to the former class are commonly expressed in all cell types. In contrast, genes in the latter class are believed to be differentially expressed, both in type and in quantity, depending on the cell type. In other words, the genes are regulated so that they are expressed at the required time, at the required place, and at the required level. When comprehensive gene analysis is performed on osteoblasts using DNA microarrays, and genes are sorted according to expression level from high to low (from large to small fluorescence intensities), expression level decreases exponentially (figure ). Only a handful of genes are expressed in large quantities (around several hundred), while expression levels for nearly all other genes is low. Typically, genes with high expression levels represent those that are essential for cell survival, such as housekeeping genes. The expression level of these genes is unlikely to fluctuate substantially even if cellular conditions change. On the other hand, many genes with low expression levels are necessary for proper cell function, and their expression levels have the potential to fluctuate when conditions are altered. This sort of characteristic gene expression is not particular to osteoblasts, but is likely common in all cell types. In other words, when gene expression between two materials is compared, it is often the case that many of the genes for which expression levels fluctuate are those for which expression levels are low to begin with (Hanagata et al unpublished data).
Figure 2 Distribution of the gene expression levels. The vertical axis indicates the signal intensity of the microarray data and the horizontal axis indicates the number of the genes. (a) Genes are sorted according to expression level from highest to lowest (b) Magnification of leaflet in (a) (Hanagata et al unpublished data).
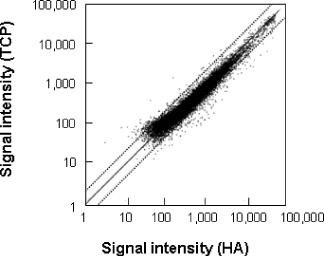
What is the degree of gene expression level fluctuation when a single type of cell is exposed to two different materials? It is easy to imagine that the expression levels of many genes fluctuates when the properties of the materials differs greatly, whereas the number of genes would decrease as the difference in material properties becomes small. We cultured osteoblast-like cells on hydroxyapatite (HA) with a calcium-to-phosphate ratio of 1.67 (Ca/P=1.67), and on tricalcium phosphate (TCP) with a Ca/P of 1.50, and analyzed gene expression using DNA microarrays. The results are presented in figure , where each gene's fluorescence intensity in TCP is plotted on the vertical axis and the fluorescence intensity in HA is shown on the horizontal axis. Among 21 026 analyzed genes, 717 (or 3.4%) increased expression more than twice. Therefore, 96.6% of the genes did not fluctuate in expression as the material changed. In addition, as mentioned previously, many of the genes for which expression levels differed more than twice were those already expressed at low levels.
Figure 3 Scatter plot of the gene expression levels of the cells cultivated on TCP and HA (Hanagata et al unpublished data).
In comparing osteoblasts cultured on HA and TCP, while only 3.4% of all expressed genes change their expression more than twice, this still constitutes a considerable number of 717 individual genes. For comprehensive gene analysis, the key is how to extract useful information from many genes which differ in their level of expression. Methods to extract useful information from gene groups that are differentially expressed between two types of substrate materials can be classified into the following three types:
Genes of interest are selected from the gene groups differing in expression level. Then, based on the functions of the genes, differences in cell function are predicted depending on the material [Citation27–36].
The investigator groups differentially expressed genes on the basis of such criteria as gene function, and from these gene groups infers differences in cell function depending on the material [Citation37–42].
Differences in cell function, depending on the material, are predicted from differentially expressed gene groups using such bioinformatics techniques as Gene Ontology (GO), and from the functions of these gene groups [Citation43–48].
We outline each of these methods below using practical examples.
Methods to extract differentially expressed genes of interest.
Bioactive glass is known to induce bone tissue formation in vitro as well as in vivo. Xynos et al [Citation27, Citation28] found that when Bioglass 45S5 particulates 300–700 μm in diameter were added at a concentration of 1% to Dulbecco's modified Eagle's medium (DMEM) and incubated for 24 h, the Si concentration increased by a factor of 86–87. From this, they inferred that solubilized Si accelerated bone formation from osteoblasts. They then performed an analysis of 1176 osteoblast genes using a nylon membrane array (ATLAS cDNA Microarray Platform) on the effects of solubilized Si on gene expression. They found 60 genes that were upregulated twice or more in osteoblasts cultured for 48 h in DMEM containing Si solubilized from Bioglass. In contrast, only 5 genes were downregulated by 50% or more. Included among the 60 upregulated genes were insulin-like growth factor II (IGF-II), insulin-like growth factor binding protein-3 (IGFBP-3) which is an IGF-II carrier protein, and the proteases metalloproteinase-2 (MMP-2) and cathepsin-D. They therefore postulated that the Si solubilized from Bioglass had activated IGF-II as a result of metalloproteinase-2 (MMP-2) and cathepsin-D cleavage of IGF-II from the carrier protein IGFBP-3, and that this in turn had facilitated osteoblast proliferation and bone formation.
ZrO2 is a bioinert and non-resorbable metal oxide which is used in dental implants or femoral heads in total replacements. When the surface of a ZrO2 disc is coated with a colloidal suspension of ZrO2, bone formation by osteoblasts is accelerated. The surface of an uncoated ZrO2 disc is irregular and contains small, randomly distributed crystals. However, the surface of a coated ZrO2 disc is cracked with large crystals nearly evenly distributed. Sollazzo et al [Citation29] cultured osteoblast-like MG63 cells on a ZrO2 disc or on a colloidal suspension-coated ZrO2 disc for 24 h, and then analyzed 20 000 genes using a microarray. Eighty-one genes on the coated ZrO2 disc were significantly upregulated, while 42 had significantly decreased expression. Among the upregulated genes were early growth response 2 (ERG2), involved in bone remodeling, the transcription factor DLX2, whose expression is spatially and temporally regulated in craniofacial primordial, a leptin receptor (LEPR), involved in osteoblast differentiation and bone formation, and FC-alpha receptor or CD79B, involved in the immune system. Among the downregulated genes were the transcription factor interleukin enhancer binding factor 2 (ILF2) or the F11 receptor (F11R), which controls cell adhesion. It was surmised that in the coated ZrO2 disc, fluctuations in the expression of these genes contributed to osteoblast activation.
The roughness of a material's surface reportedly affects the physiological interactions between bone and the transplanted material. The interaction between a rough surface and osteoblasts is not clear; some reports have shown that rough surfaces stimulate the differentiation of osteoblasts, while other reports suggest this is not the case. Leven et al [Citation30] cultured stromal cells prepared from rat bone marrow for 24 and 48 h on Ti6Al4 V discs with a roughness (Ra) of 0.14 μm (Ra(0.14)) and 5.8 μm (Ra(5.8)), and analyzed 1633 genes using a membrane microarray (Research Genetics GF300 nylon microarray). Comparing Ra(5.8) to Ra(0.14) at 24 h, expression levels of 268 genes were at least twice higher, while expression of 17 genes was at least twice lower. Comparing Ra(5.8) to Ra(0.14) at 48 h showed that expression levels of 153 genes were at least twice higher, while expression of 21 genes was at least twice lower. Among the genes which were differentially expressed, the authors extracted bone-related genes, cartilage-related genes, collagens, integrins and integrin ligand genes, BMPs, BMP receptors and the Smad transcription factor, and phospholipases and kinases, and then compared expression changes over time. They, consequently, concluded that the surface roughness of Ti6Al4 V alloy has a large effect during the early stages of culturing, and that the rougher the surface, the greater the number of upregulated genes.
Schwann cells perform an important role in regenerating nerves. When these cells are cultured in nano-fiber scaffolds, they extend in the direction of the fibers. Chew et al [Citation31] cultured human Schwann cells for 7 days on a poly (ε-caprolactone) (PCL) films—an aligned PCL produced by electrospinning, and randomly oriented PCL—and analyzed the expression of 101 genes using a microarray. When gene expression levels for aligned PCL and that for randomly oriented PCL were comparable, 86–87% of the genes did not differ in expression, while expression levels for approximately 12% of the genes decreased in aligned PCL and randomly oriented PCL. Few upregulated genes, interleukin 10 (IL-10) and leukemia inhibitory factor (LIF), were upregulated in aligned PCL, and STAT4 was upregulated in randomly oriented PCL. This particular microarray is used as a tool for goal-directed gene analysis and is loaded only with neurotrophin and receptor genes, therefore it can analyze only a limited number of genes. When myelin-specific genes and immature Schwann cell marker genes were examined with real-time quantitative PCR, the expression level for myelin-associated glycoprotein (MAG) increased in both aligned and randomly oriented PCLs. However, the expression level for myelin protein zero (P0)—expressed in the late stages of myelin differentiation aligned—increased only in aligned PCL. In addition, the expression levels of neural cell adhesion molecule 1 (NCAM-1), an immature Schwann cell marker, decreased in both aligned and randomly oriented PCLs. These results suggest that the upregulation of P0 accelerated Schwann cell maturation in aligned PCLs. DNA microarrays for goal-directed gene analysis have also been reported by Chen et al [Citation32], who investigated the effects of a chitosan scaffold co-conjugated with chondroitin-6-sulfate/dermatan sulfate (CSC/DS) on cartilage cells using an array loaded with only 113 genes involved in signal transduction. It was revealed that CSC/DS activates the TGF-β and hedgehog pathways and thereby facilitates the differentiation of cartilage cells.
Methods to extract the genes of interest can provide gene-level explanations regarding differences in cell function that are due to the influence of materials. However, because the selection of genes is subjective, interpretation tends to be biased.
Method in which researchers differentially expressed genes based on own criteria.
In this method, it is possible to capture overall trends by creating gene groups that differ in expression level. The criteria for grouping the genes identified by microarrays differ depending on the investigator. Carinci et al examined the effects of a titanium alloy [Citation37], ZrO2 [Citation38] and calcium sulfate [Citation39] on human osteoblast-like MG63 cells using microarrays. While titanium or titanium alloys are used as implant materials in plastic surgery and dentistry, the effects of these materials on osteoblasts are unknown. Gene expression analysis was therefore performed on MG63 cells cultured for 24 h on a Ti6Al4 V disc or Falcon well using a DNA microarray [Citation37]. The number of genes significantly upregulated or downregulated in the titanium alloy relative to that in the Falcon well were 40 and 23, respectively. The functions of these genes varied widely, including roles in apoptosis, vesicular transport, and structural function. It was suggested that the biocompatibility of the titanium alloy was due to these gene functions. No appreciable difference in gene expression was seen in MG63 cells cultured in a medium with titanium alloy dust particles compared to cells cultured on a Ti6Al4 V disc. Therefore, is likely that the form of the titanium alloy does not affect MG63 cells in a material way. When gene expression levels in MG63 cells cultured on a ZrO2 disc and in a Falcon well were compared, expression levels in the ZrO2 disc were high in gene groups involved in cell cycle control, immunity, and extracellular regulation; while expression was low in gene groups involved in vesicular transport, the cytoskeleton, cell cycle regulation and immunity [Citation38]. The variable expression of genes involved in immunity may relate to inflammatory reactions. In addition, fluctuations in genes associated with vesicular transport have been confirmed in the presence of Ti6Al4 V as well as ZrO2. Gene groups possessing vesicular transport functions are considered to play an important role in the production and homeostasis of extracellular substrates associated with bone formation. Calcium sulfate is used for periodontal disease, alveolar bone loss, endodontic lesions, and maxillary sinus augmentation. Calcium sulfate dissolves in body fluids, and Ca ions bind to phosphates to become calcium phosphate, which is then deposited on the bone surface. It is thought that this deposited calcium phosphate can activate osteoblasts, although it is not known how gene expression changes in response. Carinci et al [Citation39] added calcium sulfate to MG63 cells cultured in Falcon wells to a concentration 1 μg ml−1, and then examined changes in gene expression 24 h later using a microarray. It was found that expression levels for approximately 100 genes increased, and these could be grouped according to such functions as cell-cycle regulation, signal transduction, immunity, and lysosomal enzyme production. Lysosomal enzymes are involved in turnover of the extracellular matrix. These studies suggest that, at least in osteoblasts, Ti6Al4 V, ZrO2, or calcium sulfate, affects the reorganization of extracellular substrates.
Klapperich and Bertozzi [Citation41] analyzed gene expression of human fibroblast cell lines cultured in a collagen-glycosaminoglycan (Collagen/GAG) scaffold possessing a mesh structure using a microarray, and compared it to that of cells cultured in a polystyrene dish. When IMR-90 human fetal lung fibroblast cells were cultured in a Collagen/GAG scaffold, by 48 h the mesh structure had contracted due to cells pulling on the Collagen/GAG fibers, while at 96 h the mesh structure was no longer observed. A total of 1018 genes were identified that showed a difference in expression from 1 to 48 h from the start of culturing. These could largely be classified into chemokines/cytokines, angiogenesis-related genes, cell-adhesion genes, and extracellular matrix remodeling genes. Chemokines are involved in inflammation and blood vessel growth. The expression level of the cytokine vascular endothelial growth factor (VEGF) is high in Collagen/GAG. In contrast, expression levels for thrombospondin-1 (THBS1) and thrombospondin-2 (THBS2), which block angiogenesis, were low in Collagen/GAG. These findings suggest that Collagen/GAG with a mesh structure promotes angiogenesis and possesses superior characteristics as a scaffold.
Based on these studies, methods for considering genes by group formation can more likely evaluate the properties of each material from a broader perspective compared to the aforementioned method of selecting specific genes, since they ultimately analyze a much larger number of genes. Nonetheless, it must be said that because the gene group selection is based on the subjectivity of the investigator, the problem of the compatibility of data and conclusions among researchers still remains.
Methods for grouping differentially expressed genes using bioinformatics techniques such as gene ontology.
In methods in which the investigators themselves extract or group genes that show differential expression, the results are more readily influenced by investigators’ subjectivity. To avoid this, methods have been developed to classify genes differentially expressed according to their functions using bioinformatics techniques. For functional classification of genes, Gene Ontology (GO) is the most frequently used method [Citation49]. GO classifies gene functions into the three broad categories of ‘Biological Process’, ‘Cellular Function’ and ‘Molecular function’. Each category has a hierarchical structure, and can further classify gene functions in more detail. In GO, genes are classified into functional categories based on the functional annotation of each gene. The concordance rate (P-value) between each category of GO and the functional annotation of each gene is calculated by Fisher's exact test [Citation50].
Lü et al [Citation43] investigated the effects of Ni(II) released from NiTi alloys, commonly used in orthodontic and orthopedic implants, on cells using DNA microarrays, and classified differentially expressed genes using Gene Ontology. NiCl2·6H2O was added to a culture of mouse fibroblast L-929 cells to a final concentration of 200 μmol l−1, and the expression of 14 112 genes was analyzed with a DNA microarray 24, 48 and 72 h later. The number of genes upregulated at least twice as a result of adding Ni(II) was 212 at 24 h, 630 at 48 h and 512 at 72 h. The number of genes downregulated at least twice was 424 at 24 h, 686 at 48 h and 584 at 72 h. The number of genes up- or downregulated at all time points (24, 48 and 72 h) were 20 and 19, respectively. Of these genes, those included in the GO category of ‘Biological process’ whose expression level had increased were classified into such functions as cell differentiation, cell death, apoptosis, and cholesterol metabolism. Genes that were downregulated with Ni(II) were classified into such functions as cell proliferation (including cell adhesion), cell cycle, cell differentiation, cellular physiological process and metabolism. From these observations, it can be concluded that Ni(II) affects cell differentiation, and specifically has a negative effect on cell proliferation. It is known that 300 μmol l−1 of Ni(II) decreases cell proliferation by approximately 50% after exposure for 72 h.
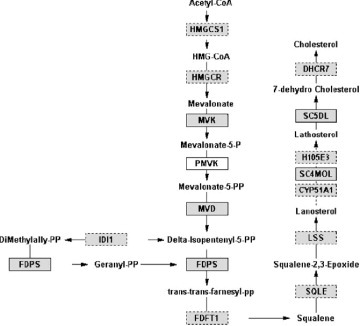
Mueller et al [Citation44] analyzed the effects of ferrous ion (Fe(II)), which leeches out of stent materials used in cardiovascular surgery, on smooth muscle cells using a DNA microarray loaded with 22 283 probes, and performed a functional classification of differentially expressed genes using GO. Smooth muscle cells isolated from human umbilical cord vein were cultured in media with or without Fe(II)-gluconate-dihydrate. When gene expressions were compared for each condition, it was found that the number of probes, which had increased or decreased expression 1.5 times or more, was 251 and 306, respectively. When upregulated genes were analyzed using GO, many genes were associated with cell death, synthesis of cell membranes, and cholesterol metabolism. This is likely due to the need to repair cell membranes damaged by the radicals generated from the excess Fe(II) that had leeched out. A GO analysis of downregulated genes revealed many genes involved in the cell cycle and DNA replication, suggesting that Fe(II) decreases cell proliferation (figure ). It is known that proliferation and DNA synthesis of smooth muscle cells can be blocked in a concentration-dependent manner by Fe(II). In addition, the authors performed pathway analysis using the Gene Map Annotator and Pathway Profiler (GenMAPP) program (Dahlquist et al 2002) and confirmed that many of the upregulated genes were involved in the cholesterol synthesis and lipid metabolism pathways, while many genes that had decreased were involved in the cell cycle (figure ). Pathway analysis allows to obtain information on intermolecular interactions using such databases as Kyoto Encyclopedia of Genes and Genomes (KEGG).
Figure 4 Downregulated genes in the presence of excess Fe(II) were clustered into biological process by using GO program. (Reprinted with permission from [Citation44], Elsevier Ltd © 2005.)
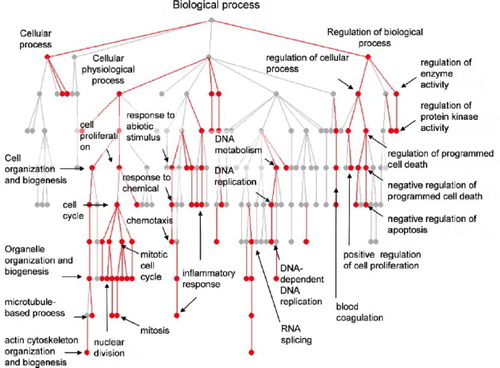
Figure 5 Upregulated genes (shaded rectangles) and genes not found (colorless rectangles) in the cholesterol biosynthesis pathway. The figure has been adapted from KEGG by GenMAPP. (Reprinted with permission from [Citation44], Elsevier Ltd ©2005.)
Kojima et al [Citation45] transplanted Ti materials with a rectangular inner-chamber structure into the femur of rats, and conducted expression analysis of 20 000 genes in tissue that had invaded the chamber using a DNA microarray. KEGG pathway analysis was performed on the obtained expression data, and it was found that many of the differentially expressed genes are involved in ECM–Receptor interactions.
Schweikl et al [Citation46] investigated the effects of triethylene glycol dimethacrylate (TEGDMA), a dental resin material, added to a culture solution of human skin fibroblasts, using a DNA microarray loaded with 22 227 probes. They processed gene expression data using GO and Ingenuity Pathway Analysis (IPA) tools for functional network analysis. It was found that many of the differentially expressed gene groups were involved in cell cycle turnover, cell cycle checkpoint regulation, and cell death.
Shimizu et al [Citation47] performed a functional classification of differentially expressed genes using GO and Medical Subject Headings (MeSH). The latter was chosen for its advantage of producing anatomical and disease information with respect to the gene of interest. TiO2 nano-particles were subcutaneously injected into pregnant mice, and the effects on the brains of male embryos and healthy new-born mice were examined using a DNA microarray loaded with 16 192 probes. It was found that in the brains of 16 day old embryos, expression of 229 genes increased while that of 233 genes decreased. Two, 7, 14 and 21 days after birth, expression levels for 234, 351, 450 and 613 genes increased, while they decreased for 630, 66, 288 and 1274 genes. When performing functional classification of these genes, both the P-value and the enrichment factor [defined as (nf/n)/(Nf/N)] were used as criteria. Here, nf is the number of genes in a random GO or MeSH category for which there is a difference in expression level, n is the total number of genes within that category, Nf is the number of genes for which there is a difference in the microarray, and N is the total number of genes loaded on the microarray. In the GO analysis, it was found that many genes were affected in the brains of mice born from TiO2-injected pregnant mice, including those involved in brain development and motor activity at post-natal days (PD) 2–14, those involved with apoptosis at PD 2–21, and those involved in oxidative stress at PD 14–21. When functional classification was performed with MeSH, affected genes included those associated with mitochondrial or synaptic function as well as oxidative stress or brain-related disorders from embryos to PD 21, and those associated with apoptosis or neurotransmitters at PD 14–21.
In this method as well, the properties of each material can be evaluated in a broader perspective because many genes are eventually used in the evaluation. In addition, since everyone has access to the same database, the compatibility of the conclusions among researchers is naturally higher. It is hoped that the establishment of public databases and informatics tools will further advance in the future. We think that the interpretation of microarray data using this method will become commonplace.
Comparisons of gene expression between multiple types of material
When comparing gene expression between cells cultured on two types of material, it is sufficient to extract genes with high (or low) expression levels from each material. However, comparing gene expression between multiple types of materials is a complex assignment. For example, with 3 materials A, B and C, the combinations of differentially expressed genes includes 6 patterns: genes with high expression levels in A, in B, in C, in A and B, in A and C and in B and C. Thirteen patterns arise when comparing 4 types of materials, and 25 for 5 types. Such gene groupings can be obtained by means of statistical analyses known as clustering. Among several alternatives, hierarchical and K-means clustering algorithms are frequently used in comprehensive gene analyses. In hierarchical clustering, gene expression levels in n types of material are plotted on an n-dimensional coordinate system, and the distances between all plotted genes are calculated with distance matrices. Within this space, nearby genes are grouped and then the range of distances is expanded. By repeating calculations until all genes are included, it is possible to form gene groupings. In K-means clustering, the number of clusters is specified in advance, and each gene is then allocated to a random cluster. The expression level and distance from the center of the cluster is calculated for each gene. From this distance, every gene is re-allocated to the nearest cluster, and the centers of the clusters are recalculated. This procedure is repeated until the cluster centers stop fluctuating. While K-means clustering requires less calculation time than hierarchical clustering, which calculates distances between all genes, it does not yield information on the relation between genes. Hierarchical clustering, on the other hand, requires longer calculation because it evaluates distances among all genes. Therefore, genes that do not show significant changes are often excluded from the calculations in advance. In addition, relations between materials can be clustered based on similarities in the comprehensive gene expression pattern.
Cluster analysis of genes.
Kim et al [Citation51] performed gene expression analysis on osteoblast-like MG63 cells cultured on 6 types of titanium-based surfaces using a nylon membrane array. The prepared surfaces were smooth Ti (S), sandblasted large-grit and acid-etching Ti (SLA), hydroxyapatite thin-coating Ti (HA), hydroxyfluoride coating Ti (HF), titanium nitrate coating Ti (TiN), and diamond-like carbon coating Ti (DLC). Mg63 cells were cultured for 72 h on these surfaces, and 1152 genes were analyzed using a microarray, followed by gene groupings by hierarchical clustering. The expression of bone formation-related genes was found to increase in S and HA, the expression of genes associated with cell adhesion and the cell cycle increased in SLA, and the expression of genes which induce inflammation increased in TiN and DLC. This analysis suggests that these dental implant materials could differentially affect osteoblasts.
Cluster analysis of materials based on similarities in gene expression pattern.
As described above, it is possible to group genes using cluster analysis of data obtained from DNA microarrays. Similarly, it is possible to discover relationships among materials by performing cluster analysis based on the similarity of gene expression patterns.
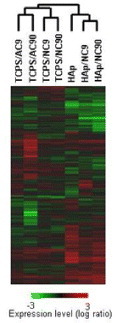
Hanagata et al [Citation52] coated polystyrene dishes (TCPS) and hydroxyapatite discs (HAp) with a Type I collagen of different density and structure. Mouse osteoblast-like MC3T3 cells were cultured for 20 days on these surfaces, and gene expression was analyzed using a DNA microarray. Of the 22 917 genes analyzed, 1061 genes were extracted which showed at least two-fold differential expression between the two surfaces; and gene expression profiles were obtained by performing hierarchical cluster analysis. In addition, surfaces were grouped based on similarities in gene expression pattern, and the dendrogram of figure was obtained. This dendrogram shows that TCPS/AC9 and TCPS/AC90 form a small group and have highly similar gene expression patterns. The difference between these two surfaces is the density of the collagen coating placed on TCPS (9 and 90 after AC and NC represent the densities of the coated collagen, obtained after preabsorption with 9 or 90 μg ml−1 of collagen from acid (AC) or neutral (NC) solution). Since the gene expression patterns are very similar, the density of the coated collagen does not have strong influence on osteoblast gene expression. Similarly, TCPS/NC9 and TCPS/NC90, as well as HAp/NC9 and HAp/NC90, each form small groups, indicating the high similarity of gene expression patterns within each group. The small group of TCPS/AC9 and TCPS/AC90 forms a larger group with the small group of TCPS/NC9 and TCPS/NC90. The difference between the former small group and the latter small group is in the structure of the coated collagen (AC and NC represent collagens with mesh or fiber structures, respectively). In other words, when the structure of the coated collagen differs, the similarity of gene expression pattern decreases slightly. Therefore, it can be concluded that the structure of the coated collagen has a greater influence on osteoblasts than the density of the coated collagen. When the four TCPS surfaces coated with collagens of different density and structure are regarded as a group, HAp, HAp/NC9 and HAp/NC90 can be considered as a separate group. The similarity in gene expression patterns between these two large groups is low. The difference between these two large groups is that the material coated with collagen was either TCPS or HAp. Thus, the material coated by collagen has the greatest influence on osteoblasts.
Figure 6 Hierarchical clustering tree illustrates the expression similarity of the 1016 differentially expressed genes. Logarithmic ratios to expression levels in TCPS are indicated by the color bar. (Reprinted with permission from [Citation52], Wiley Periodicals, Inc. ©2007.)
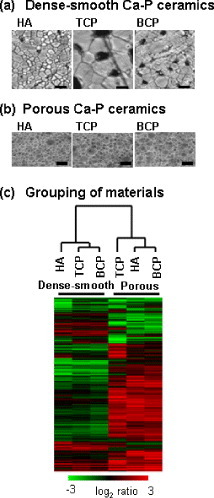
Clinical application of calcium phosphate ceramics, including hydroxyapatite as an artificial bone-replacement material, is in progress. Zhang et al [Citation53] investigated which factor had a greater effect on osteoblasts: the chemical composition of calcium phosphate ceramics (the ratio of calcium to phosphate) or the ceramic structure. Osteoblast-like MC3T3 cells were cultured for 20 days on dense-smooth HA (Ca/P=1.67), tricalcium phosphate (TCP, Ca/P=1.50), and biphasic calcium phosphate (BCP, Ca/P=1.60), as well as on multi-pore-structured HA, TCP, and BCP; and gene expression analysis was performed using a DNA microarray. In a cluster analysis based on the similarity of gene expression patterns, the calcium phosphate ceramics were divided into two groups. As shown in figure , the first group was comprised of dense-smooth HA, TCP, and BCP, while the other consisted of multi-pore HA, TCP, and BCP. This result implies that in calcium phosphate ceramics, the structure, rather than the ratio of calcium to phosphate, has a greater influence on osteoblasts.
Figure 7 Grouping of calcium phosphate ceramics (Ca-P) based on similarities of gene expression patterns. (a) Surface of dense-smooth Ca-P observed using an atomic force microscope. (b) Surface of porous Ca-P observed using a scanning electron microscope. (c) The relationship between the Ca-P based on similarities in gene expression patterns is indicated by the tree [Citation53].
By grouping materials based on the similarity of gene expression patterns, and discovering the characteristics of materials which differ between groups, it is possible to extract useful data for designing of materials that affect cellular functions. While there has been little research on the application of comprehensive gene expression analysis to biomaterials design, the method has been garnering attention as an effective means to provide crucial data needed for the rational design of biomaterials.
Directions for future research
Many applications of DNA microarrays to biomaterials involve research on the effects that each material has on cells at the molecular level; this research is based on genes or gene groupings which show differential expression between materials exposure. In recent years, it has been shown that by grouping materials based on comprehensive gene expression data obtained with microarrays, it is possible to extract the characteristics of materials that influence cell behavior. By feeding these data back to materials design, it should be possible to assist rational biomaterials design processes.
Most biomaterials evaluations, based on the DNA microarray based comprehensive gene analysis, have been performed using in vitro experiments. However, evaluations obtained with in vitro experiments do not necessarily agree with those generated in vivo. While gene expression analysis is efficient for single cell types, the data lose meaning for tissues which are comprised of non-homogeneous mixtures of cell types. Evaluations in vivo often analyze tissue that has invaded or which surrounds a transplanted biomaterial. Therefore, histochemical analyses are often performed with in vivo evaluations. It is possible to excise specific cell types from tissues using laser microdissection, however, excising the large number of cells necessary for a comprehensive gene analysis requires enormous efforts. In the future, it is hoped that the combination of laser dissection with techniques for RNA amplification will improve technologies for molecular-level analysis of the effects of transplanted biomaterials on specific cell types, and hence expand the range of applications for comprehensive gene expression analyses based on DNA microarrays in in vivo evaluations.
In addition to the transcriptional regulation in mRNA, it is shown that post-transcriptional regulation is also involved in the cellular function affected by materials [Citation54]. The post-transcriptional regulation cannot be analyzed using DNA microarray, but several manufacturers produce microRNA microarray. Recent studies using the array indicate that materials affect the expression of microRNA which plays a critical role in post-transcriptional regulation [Citation55–64]. In the future, it is expected that microRNA expression data will also contribute to the evaluation and design of biomaterials.
References
- KawataKOsawaMOkabeS 2009 Environ. Sci. Technol. 43 6046 http://dx.doi.org/10.1021/es900754q
- WatersK MMasielloL MZangarR CTarasevichB JKarinN JQuesenberryR DBandyopadhyaySTeeguardenJ GPoundsJ GThrallB D 2009 Toxicol. Sci. 107 553 http://dx.doi.org/10.1093/toxsci/kfn250
- HiranoSKannoSFuruyamaA 2008 Toxicol. Appl. Pharmacol. 232 244 http://dx.doi.org/10.1016/j.taap.2008.06.016
- ChaKHongH WChoiY GLeeM JParkJ HChaeH KRyuGMyungH 2008 Biotechnol. Lett. 30 1893 http://dx.doi.org/10.1007/s10529-008-9786-2
- RouseR LMurphyGBoudreauxM JPaulsenD BPennA L 2008 Am. J. Respir. Cell Mol. Biol. 39 198 http://dx.doi.org/10.1165/rcmb.2008-0057OC
- InoueKTakanoHOhnukiMYanagisawaRSakuraiMShimadaAMizushimaKYoshikawaT 2008 Int. J. Immunopathol. Pharmacol. 21 197
- UsenkoC YHarperS LTanguayR L 2008 Toxicol. Appl. Pharmacol. 229 44 http://dx.doi.org/10.1016/j.taap.2007.12.030
- ZhangYHuZYeMPanYChenJLuoYZhangYHeLWangJ 2007 Eur. J. Pharm. Biopharm. 66 268 http://dx.doi.org/10.1016/j.ejpb.2006.11.003
- FodorS P ARavaR PHuangX CPeaseA CHolmesC PAdamsC L 1993 Nature 364 555 http://dx.doi.org/10.1038/364555a0
- BilbanMHeadSDesoyeGQuarantaV 2000 Placenta 21 (Suppl A) S99 http://dx.doi.org/10.1053/plac.1999.0517
- FambroughDMcClureKKazlauskasALanderE 1999 Cell 97 727 http://dx.doi.org/10.1016/S0092-8674(00)80785-0
- LipshutzR JFodorS P AGingerasT RLockhartD J 1999 Nat. Genet. 21 20 http://dx.doi.org/10.1038/4447
- ShoemakerD DLashkariD AMorrisDMittmannMDavisR W 1996 Nat. Genet. 14 450 http://dx.doi.org/10.1038/ng1296-450
- ChenJ J et al 1998 Genemics 51 313 http://dx.doi.org/10.1006/geno.1998.5354
- HanJYooH YChoiB HRhoH M 2000 Biochem. Biophys. Res. Commun. 272 525 http://dx.doi.org/10.1006/bbrc.2000.2801
- LyakhovichA et al 2000 Biochem. Biophys. Res. Commun. 273 675 http://dx.doi.org/10.1006/bbrc.2000.2998
- IidaKNishimuraI 2002 Crit. Rev. Oral Biol. Med. 13 35 http://dx.doi.org/10.1177/154411130201300105
- CollerH A et al 2000 Proc. Natl Acad. Sci. USA 97 3260 http://dx.doi.org/10.1073/pnas.97.7.3260
- KacharminaJ ECrinoP BEberwineJ 1999 Methods Enzymol. 303 3 http://dx.doi.org/10.1016/S0076-6879(99)03003-7
- EberwineJ et al 1992 Proc. Natl Acad. Sci. USA 89 3010 http://dx.doi.org/10.1073/pnas.89.7.3010
- DugganD JBittnerMChenYMeltzerPTrentJ M 1999 Nat. Genet. 21 10 http://dx.doi.org/10.1038/4434
- HardwickJ SKuruvillaF GTongJ KShamjiA FSchreiberS L 1999 Proc. Natl Acad. Sci. USA 96 14866 http://dx.doi.org/10.1073/pnas.96.26.14866
- RossD T et al 2000 Nat. Genet. 24 227 http://dx.doi.org/10.1038/73432
- LashkariD A et al 1997 Proc. Natl Acad. Sci. USA 94 13057 http://dx.doi.org/10.1073/pnas.94.24.13057
- LoftusS K et al 1999 Proc. Natl Acad. Sci. USA 96 9277 http://dx.doi.org/10.1073/pnas.96.16.9277
- StephanD A et al 2000 Mol. Genet. Metabol. 70 10 http://dx.doi.org/10.1006/mgme.2000.2989
- XynosI DEdgarA JButteryL D KHenchL LPolakJ M 2000 Biochem. Biophys. Res. Commun. 276 461 http://dx.doi.org/10.1006/bbrc.2000.3503
- XynosI DEdgarA JButteryL D KHenchL LPolakJ M 2001 J. Biomed. Mater. Res. 55 151 http://dx.doi.org/10.1002/1097-4636(200105)55:2<151::AID-JBM1001>3.0.CO;2-D
- SallazzoVPalmieriAPezzettiFBignozziC AArgazziRMassariLBrunelliGCarinciF 2008 J. Biomed. Mater. Res. B 84 550
- LevenR MVirdiA SSumnerD R 2004 J. Biomed. Mater. Res. A 70 391 http://dx.doi.org/10.1002/jbm.a.30082
- ChewS YMiRHokeALeongK W 2008 Biomaterials 29 653 http://dx.doi.org/10.1016/j.biomaterials.2007.10.025
- ChenYChenHChanHChuangCChangYHuY 2008 Biotechnol. Bioeng. 101 821 http://dx.doi.org/10.1002/bit.21953
- YamanichiNPugdeeKChangWLeeSYoshinariMHayakawaTAbikoY 2008 Dent. Mater. J. 27 744 http://dx.doi.org/10.4012/dmj.27.744
- WangWItakaKOhbaSNishiyamaNChungUYamasakiYKataokaK 2009 Biomaterials 30 2705 http://dx.doi.org/10.1016/j.biomaterials.2009.01.030
- MatsuokaATsuchiyaT 2004 J. Biomed. Mater. Res. A 68 376 http://dx.doi.org/10.1002/jbm.a.20068
- NguyenK TShaikhNWawroDZhangSSchwadeN DEberhartR CTangL 2004 J. Biomed. Mater. Res. A 69 513 http://dx.doi.org/10.1002/jbm.a.30020
- CarinciFVoliniaSPezzettiFFranciosoFTosiLPiattelliA 2003 J. Biomed. Mater. Res. B 66 341 http://dx.doi.org/10.1002/jbm.b.10021
- CarinciFPezzettiFVoliniaSFranciosoFArcelliDFarinaEPiattelliA 2004 Biomaterials 25 215 http://dx.doi.org/10.1016/S0142-9612(03)00486-1
- CarinciFPiattelliAStabelliniGPalmieriAScapoliLLainoGCaputiSPezzettiF 2004 J. Biomed. Mater. Res. B 71 260 http://dx.doi.org/10.1002/jbm.b.30133
- CarinciFPezzettiFVoliniaSFranciosoFArcelliDMarchesiniJCaramelliEPiattelliA 2004 Clin. Oral Implants Res. 15 180 http://dx.doi.org/10.1111/j.1600-0501.2004.00997.x
- KlapperichC MBertozziC R 2004 Biomaterials 25 5631 http://dx.doi.org/10.1016/j.biomaterials.2004.01.025
- KuCBrowneMGregsonPCorbeilJPiolettiD P 2002 Biomaterials 23 4193 http://dx.doi.org/10.1016/S0142-9612(02)00161-8
- LüXBaoXHuangYQuYLuHLuZ 2009 Biomaterials 30 141 http://dx.doi.org/10.1016/j.biomaterials.2008.09.011
- MuellerP PMayTPerzAHauserHPeusterM 2006 Biomaterials 27 2193 http://dx.doi.org/10.1016/j.biomaterials.2005.10.042
- KojimaNOzawaSMiyataYHasegawaHTanakaYOgawaT 2008 Clin. Oral Implants Res. 19 173 http://dx.doi.org/10.1111/j.1600-0501.2007.01432.x
- SchweiklHHillerK-AEckhardtABolayCSpagnuoloGStempflTSchmalzG 2008 Biomaterials 29 1377 http://dx.doi.org/10.1016/j.biomaterials.2007.11.049
- ShimizuMTainakaHObaTMizuoKUmezawaMTakedaK 2009 Part. Fibre Toxicol. doi:10.1186/1743-8977-6-20
- GundySManningGO'ConnelEEllaVHarwokoM SRochevYSmithTBarronV 2008 Acta Biomater. 4 1734 http://dx.doi.org/10.1016/j.actbio.2008.05.025
- AshburnerM et al 2000 Nat. Genet. 25 25 http://dx.doi.org/10.1038/75556
- HosackD ADennisGShermanB TJrLaneH CLempickiR A 2003 Genome Biol. 4 R70 http://dx.doi.org/10.1186/gb-2003-4-10-r70
- KimC-SSohnS-HJeonS-KKimK-NRyuJ-JKimM-K 2006 J. Oral Rehabil. 33 368 http://dx.doi.org/10.1111/j.1365-2842.2005.01553.x
- HanagataNTakemuraTMonkawaAIkomaTTanakaJ 2007 J. Biomed. Mater. Res. A 83 362
- ZhangLHanagataNMaedaMMinowaTIkomaTFanHZhangX 2009 Sci. Technol. Adv. Mater. 10 025003 http://dx.doi.org/10.1088/1468-6996/10/2/025003
- Grandjean-LaquerriereALaquerrierePGuenounouMLaurent-MaquinDPhillipsT M 2005 Biomaterials 26 2361 http://dx.doi.org/10.1016/j.biomaterials.2004.07.036
- AnnalisaPFurioPIlariaZAnnaALucaSMarcellaMMarziaAElenaMCarinciF 2008 J. Oral Sci. 50 30 http://dx.doi.org/10.2334/josnusd.50.301
- LaurentL CChenJUlitskyIMuellerF JLuCShamirRFanJ BLoringJ F 2008 Stem Cells 26 1506 http://dx.doi.org/10.1634/stemcells.2007-1081
- PalmieriAPezzettiFBrunelliGZollinoIScapoliLMartinelliMArlottiMCarinciF 2007 J. Biomed. Sci. 14 777 http://dx.doi.org/10.1007/s11373-007-9193-z
- PalmieriABrunelliGGuerzoniLLo MuzioLScaranoARubiniCScapoliLMartinelliMPezzettiFCarinciF 2007 Nanomedicine 3 138
- PalmieriAPezzettiFAvantaggiatoALo MuzioLScaranoARubiniCGuerzoniLArlottiMVentorreDCarinciF 2008 J. Oral Implantol. 3 190 http://dx.doi.org/10.1563/0.869.1
- PalmieriAPezzettiFSpinelliGArlottiMAvantaggiatoAScaranoAScapoliLZollinoICarinciF 2008 J. Prosthodont. 17 522 http://dx.doi.org/10.1111/j.1532-849X.2008.00331.x
- PalmieriAPezzettiFBrunelliGMartinelliMScapoliLArlottiMMasieroECarinciF 2008 Biomed. Mater. Eng. 18 91
- PalmieriAPezzettiFBrunelliGArlottiMLo MuzioLScaranoARubiniCSollazzoVMassariLCarinciF 2008 J. Craniofac. Surg. 19 328 http://dx.doi.org/10.1097/SCS.0b013e3181534ab3
- PalmieriAPezzettiFBrunelliGZollinoILo MuzioLMartinelliMScapoliLArlottiMMasieroECarinciF 2008 J. Mater. Sci. Mater. Med. 19 2471 http://dx.doi.org/10.1007/s10856-008-3386-5
- PalmieriAPezzettiFBrunelliGScapoliLLo MuzioLScaranoAMartinelliMCarinciF 2008 J. Biomed. Mater. Res. B Appl. Biomater. 84 369