Abstract
Nanostructured binary semiconducting metal oxides have received much attention in the last decade owing to their unique properties rendering them suitable for a wide range of applications. In the quest to further improve the physical and chemical properties, an interest in ternary complex oxides has become noticeable in recent times. Zinc stannate or zinc tin oxide (ZTO) is a class of ternary oxides that are known for their stable properties under extreme conditions, higher electron mobility compared to its binary counterparts and other interesting optical properties. The material is thus ideal for applications from solar cells and sensors to photocatalysts. Among the different methods of synthesizing ZTO nanostructures, the hydrothermal method is an attractive green process that is carried out at low temperatures. In this review, we summarize the conditions leading to the growth of different ZTO nanostructures using the hydrothermal method and delve into a few of its applications reported in the literature.
Introduction
Zero- and one-dimensional nanostructures of binary semiconducting oxides (II–VI and IV–VI oxides), such as ZnO, TiO2 and SnO2, have attracted immense interest owing to their unique properties and potential use in diverse applications such as photocatalysis [Citation1–3], solar cells [Citation4–7] and gas sensors [Citation8–11]. However, with active research in nanotechnology, there is an urgent need for specially designed semiconductors to better match the properties of emerging materials. This has led to a renewed interest in ternary oxide semiconductors (II–IV–VI oxides) of the form AII2 BIVO4, such as cadmium stannate (Cd2SnO4), popularly known as cadmium tin oxide (CTO), and zinc stannate (Zn2SnO4), which is often called zinc tin oxide (ZTO). Zn2SnO4 is acknowledged for having high electron mobility [Citation12], high electrical conductivity, and attractive optical properties that makes it suitable for a wide range of applications in solar cells [Citation13–15], sensors for the detection of humidity and various combustible gases [Citation16, Citation17], negative electrode material for Li-ion battery [Citation18–20] and as a photocatalyst for the degradation of organic pollutants [Citation21–24]. Compared with binary oxides, the complex ternary oxides like Zn2SnO4 are chemically more stable making them ideal for applications involving extreme conditions [Citation25]. Zn2SnO4 has been successfully used as a flame retardant and smoke suppressant [Citation26].
The control of sizes and shapes of nanostructures is crucial as it may affect their electrical and optical properties [Citation27–31]. Active research is going on for using nanosized building blocks to fabricate complex structures [Citation27, Citation32–35]. Even though the process of breaking up macromaterials into nanostructures (often referred to as top down approach) has considerably progressed over the last decade, it is still expensive and requires sophisticated equipment. However, the fabrication of complex structures still remains a challenge for researchers [Citation36, Citation37]. Self-organization provides an effective approach for the fabrication of these structures, and nanostructures of different materials with varying morphology, such as wires, rods, tubes, belts, tetrapods, flowers, dendrites, ribbons, etc, have been fabricated using a variety of growth methods [Citation27–29, Citation32, Citation33, Citation38–41].
ZTO is typically synthesized following high-temperature solid-state reactions using ZnO and stannic oxide (SnO2) powders. The biggest drawback of this process is the evaporation of ZnO during synthesis for which different heat-treatment schemes have been proposed [Citation42]. The synthesis of ZTO nanostructures has also been reported through thermal evaporation of metal or metal oxide powder at high temperatures [Citation43–45] and also through coprecipitation of Zn and Sn hydroxides followed by calcination in air [Citation22, Citation46]. One of the first reports on the hydrothermal synthesis of ZTO was by Fang et al [Citation47] who varied experimental parameters like temperature and concentration and observed their effects on the evolution of different phases. The hydrothermal growth process is attractive as the nucleation and growth of the crystal happens under mild conditions in water. There are reports on the control of morphology of the ZTO nanostructures yielding shapes like cubes, spheres, anisotropic rods, etc, through the use of different mineralizers and additives [Citation13, Citation15, Citation19, Citation48]. The solution-phase synthesis has been proved efficient for growing nanostructures of varied morphologies as the chemicophysical parameters (like temperature, concentration of reactants, duration of crystal growth, additives, etc) can be varied at ease [Citation49–52]. This can lead to improved control of the thermodynamics and the kinetics involved in the nucleation and growth process. Studies on the hydrothermal growth of ZTO nanostructures are still at a nascent stage with reports emphasizing the obtained final reaction products. The evolution of the nanostructures during the progress of the reaction has not been properly comprehended yet. A few morphological varieties of ZTO nanostructures have been reported to date as it has not yet been possible to deliberately control the reaction kinetics [Citation53].
Zinc stannate crystal structure
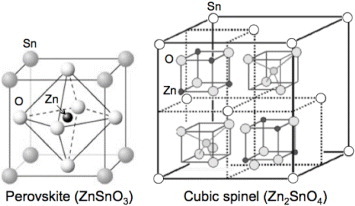
Zinc stannate, during crystallization through solid-state reaction, normally transforms through a metastable form (ZnSnO3) at temperatures in the range of 300–500 °C into the stable zinc orthostannate (Zn2SnO4) at temperatures above 600 °C. It is difficult to obtain pure Zn2SnO4 phase through high-temperature synthesis methods like thermal evaporation with the end product normally being a mixed phase of ZnSnO3, Zn2SnO4 and SnO2. Metastable ZnSnO3 has the face-centered perovskite structure, whereas the orthostable Zn2SnO4 has the cubic spinel structure. The crystal structures of zinc stannate are shown in figure .
Figure 1 Crystal structures of zinc stannate: perovskite structure for zinc metastannate (ZnSnO3) and cubic spinel structure for zinc orthostannate (Zn2SnO4). A single atom of each element is labeled in the structural diagrams.
Typical synthesis methods
The synthesis procedures that have been reported for ZTO nanostructures can be broadly classified into the following types:
Thermal evaporation.
High-temperature calcination.
Mechanical grinding.
Sol-gel synthesis.
Hydrothermal reaction.
Ion-exchange reaction.
Thermal evaporation of Zn and Sn powders with or without catalysts at temperatures above 800 °C yields different ZTO nanostructures like nanoparticles, nanorods, nanobelts, etc [Citation43, Citation54]. Catalyst-assisted thermal evaporation for synthesizing Zn2SnO4 nanostructures has been reported by numerous researchers with Au being the most popular catalyst [Citation43, Citation54, Citation55]. The use of metal oxides like zinc oxide (ZnO) [Citation43, Citation54], stannic oxide (SnO2) [Citation54, Citation56] and stannous oxide (SnO) [Citation43, Citation55] as the source materials for the synthesis of ZTO nanostructures requires high growth temperature and also ends up with a high concentration of ZnO in the end product [Citation57]. Crystalline ZnSnO3 has been successfully synthesized through a solid—melt ion exchange reaction using lithium stannate (Li2SnO3) at a temperature of 350 °C [Citation58]. However, the Li2SnO3 used for the ion exchange reaction was prepared by a high-temperature (650–1000 °C) solid-state reaction between lithium carbonate (Li2CO3) and SnO2. Synthesis of ZTO nanopowder through a sol–gel process has been reported by Fu et al [Citation59] using zinc chloride (ZnCl2) and stannic chloride (SnCl4) as the starting reactants. Ammonium hydroxide (NH4OH) was added to convert the sol into a gel, which was then calcined at 600 °C to obtain the nanopowders. Transparent conducting coatings of doped Zn2SnO4 were deposited by a sol–gel technique on borosilicate and aluminosilicate glass substrates by Kurz et al [Citation60]. The coating solutions were prepared by dissolving the appropriate amounts of metal chlorides or alkoxides in ethanol with a zinc-to-tin molar ratio ranging from 0.3 to 0.9. Nikolić et al [Citation61] studied the formation of polycrystalline zinc stannate spinels through a solid-state reaction and analyzed the influence of mechanical activation on its formation. They observed that the zinc stannate formation rate could be enhanced through prolonged grinding, that is, by increasing the time of activation. Single-phase polycrystalline zinc stannate was formed when the samples were activated for 160 min and sintered at 1200 °C for 2 h.
The hydrothermal method has been proven to be a simple and effective way of synthesizing highly crystalline and phase-pure ZTO nanostructures, which are difficult to obtain through high-temperature solid-state reactions owing to the evaporation of ZnO [Citation15, Citation19, Citation47, Citation48, Citation53]. The hydrothermal synthesis of different ZTO nanostructures is discussed in detail in the next section.
Hydrothermal growth of ZTO nanostructures
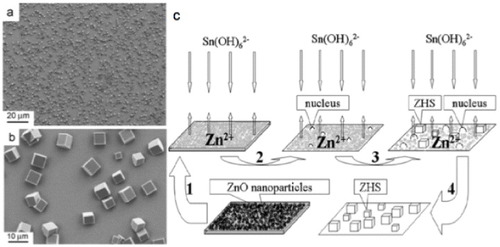
In the course of hydrothermal growth, a hydrated form of zinc stannates develops at approximately 120–150 °C; it is called zinc hydroxystannate (ZnSn(OH)6) or ZHS in short. Zhang et al [Citation25] reported the growth of zinc hydroxystannate microcubes on a thin film of pre-synthesized ZnO nanoparticles which served as the source of Zn for the hydrothermal growth. The reaction was carried out in a Teflon-lined autoclave at 120 °C by dipping the substrate coated with ZnO nanoparticles in a solution of SnCl4. The reaction was continued for 24 h and the microcubes obtained were about 5–8 μm in size. Scanning electron microscopy (SEM) images of the ZHS microcubes at two different magnifications are shown in figures (a) and (b). A schematic representation of the growth process is shown in figure (c).
Figure 2 SEM images of zinc hydroxystannate (ZHS) microcubes (a) lower magnification, (b) higher magnification, (c) schematics of the growth process. (Reproduced with permission from [Citation25] © 2007 Elsevier B.V.)
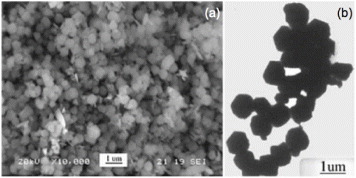
Most reports on the hydrothermal growth of zinc stannate nanostructures used an aqueous mixture of a zinc salt (zinc nitrate, zinc chloride, zinc sulfate, etc) and stannic chloride. The mixture is then reduced using sodium hydroxide or ammonium hydroxide at 200–250 °C under high pressure in a sealed environment. Xu et al [Citation62] synthesized micron-sized ZnSnO3 particles following a single-step hydrothermal method. Their preparation of ZnSnO3 is based on the following reaction:
The ZnSnO3 particles were hexagonal with an average diameter of 500 nm and are shown in figure . The hexagonal shape is evident in the transmission electron microscopy (TEM) image shown in figure (b). Figure (a) shows an SEM image of the ZnSnO3 particles.
Figure 3 The ZnSnO3 nanoparticles reported by Xu et al: (a) scanning electron image, (b) transmission electron image where the hexagonal shape can be clearly seen. (Reproduced with permission from [Citation62] © 2006 Elsevier B.V.)
One of the first reports on the hydrothermal synthesis of AII2BIVO4-type complex oxides with spinel structure was by Fang et al in 2001 [Citation47]. They used zinc acetate dihydrate (Zn(CH3COO)2·2H2O) and tin tetrachloride pentahydrate (SnCl4·5H2O) as the sources of Zn and Sn, respectively. The ratio of Zn to Sn was maintained at 0.5 and the hydrothermal reaction was carried out in a Teflon-lined stainless steel reactor using various concentrations of NaOH at temperatures ranging from ambient (25 °C) to 220 °C. A TEM image of the zinc stannate particles is shown in figure (a). Following a similar procedure, Lou et al synthesized nanocrystals of Zn2SnO4 at 200 °C within 24 h [Citation23]. The hydrothermal growth of ZTO from Zn2+ and Sn4+ in the presence of OH− takes place through the following reaction [Citation53].
Figure 4 TEM images of Zn2SnO4 nanoparticles prepared using Zn(CH3COO)2 2H2O and SnCl4 5H2O with NaOH as mineralizer at (a) 220 °C (Reproduced with permission from [Citation47] © 2001 Elsevier B.V.), (b) 200 °C (Reproduced with permission from [Citation23] © 2006 Elsevier B.V.), (c) SEM image of Zn2SnO4 nanoparticles prepared at 170 °C with tert-butylamine as the coordinating agent. (Reproduced with permission from [Citation44] © 2009 American Chemical Society.)
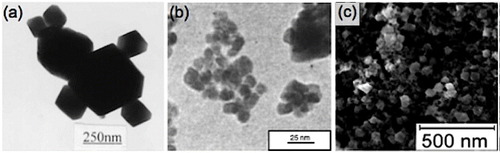
Lou et al [Citation23] synthesized particles with a homogenous and very narrow size distribution (figure (b)). A similar procedure for obtaining phase-pure Zn2SnO4 was reported by Foletto et al [Citation63] who noted the final pH of the reactant solution before thermal treatment to be 7.5.
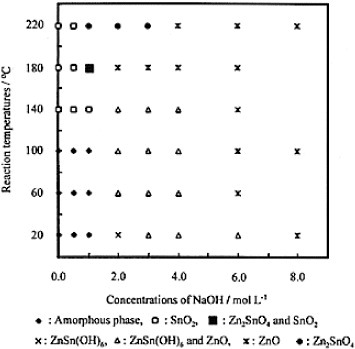
Zeng et al [Citation53] had reported that the transformation of ZTO from the precursors starts with the formation of ZHS followed by ZTO. When NaOH was used as the mineralizer, with the reaction proceeding as given in equation (2), the pH of the reactant solution gradually decreases owing to the consumption of hydroxyl (OH−) ions. This drop in pH favors the formation of ZHS. ZHS forms readily and is very stable at low pH and temperature [Citation47]. Consequently, the phase transformation of ZHS to ZTO is sufficiently small when NaOH is used as a mineralizer. The yield of pure ZTO can be increased through optimization of NaOH concentration, reaction time, temperature, and other parameters [Citation53]. However, at higher temperatures, ZnO is thermodynamically more stable than ZTO [Citation47, Citation53]. A schematic representation of the transformation process during the formation of ZTO nanocrystals is shown in figure [Citation53] and the different phases as functions of reaction temperatures and NaOH concentrations are given in figure [Citation47].
Figure 5 Schematics of the formation of ZTO nanocrystals through a crystallization–dissolution–recrystallization process. (Reproduced with permission from [Citation53] © 2008 American Chemical Society.)
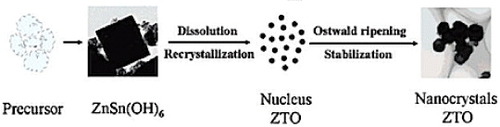
Figure 6 Different phases obtained during the formation of ZTO as functions of reaction temperature and NaOH concentration. (Reproduced with permission from [Citation47] © 2001 Elsevier B.V.)
Although the hypothesis presented in figure is a simplification of the actual process, it can explain the experimentally observed phenomena like the formation of ZnSn(OH)6 and other precipitation phases in the products, the effects of OH− concentration on the precipitation phase, and the reaction time for the phase transformation process reasonably well [Citation53].
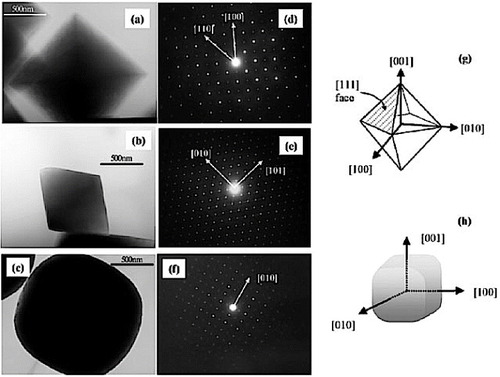
Following a similar hydrothermal synthesis route, Miyauchi et al [Citation14] obtained both perovskite-type ZnSnO3 and cubic spinel-type Zn2SnO4 particles. The ZnSnO3 particles had a (100) face-exposed hexahedron structure and the Zn2SnO4 particles had a (111) face-exposed octahedron structure. The average particle sizes for the Zn2SnO4 and ZnSnO3 particles were 1.3 and 1.5 μm, respectively. TEM images of the Zn2SnO4 and ZnSnO3 particles are shown in figures (a)–(c), and schematic representations of their crystal shapes with faces are given in figures (g) and (h), respectively.
Figure 7 TEM images of Zn2SnO4 (a,b) and ZnSnO3 (c) with corresponding electron diffraction patterns (d)–(f). Panels (g) and (h) outline the crystal shapes of Zn2SnO4 and ZnSnO3, respectively. ([Citation14]—Reproduced by permission of The Royal Society of Chemistry.)
There are a few reports on the formation of hollow structures of ZnSnO3 following hydrothermal routes. In a typical hydrothermal synthesis process using zinc acetate dihydrate, tin tetrachloride, sodium hydroxide and cetyltrimethylammonium bromide (CTAB), Fan et al [Citation64] obtained porous microspheres of ZnSnO3. The reaction was carried out at 160 °C for 12 h. Zeng et al [Citation65] obtained porous cubic structures (nanocages) by adding hexamethylenetetramine along with zinc acetate, tin chloride and NaOH in a hydrothermal growth process.
To avoid the problems associated with the use of NaOH, Fu et al [Citation21] proposed the use of weak bases like amines as the mineralizer since they could continuously supply OH− through hydrolysis during the reaction process and thereby maintain the solution pH. They believe that the formation of ZnO in the weak base is suppressed owing to its low dissociation capacity. The authors used four different types of amines ethylamine, n-butylamine, n-hexylamine, and n-octylamine. The reaction mechanism has been explained with the following reactions:
When the n-butylamine concentration is low (0.27 M), H2SnO3 forms as per equation (3) owing to the strong hydrolysis effect of Sn4+. H2SnO3 further transforms to SnO2 through the hydrothermal process according to equation (4). The Zn2+ ions remain suspended in the solution, which could be subsequently removed after the reaction. However, upon increasing the n-butylamine concentration, the dominant reaction takes place as in equation (5), which deteriorates the formation of SnO2. ZTO forms according to equations (6) and (7) at an optimum concentration (0.4 M) of n-butylamine. This is mainly because the solubility of ZTO is lower than that of other compounds under the reaction conditions. Highly crystalline ZTO was obtained at a n-butylamine concentration of 0.5 M. As the other amines used (ethylamine, n-hexylamine and n-octylamine) have base dissociation constant (pKb) values almost similar to that of n-butylamine (pKb ∼ 3.36) [Citation66], the effect of their concentrations on the ZTO structure should be similar to that of n-butylamine. A similar process was followed by Alpuche-Aviles and Wu [Citation44] for synthesizing Zn2SnO4 nanoparticles using stoichiometric amounts of ZnCl2 and SnCl4·5H2O with tert-butylamine as the coordinating agent in a hydrothermal reaction at 170 °C for 12 h. The nanoparticles with an average diameter of 25 nm are shown in the SEM image of figure (c). Zhu et al [Citation67] synthesized Zn2SnO4 nanoparticles for use as anode material of Li-ion batteries with ZnSO4·7H2O and SnCl4·5H2O as the reactants. They also observed that alkaline concentrations and reaction temperatures are the key factors determining particle size, morphology and purity of the product.
Zeng et al [Citation53] carried out a systematic study to gain insight into the fundamental factors controlling phase composition, particle size and crystal morphology of hydrothermally grown Zn2SnO4 nanocrystals. Their observations indicated that the phase transformation during the hydrothermal growth probably evolved through a ‘dissolution-recrystallization’ mechanism accompanying the ‘Ostwald ripening’ process. They used zinc sulfate (10 mM) and stannic chloride (5 mM) as the sources of Zn and Sn, respectively. They also observed morphological changes with a variation in the reaction temperature from 180 to 250 °C with crystal growth continued for 20 h at a NaOH concentration of 1 M. The particle sizes decreased with increasing reaction temperature or reaction time, which can be attributed to the dissolution of larger crystals followed by recrystallization.
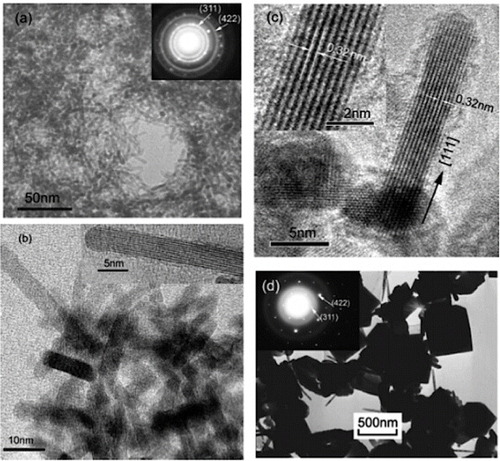
With growing interest in complex oxides for different applications, researchers are now concentrating on controlling the morphology of hydrothermally grown ZTO nanostructures. Zhu et al [Citation48] have synthesized nanorods of Zn2SnO4 in a simple hydrothermal process using hydrazine hydrate (N2H4·H2O) as an alkaline mineralizer. They used ZnCl2, SnCl4·5H2O and N2H4·H2O in the molar ratio of 2:1:8 and carried out the reaction in a Teflon-lined autoclave at 250 °C for 24 h. They also synthesized ZTO crystals using NaOH under similar conditions for comparison. TEM images of the ZTO nanorods are shown in figures (a)–(c). The ZTO nanostructures obtained using NaOH instead of hydrazine are shown in the TEM image of figure (d). The lattice fringes that can be seen in the high-resolution TEM image shown in figure (c) indicate high level of crystallinity of the ZTO nanorods. Measurements of the lattice fringes show that the anisotropic growth of the nanorods takes place along the [Citation111] direction.
Figure 8 (a)Low-magnification TEM image and SAED pattern of ZTO nanorods. (b,c) High-magnification TEM images of ZTO nanorods. (d) TEM image and SAED pattern of ZTO crystals synthesized using NaOH. (Reproduced with permission from [Citation48] © 2006 American Chemical Society.)
Hydrazine hydrate acts as a ligand, coordinating with Sn ions (6-coordinate) and Zn ions (4-coordinate) [Citation48]. This leads to the formation of (ZnCl2)m(N2H4)n(SnCl4)y complex clusters. Their agglomeration produces a slurry like white precipitate, which exhibits vibration bands corresponding to hydrazine molecules [Citation68] suggesting that the complex precipitate was formed between N2H4 and the inorganic salts (ZnCl2 and SnCl4) as shown in figure . The sharp peak at 3284 cm−1 is assigned to the N–H stretching vibration, whereas the two sharp peaks at 1606 and 1572 cm−1 are assigned to the NH2 scissors. The wag and twist bands appeared at 1311 and 1171 cm−1, respectively. The peak at around 976 cm−1 can be attributed to the stretching band ν(N–N) of bridging H2N–NH2 bond between two metal ions [Citation69].
The possible formation mechanism of ZTO nanorods is proposed by the authors on the basis of the following equations:
The (ZnCl2)m(N2H4)n(SnCl4)y clusters formed in reaction (9) dissociate in reaction (10). Equation (12) represents the synthesis of Zn2SnO4 via the reaction between metal ions (Zn2+ and Sn4+) and OH− ions generated in reaction (11). The authors opined that the dissociation of N2H4 from the complex (reaction (10)) and the formation of OH− ions (reaction (11)) and Zn2SnO4 nanorods occur at local regions of the complex cluster. Thus, during the hydrothermal stage of crystal growth, ultrafine ZTO nanorods of 2–4 nm diameter were produced [Citation48].
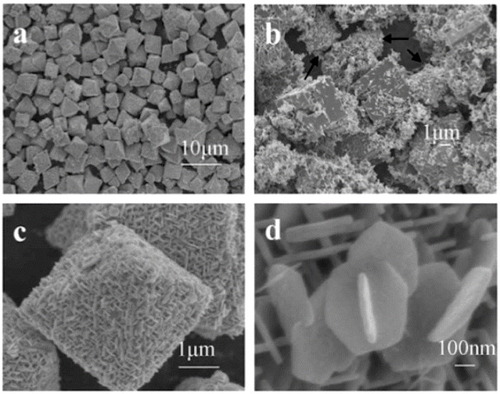
Ji et al [Citation70] reported the large-scale synthesis of octahedral Zn2SnO4 microstructures with a controlled hydrothermal reaction assisted by a surfactant, cetyl trimethyl ammonium bromide (CTAB) [Citation70]. They used SnCl4·5H2O (0.025 M) and ZnSO4·7H2O (0.05 M) as the starting reactants with NaOH as the mineralizer. The three-dimensional Zn2SnO4 octahedrons were assemblies of numerous intercrossed hexagonal nanoplates with a mean edge length of 300 nm and a thickness of 50 nm. The octahedron edges are about 4–5 μm long as can be observed in the SEM images shown in figure . By analyzing the time evolution of the synthesis Ji et al came to a similar conclusion as Zeng et al [Citation53], that is, the formation of the ZTO microstructures may result from the ‘crystallization–dissolution–recrystallization’ mechanism. Under the hydrothermal reactions, ZnSn(OH)6 nuclei quickly formed in the solution and gradually transformed into cubic crystals. Subsequently, secondary nucleation started on the edge and surfaces of these crystals. The rough surface of the ZnSn(OH)6 cubes at the beginning of reactions (figure (b)) can be attributed to the gradual dissolution owing to the high solubility and metastability of ZnSn(OH)6 as compared with ZTO. The metastable intermediate phase decomposed and recrystallized to form ZTO nuclei following the ‘dissolution–recrystallization’ mechanism as described above.
Figure 9 SEM images of the ZTO microstructures: (a) low magnification image of the Zn2SnO4 octahedrons, (b) ZnSn(OH)6 cubes formed in the initial stage of the reaction. Note secondary nucleation on the cube surfaces, (c) a Zn2SnO4 octahedron, (d) coalescing nanoplates. (Reproduced with permission from [Citation70] © 2010 Elsevier B.V.)
The use of tetramethyl ammonium hydroxide ((CH3)4NOH or TMAH) as a mineralizing agent in the hydrothermal synthesis of ZTO has also been reported [Citation13]. Lana-Villarreal et al used Zn2+/Sn4+/(CH3)4NOH in a ratio of 2:1:8 to prepare Zn2SnO4 nanoparticles in a hydrothermal reaction at 250 °C for 24 h. They obtained highly dispersed Zn2SnO4 nanoparticles but with a wide size distribution—-between 10 and 70 nm with an average value of 27 nm. Annamalai et al [Citation71] have recently reported the synthesis of Zn2SnO4 nanoparticles using Na2CO3, a milder base compared with NaOH, as the mineralizer. They optimized reaction parameters such as the temperature, time and molar ratio (zinc:tin:Na2CO3), for the formation of highly crystalline and uniformly sized (20–50 nm) Zn2SnO4 nanoparticles. The control on the average size of the Zn2SnO4 nanoparticles was attained through the variation of Na2CO3 concentration. The reaction chemistry for the formation of Zn2SnO4 using Na2CO3 in presence of Zn2+ and Sn4+ can be summarized as follows [Citation21]:
The formation of Zn2SnO4 proceeds as discussed above (equation (7)).
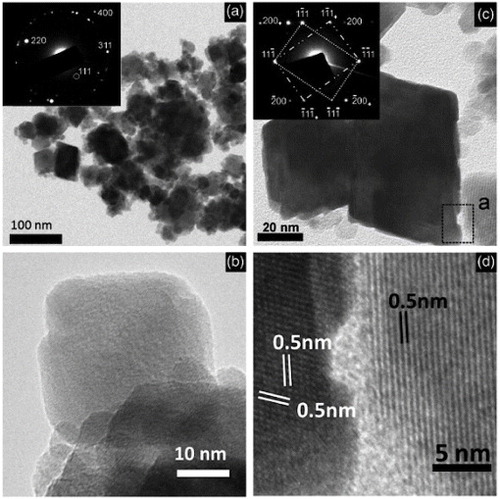
The possibility of forming ZnO at a high concentration of the mild base is much lower than that with NaOH as the dissolution rate of Na2CO3 is low [Citation21]. The water-soluble reaction byproducts like H2CO3 and NaCl could be easily removed through washing with ethanol and deionized water. As Na2CO3 has a higher solubility in water under hydrothermal conditions and is less basic than NaOH [Citation72], it can supply OH− ions until all the intermediate hydroxide is fully converted to Zn2SnO4. Figure shows TEM images of the Zn2SnO4 nanoparticles synthesized under the optimized conditions of 200 °C for 24 h with a molar ratio of 2:1:4
Figure 10 TEM images of the Zn2SnO4 nanoparticles synthesized under the optimized conditions of 200 °C, 24 h and a molar ratio of Zn:Sn:Na2CO3=2:1:4. Insets present SAED patterns. The dotted area in panel (c) is magnified in panel (d). (Reproduced with permission from [Citation71] © 2010 Elsevier B.V.)
Properties of hydrothermally grown ZTO nanostructures
Structural properties
Hydrothermally synthesized metastable zinc stannate (ZnSnO3) has either perovskite or ilmenite structure. The formation of highly crystalline structures of Zn2SnO4 and ZnSnO3 through hydrothermal growth is evident from the selected area electron diffraction (SAED) patterns shown in figures (d)–(f), (a, d) and (a, b). A representative x-ray diffraction (XRD) pattern of hydrothermally synthesized ZnSnO3 is shown in figure (a) [Citation62]. Most of the diffraction peaks can be indexed to face-centered perovskite ZnSnO3, using the Joint Committee on Powder Diffraction Standards (JCPDS) data file 11-0274. The authors marked the residual peaks with stars and these can be indexed to zincite (JCPDS file No. 36-1451). As the ZnO peaks are weaker than those of ZnSnO3, it was inferred that the amount of ZnO in the as-prepared sample is marginal. The orthostable form of zinc stannate (Zn2SnO4) however comes with the trisymmetric inverse cubic spinel structure. Figure (b) shows the XRD pattern for Zn2SnO4 nanoparticles prepared using Na2CO3 as the mineralizer [Citation71], where the most prominent peak is from the (311) plane. Annamalai et al [Citation71] calculated the lattice parameter of the hydrothermally synthesized Zn2SnO4 nanoparticles as 8.62 Å using multiple XRD peaks and least-squares method, which is within the range of previously reported values [Citation53]. The diffraction peaks of the XRD pattern of Zn2SnO4 octahedron (figure (c)) are consistent with the JCPDS (74-2184) data of the pure spinel Zn2SnO4 having a lattice parameter of 8.65 Å. The peaks correspond to an inverse spinel structure, where all Sn4+ atoms are octahedrally coordinated, while half of the Zn2+ atoms are distributed in tetrahedral coordination and the other half has octahedral coordination [Citation73]. No peaks originating from impurities could be seen indicating the formation of pure phases of ZTO.
Figure 11 XRD patterns of (a) ZnSnO3 nanoparticles(Reproduced with permission from [Citation62] © 2006 Elsevier Ltd.). (b) Zn2SnO4 nanoparticles prepared using Na2CO3 as the mineralizer (Reproduced with permission from [Citation71] © 2010 Elsevier B.V.). (c) Zn2SnO4 octahedrons after (a) 2 h, (b) 4 h, (c) 6 h and (d) 20 h of synthesis (Reproduced with permission from [Citation73] © 2002 American Institute of Physics). The peaks of ZnSn(OH)6 and Zn2SnO4 are indexed. (d) XRD pattern of the hydrothermally grown Zn2SnO4 nanorods. (Reproduced with permission from [Citation48] © 2006 American Chemical Society.)
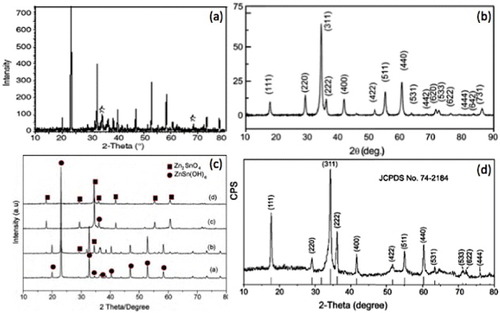
Figure (d) shows the XRD pattern of ZTO nanorods as in figure [Citation48]. All the peaks can be indexed to cubic ZTO (JCPDS No. 74-2184) with a lattice parameter of 8.65 Å. The relative intensity of the (111) peak (∼56%) was higher than that of the (111) peak in the standard JCPDS card (36.4%). The (222) peak was also stronger, whereas the intensities of other peaks were close to those in the standard card. From this observation the authors concluded that the Zn2SnO4 nanorods preferentially grew in the [Citation111] direction.
Alpuche-Aviles and Wu [Citation44] observed a change in the XRD pattern of Zn2SnO4 films upon heat treatment at 500 °C for 30 min. They reported a shift in the high-index planes towards lower 2θ values, i.e. larger d spacing. The low-index planes, however, remained constant with no change in the degree of inversion. This shift is consistent with a change in the lattice constant of ∼0.3%. The average particle size estimated from the XRD for the as-prepared Zn2SnO4 particles from the (111), (220), (311), (400), (511) and (440) planes was 25±3 nm. The authors concluded that there was no evidence of stress-induced artifacts in their results.
Optical properties
Zinc stannates, being wide-gap semiconductors, absorb in the ultraviolet part of the electromagnetic spectrum. The optical absorbance of Zn2SnO4 nanoparticle films, as prepared (4 μm thick) and after heat treatment (2 μm thick) at 500 °C, is shown in figure (a) [Citation44]. The heat-treated sample showed a redshift in the absorbance cutoff, indicating a lowering of the optical bandgap (Eg). Zeng et al [Citation53] reported that ZTO samples synthesized using different additives have very similar photoabsorption spectra. The absorption spectra of various ZTO samples are shown in figure (b). The presence of a steep threshold (320 nm) indicates that the light absorption originates from the lattice rather than impurities, and such spectra were reported for different ZTO nanostructures. The as-prepared Zn2SnO4 octahedra shown in figure [Citation70] showed a steep absorption edge in the visible region, again indicating intrinsic absorption.
Figure 12 Optical absorption spectra of (a) Zn2SnO4 nanoparticles: (•) as is and (o) after annealing at 500 °C for 30 min (Reproduced with permission from [Citation44] © 2009 American Chemical Society). (b) ZTO hydrothermally synthesized at 200 °C for 20 h (sample A: citrate as the additive agent; sample B: no additives; sample C: CTAB as the additive surfactant). (Reproduced with permission from [Citation53] © 2008 American Chemical Society.)
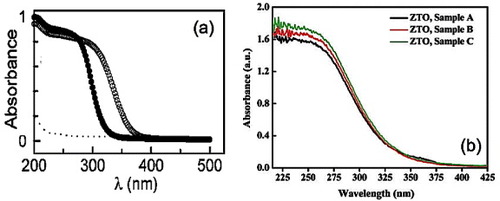
Figure (a) presents a room-temperature photoluminescence (PL) spectrum of hexagonal ZTO nanoparticles (shown in figure (c)) upon excitation at 280 nm [Citation21]. A strong, broad, green emission band centered at 550 nm was observed, which conforms to the results reported by other groups [Citation55, Citation74]. The green emission evidently originates not from band edge emission, as the bandgap of ZTO is about 3.7 eV. It was assigned to oxygen vacancies in ZnO and SnO2 [Citation75, Citation76]. These luminescent centers in the ZTO nanoparticles possibly arise during the hydrothermal synthesis [Citation77].
Figure 13 Photoluminescence spectra (280 nm excitation) of hydrothermally synthesized Zn2SnO4 nanoparticles using (a) n-butylamine (Reproduced with permission from [Citation21] © 2009 Elsevier B.V.), (b) hydrazine hydrate (Reproduced with permission from [Citation78] © 2009 Elsevier B.V.) as the mineralizer.
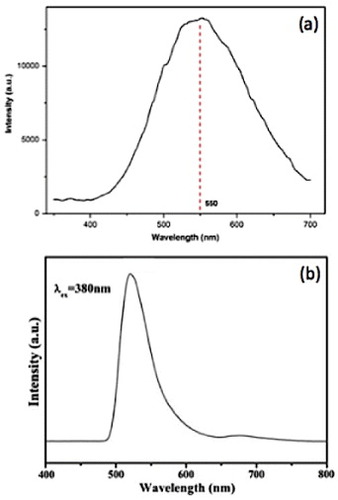
Fu et al [Citation78] reported a similar broad green emission centered at 520 nm from Zn2SnO4 nanoparticles upon excitation with a xenon lamp. The PL spectrum is shown in figure (b). The authors also concluded that the green emission was not from band edge transitions but most likely caused by oxygen vacancies or residual strain induced during the growth [Citation75, Citation79, Citation80]. The authors also opined that this deep-level luminescence originates at surface states, which are electronic states characteristic of the material surface.
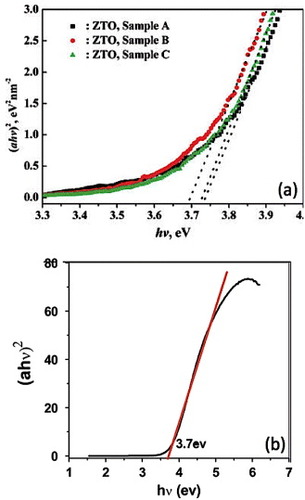
The absorption of photons in a semiconductor with energy hv equal to or higher than that of the band gap Eg leads to the generation of excitons—optical transitions producing electrons in the conduction band and holes in the valence band. For such transitions to occur, the wave vector (k) must be conserved (k=0) [Citation81]. In a direct band gap semiconductor where the wave vector is conserved [Citation53], the relationship between the adsorption coefficient (α) near the absorption edge and the optical band gap (Eg) obeys the following relation [Citation82]
where A relates to the effective masses associated with the valence and conduction bands. The optical bandgap for the absorption edge can therefore be obtained by extrapolating the linear portion of (αhv)2 – hv to α=0.
Figure (a) shows the (αhv)2 versus hv curves of Zn2SnO4 nanocrystals prepared through a hydrothermal growth from ZnSO4 and SnCl4 using NaOH as a mineralizing agent [Citation53]. The dashed lines show the linear fit and corresponding extrapolation. The Eg values for the Zn2SnO4 nanocrystals are greater than the bulk bandgap of 3.6 eV. The bandgaps for samples A, B and C are 3.73, 3.69 and 3.72 eV, respectively. Zeng et al [Citation53] proposed that the increase in the bandgap of the Zn2SnO4 nanoparticles is indicative of quantum confinement effects arising owing to their small size. A comparable bandgap of 3.7 eV was reported by Fu et al [Citation21] for Zn2SnO4 nanoparticles synthesized using n-butylamine as the mineralizer. The authors have also attributed the increase in the bandgap to quantum confinement effects. The (αhv)2 versus hv curve obtained by them is shown in figure
Figure 14 (αhv)2 versus hv curves of Zn2SnO4 nanocrystals (a) synthesized using NaOH as the reducing agent with different additives (Sample A: citrate as additive, Sample B: no additives and Sample C: CTAB as the additive) (Reproduced with permission from [Citation53] © 2008 American Chemical Society.), (b) synthesized using n-butylamine as the reducing agent. (Reproduced with permission from [Citation21] © 2009 Elsevier B.V.)
The α(hν) dependence is characteristic of the type of transition: direct allowed or direct forbidden [Citation83], as expressed using equations (16) and (17), respectively.
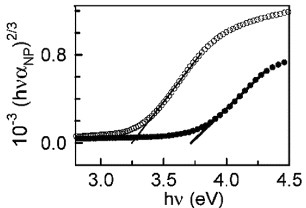
Alpuche-Aviles and Wu [Citation44] studied the optical absorption of nanoparticulate Zn2SnO4 thin films, as prepared and after annealing, and found that their data fit best to the direct forbidden transitions. The (αhv)2/3 versus hv plots used by the authors to calculate the Eg values are shown in figure . The Eg value determined through extrapolation was 3.71± 0.04 eV for the as-prepared sample and 3.25± 0.03 eV for the annealed sample, and the difference was attributed to the incorporation of excess Zn into the Zn2SnO4 matrix.
Figure 15 Calculation of bandgap energy for direct-forbidden transition from the x-intercept of the as-prepared nanoparticulate film (•) (Eg=3.71±0.04 eV) and the heat-treated film (∘) (Eg=3.25±0.03 eV). (Reproduced with permission from [Citation44] © 2009 American Chemical Society.)
Photoelectrochemical properties
ZTO has been proposed for applications as a transparent conducting oxide (TCO) substrate for electronics [Citation84–87], as electrodes for dye-sensitized solar cells (DSSCs) [Citation13, Citation15] and Li+ batteries [Citation19, Citation67, Citation88] as well as for the photocatalytic decomposition of organic molecules [Citation21, Citation23, Citation53, Citation63]. The study of Zn2SnO4 as a model ternary oxide to relate the optical and electronic properties with the composition and crystal structure can pave the way for practical applications of other complex oxides.
Alpuche-Aviles and Wu [Citation44] successfully measured the photoelectrochemical bandgap for a heat-treated nanoparticulate Zn2SnO4 film from the photocurrent (iph) action spectrum (iph as a function of the normalized power at different wavelengths) as shown in figure (a). The optical bandgap estimation for a similar film prior to the heat treatment (shown in figure (a)) is also included for comparison. The substrate was maintained at a potential of E=0.2 V versus normal hydrogen electrode (NHE) in 1 M KCl, 1 M AcO− at pH 4.8. The measured photocurrent corresponds to the transition of a photoexcited electron from the valence band (VB) to the conduction band (CB) in the ZTO semiconductor. The photogenerated holes (h+) oxidize the AcO− thus avoiding any damage to the Zn2SnO4 film. From these measurements, the authors calculated the bandgap as Eg=3.86±0.08 eV.
Figure 16 (a) Photocurrent (iph) action spectrum of Zn2SnO4 after heat treatment (O). The x intercept of the rising part (321 nm) yields Eg=3.86 eV (extrapolation error ± 0.08 eV). For comparison, the optical absorbance of a film before heat treatment is also included. (b) Photocurrent as a function of potential at pH 4.8 (1 M KCl and 1 M AcO–) ν=1 mV s−1, 200 W Hg lamp, 0.05 Hz chopping frequency. (b) Flat band potential (Efb) for Zn2SnO4 nanoparticulate films. (Reproduced with permission from [Citation44] © 2009 American Chemical Society.)
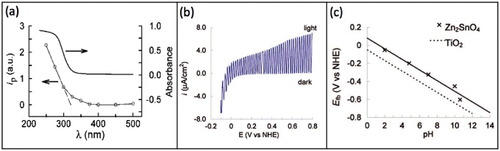
The flat band potential (Efb) of Zn2SnO4 nanoparticulate thin film was determined using the photocurrent onset potential from figure (b) [Citation44]. Although Zn2SnO4 nanoparticles of 25 nm size were used, they agglomerated to about 100 nm during the film formation. The authors opined that the larger particles supported the space-charge layer allowing the concept of flat-band potential. The bands were not flat and bended either upwards or downwards depending on the experimental conditions. The authors argued that at potentials below −0.2 V, negative currents in the dark resulted from Faradaic processes (transfer of electrons across the electrode–electrolyte interface) at the cathode [Citation44]. This is consistent with the Fermi level in Zn2SnO4 moving from a degenerate-type behavior into the forbidden gap as the Fermi level of the electrode is scanned through the positive values in the electrochemical scale (negative in the solid-state vacuum scale). Here the onset of the photocurrent corresponds to the Efb. The increase in the photocurrent slope at approximately 0.4 V (versus NHE) has been reported to occur owing to the photooxidation of O2− to O2 in the oxide material [Citation89].
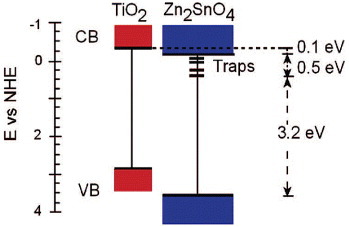
Figure (c) shows Efb of Zn2SnO4 and TiO2 films as a function of pH [Citation44]. The Efb of Zn2SnO4 is more positive than that of TiO2 by approximately 0.1 V. The authors constructed the energy band diagram shown in figure based on the values of Efb and Eg for Zn2SnO4 and TiO2. The defect trap states that account for the optical and photoelectrochemical measurements of Eg and Efb are also included in the schematic diagram.
Figure 17 Comparative energy band diagrams of Zn2SnO4 (Eg=3.7 eV) and TiO2 (Eg=3.2 eV) in aqueous solution at pH 4.8; for simplicity, the surface states in TiO2 near the conduction band (CB) are not shown. CB is drawn assuming EF=Efb≈Ecb. (Reproduced with permission from [Citation44] © 2009 American Chemical Society.)
Applications of hydrothermally grown ZTO nanostructures
Zinc stannate, being a wide-gap semiconductor (bulk bandgap ∼3.6 eV) is an appropriate material for applications in photocatalysis, gas sensors and electrodes for solar cells, to name a few. Photocatalysis is an attractive way of degrading toxic environmental contaminants into benign fragments. The general mechanism of photocatalysis using wide-gap semiconductors (including ZTO) can be summarized in the following equations [Citation53]:
Upon irradiation with light of energy greater than the ZTO bandgap energy, electrons (e−) are excited from the valence band into the conduction band generating holes (h+) in the valence band; these electron–hole pairs can recombine, thereby releasing energy. Electrons and holes react in the presence of water and generate highly reactive radicals like OH·, O·−2 and HO·2, which can oxidize most of the azo dyes to the mineralization end-products.
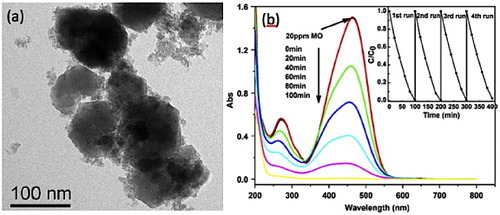
A few available reports of the use of ZTO as photocatalysts are mostly on degrading different organic dyes [Citation21–23, Citation63]. Lou et al [Citation23] studied the degradation of three types of water-soluble dyes, Reactive Turquoise Blue K-NR, Reactive Turquoise Blue B-RN and Reactive Black B-GFF, using Zn2SnO4 nanoparticles (TEM image in figure (b)) under 365 nm illumination. With a dye loading of 40 mg l−1, almost 100% of K-NR decomposed in about an hour, whereas for B-RN and B-GFF, the time taken was almost 2 h. Fu et al [Citation21] successfully degraded an azo dye methyl orange (MO) using Zn2SnO4 nanoparticles. A 20 ppm MO solution was completely degraded after 100 min of exposure to UV light at 254 nm using the particles whose TEM image is presented in figure (a). Optical absorption spectra showing the degradation of MO are plotted in figure (b).
Figure 18 (a) TEM image of Zn2SnO4 nanoparticles used for degrading methyl orange dye. (b) Optical absorption spectra showing the dye degradation. Inset: repeatability test. (Reproduced with permission from [Citation21] © 2009 Elsevier B.V.)
Zeng et al [Citation53] reported the photocatalytic degradation of methylene blue using hydrothermally synthesized Zn2SnO4 nanoparticles. The degradation rates were higher for the ZTO particles than for the commercially available Degussa P25 TiO2 nanoparticles. The rate constants for 3 different ZTO nanoparticles detailed in section 5.2 were in the range of 0.052–0.075 min−1 and are comparable to the value of 0.055 min−1 for P25 TiO2 nanoparticles. In another report, the photocatalytic activity of Zn2SnO4 nanoparticles was evaluated through the degradation of Direct Black 38 azo dye in an aqueous solution [Citation63]. The degradation rate was also comparable to that of P25 TiO2 nanoparticles.
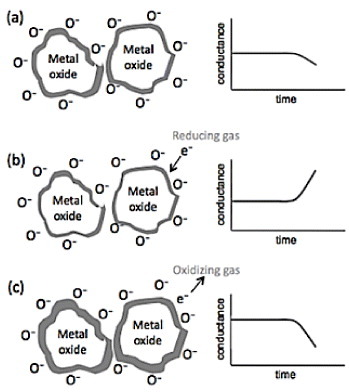
Nanostructured metal oxide semiconductors such as ZnO, SnO2, TiO2 and WO3 [Citation90–98] are widely used as gas sensors, as their resistivity changes in the presence of reactive gases [Citation99, Citation100]. Nanostructures are attractive as sensing elements owing to their large surface area-to-volume ratio allowing higher adsorption of gas molecules. Gas sensors were initially developed based on thick film technology, which gradually advanced towards thin film technology. The major disadvantage of thin film sensors is the high cross-sensitivity to different gases and to humidity. One-dimensional metal oxide nanostructures like nanowires and nanorods provide improved sensitivity and stability of the gas sensors [Citation99]. Ionosorption of the analyte species over the surface of the metal sensing material is the fundamental phenomenon behind the sensing process with carbon, oxygen and water being the most important ionosorbed species [Citation101]. The preferable operating temperature for semiconducting gas sensors ranges between 200 and 500 °C. At temperatures below 150 °C, oxygen is adsorbed in molecular form (neutral or charged). When the temperature is increased, the adsorbed oxygen molecule dissociates into atomic oxygen (neutral, singly or doubly charged), and when the temperature is too high, oxygen atoms desorb from the sensor. Exposure to oxidizing or reducing gases changes the density of ionosorbed oxygen that alters the sensor conductance. The conductance of p-type oxides decreases in the presence of reducing gases and increases in the presence oxidizing gases, and the opposite behavior is observed for n-type metal oxides. A schematic representation of the gas sensing mechanism using metal oxide nanostructures is shown in figure .
Figure 19 Basic operating principle of metal oxide semiconductor gas sensor (a) in ambient air, (b) in presence of reducing gas (increase in conductance), (c) in presence of oxidizing gas (decrease in conductance).
Gas sensors based on n-type semiconductors like ZnO and SnO2 have been studied for the detection of inflammable or toxic gases such as H2, CH4, C2H5OH, CO or liquefied petroleum gas [Citation11, Citation102–109]. However, the lack of selectivity is one of their major disadvantages. To improve the selectivity of the sensors to different gases, metal catalysts such as Ag, Pt and Pd have been widely used [Citation110–112]. Moon et al [Citation113] reported the selective detection of CO gas from a mixture of CO and H2 using SnO2–Zn2SnO4 nanocomposites. The addition of 1 mol% Zn2SnO4 into SnO2 doped with CuO improved the sensitivity to CO gas at low temperature (270 °C) and the sensitivity to H2 gas at high temperature (340 °C), resulting in the high selectivity to CO between 150 and 250 °C.
Porous structures are ideal for gas sensing as they offer high surface-to-volume ratios. Zinc stannate porous structures have been successfully synthesized and applied to gas sensing [Citation64, Citation65]. When the ZnSnO3 sensors are exposed to air, O2 is adsorbed on to the surface of the sensing material. Owing to their strong electronegativity, the adsorbed oxygen molecules trap electrons from the conduction band of ZnSnO3, thereby increasing the resistivity of the sensing element. Upon introducing a reducing gas like H2S, a chemical reaction between the gas molecules and the adsorbed O2 produces electrons thereby reducing the sensor resistivity [Citation62].
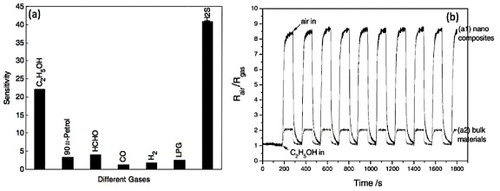
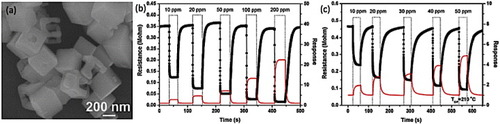
Xu et al [Citation62] studied the gas sensing ability of ZnSnO3 nanoparticles synthesized hydrothermally (particles shown in figure ) to the gaseous ethanol (C2H5OH), formaldehyde (HCHO), carbon monoxide (CO), hydrogen (H2), hydrogen sulfide (H2S) and to liquefied petroleum gas (LPG). The comparative sensitivities are shown in figure (a). The ethanol sensing properties of Zn2SnO4–SnO2 nanocomposites were studied by Lu and Tang [Citation114]. The sensors could detect ethanol down to 200 ppm at an operating temperature of 250 °C (relative humidity 40%). The time profile of resistivity when the sensor element was exposed to 200 ppm ethanol is shown in figure (b) along with results from a similar sensor made using bulk material. The resistivity showed a ninefold change upon gas exposure with a recovery time of tens of seconds. Even after 100 repetitions, no major changes in the signal could be observed, indicating good sensitivity, fast response and excellent durability to ethanol.
Figure 20 (a) Sensitivities of ZnSnO3-based gas sensor to different gases. (Reproduced with permission from [Citation62] © 2006 Elsevier Ltd.) (b) Response cycling curve of the sensor elements prepared from the nanostructured (a1) and bulk (a2) materials when the surrounding gas was switched between air and 200 ppm ethanol-saturating air. The working temperature was kept at 250 °C (relative humidity: 40%). (Reproduced with permission from [Citation114] © 2005 Elsevier B.V.)
Hydrothermally synthesized hollow nanocubes of ZnSnO3 with cage-like architectures and a size of 200–400 nm were tested for sensing ethanol and formaldehyde by Zeng et al [Citation65]. The gas sensor based on these ZnSnO3 cubic nanostructures displayed high response and quick response and recovery with better performance for the cage-like structure as compared to solid ZnSnO3 nanocubes. An SEM image of the cage-like structures is presented in figure (a), and figures (b) and (c) show the response transients of the ZnSnO3 sensor to different concentrations of ethanol and formaldehyde, respectively. In a separate report, the same group demonstrated the gas sensing property of hollow ZnSnO3 microspheres (diameter∼400–600 nm) to butane. The sensor signal was maximum at an optimum operating temperature of 380 °C with response and recovery times of 0.3 and 0.65 s, respectively. The sensitivities of the sensors based on ZnSnO3 porous microspheres were linear with the concentration of butane in the range of 100–1000 ppm.
Figure 21 (a) Scanning electron image of cage-like ZnSnO3 nanostructures, (b,c) response transients of the ZnSnO3 sensor to different concentrations of ethanol (b) and formaldehyde (c). (Reproduced with permission from [Citation65] © 2009 Elsevier B.V.)
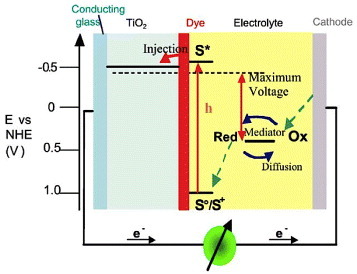
Dye-sensitized solar cells (DSSCs) have been widely studied over the last decade and are considered as a technically and economically plausible alternative concept to the contemporary p–n junction solar cells [Citation115–118]. In a conventional photovoltaic system, the semiconductor supports both light absorption and charge carrier transport. In a DSSC, light is absorbed by a sensitizer dye adsorbed on the surface of a wide-gap semiconductor. Charge separation takes place at the interface through the injection of photoexcited electrons from the dye into the conduction band of the semiconductor. Carriers are transported through the conduction band of the semiconductor to the external circuit. The principle of operation of a DSSC is schematically represented in figure [Citation116]. Most of the current research is focused on systems using nanoporous titanium dioxide as the photoelectrode [Citation119–122], although other semiconductors such as ZnO or SnO2 have also shown promising properties [Citation7, Citation123–128]. A marked enhancement in the conversion efficiency of DSSC was achieved by Tennakone et al [Citation129] using a mixture of ZnO and SnO2 particles on the photoelectrode. The improvement in current–voltage characteristics over ZnO could be attributed to larger open-circuit voltages [Citation130]. Zinc stannate is therefore a promising material for use as working electrodes for DSSC.
Figure 22 Principle of operation and energy level scheme of the dye-sensitized nanocrystalline solar cell. Photoexcitation of the sensitizer (S) is followed by electron injection into the conduction band of an oxide semiconductor film. The dye molecule is regenerated by the redox system, which itself is regenerated at the counter-electrode by electrons that passed through the load. Potentials are referred to the normal hydrogen electrode (NHE). The open circuit voltage of the solar cell corresponds to the difference between the redox potential of the mediator and the Fermi level of the nanocrystalline film indicated with a dashed line. The energy levels drawn for the sensitizer and the redox mediator match the redox potentials of the doubly deprotonated N3 sensitizer ground state and the iodide/triiodide couple. (Reproduced with permission from [Citation116] © 2004 Elsevier B.V.)
Nanoporous Zn2SnO4 thin films on conducting glass substrates as working electrodes for DSSCs were studied by Lana-Villarreal et al [Citation13]. The performance of the Zn2SnO4-based DSSCs was compared with that of standard TiO2 cells, using (TBA)2 -cis-Ru-(Hdcbpy)2(NCS)2 dye (N719 dye) and an electrolyte containing 0.7 M LiI and 0.05 M I2 in 3-methoxypropionitrile. Under similar working conditions, Zn2SnO4 DSSC showed higher open-circuit voltage. However, their overall performance was lower owing to their lower incident photon-to-current conversion efficiency. The authors studied the properties of electrons in DSSCs by measuring their transport time and lifetime through photocurrent and photovoltage transients, respectively. The electron diffusion length was similar in both oxides, demonstrating the possible use of Zn2SnO4 as an electron collector in DSSC applications. Photoinduced absorption measurements, however, show low electron injection efficiency from the dye to Zn2SnO4, owing to the higher position of its conduction band. This result agrees with the higher open-circuit voltage measured.
Li et al [Citation131] reported superior photovoltaic performance for the ZTO–SnO2-based DSSC using Zn2SnO4–SnO2 heterojunction nanocomposites as compared with DSSCs based on single-phase ZTO. Under illumination of AM 1.5 simulated sunlight (100 mW cm−2), the open circuit voltage of the cell based on ZTO–SnO2 was 0.706 V and the short-circuit current density was 2.85 mA cm−2. The efficiency obtained for the ZTO-SnO2 DSSC was 1.29% as compared with 0.90% for the pure ZTO based DSSC. The authors opined that the formation of heterojunctions between ZTO and SnO2 nanoparticles reduces the recombination between injected electrons and redox I−/ I3−, thereby improving the performance of the DSSC. Zinc stannate is therefore an interesting mesoporous material for DSSC photoelectrodes. Better efficiencies can be achieved using dyes with a higher position of the lowest unoccupied molecular orbital than that of N719, as this will give higher photovoltages without affecting the photocurrent.
Conclusions
The hydrothermal synthesis of zinc stannate nanostructures is a simple, efficient and green process that has been receiving much attention recently. Only a few morphologies have been reported, and research is underway to grow different nanostructures through the use of additives. Zinc stannate nanostructures, being chemically more stable than binary oxides, are attractive candidates for applications in such devices as solar cells, gas and biosensors, and detectors, to name a few. Zinc stannate nanostructures are being increasingly used as photocatalysts for degrading harmful contaminants like pesticides from ground water. Within the next decade, zinc stannate nanostructures will likely move into industrial applications.
Acknowledgments
The authors acknowledge partial financial support from the National Nanotechnology Center, belonging to the National Science & Technology Development Agency (NSTDA), Ministry of Science and Technology (MOST), Thailand and the Centre of Excellence in Nanotechnology at the Asian Institute of Technology, Thailand.
Related Research Data
References
- BaruahSRafiqueR FDuttaJ 2008 Nano 3 8 http://dx.doi.org/10.1142/S179329200800126X
- FujishimaARaoT NTrykD A 2000 J. Photochem. Photobiol. C 1 1 http://dx.doi.org/10.1016/S1389-5567(00)00002-2
- AguedachABrosillonSMorvanJLhadiE K 2005 Appl. Catal. B 57 55 http://dx.doi.org/10.1016/j.apcatb.2004.10.009
- BaxterJ BAydilE S 2005 Appl. Phys. Lett. 86 1 http://dx.doi.org/10.1063/1.1861510
- BoraT 2009 Studies on zinc oxide nanorod dye-sensitized solar cell Master Thesis AIT
- ChappelSZabanA 2002 Sol. Energy Mater. Sol. Cells 71 141 http://dx.doi.org/10.1016/S0927-0248(01)00050-2
- BoraTKyawH HPoyaiMDuttaJ 2009 Highly Efficient Zinc Oxide Nanorod Dye Sensitized Solar Cell: Plasmonic Interaction The 3rd Thailand Nanotechnology Conf. Asian Institute of Technology, Bangkok 21–22December 2009
- ArshakKGaidanI 2005 Mater. Sci. Eng. B 118 44 http://dx.doi.org/10.1016/j.mseb.2004.12.061
- CominiEFagliaGSberveglieriGPanZWangZ L 2002 Appl. Phys. Lett. 81 1869 http://dx.doi.org/10.1063/1.1504867
- HossainM KGhoshS CBoontongkongYThanachayanontCDuttaJ 2005 J. Metastable Nanocryst. Mater. 23 27 http://dx.doi.org/10.4028/www.scientific.net/JMNM.23
- LuGHuebnerK LOcolaL EGajdardziska-JosifovskaMChenJ 2006 J. Nanomater. 60828 1
- NomuraKOhtaHUedaKKamiyaTHiranoMHosonoH 2004 Microelectron. Eng. 72 294 http://dx.doi.org/10.1016/j.mee.2004.01.007
- Lana-VillarrealTBoschlooGHagfeldtA 2007 J. Phys. Chem. C 111 5549 http://dx.doi.org/10.1021/jp0678756
- MiyauchiMLiuZZhaoZ GAnandanSHaraK 2010 Chem. Commun. 46 1529 http://dx.doi.org/10.1039/b921010e
- TanBTomanELiYWuY 2007 J. Am. Chem. Soc. 129 4162 http://dx.doi.org/10.1021/ja070804f
- StambolovaIKonstantinovKKovachevaDPeshevPDonchevT 1997 J. Solid State Chem. 128 305 http://dx.doi.org/10.1006/jssc.1996.7174
- YuJ HChoiG M 2001 Sensors Actuators B 72 141 http://dx.doi.org/10.1016/S0925-4005(00)00642-0
- HeZ QXiongL ZXiaoZ BMaM YWuX MHuangK L 2005 Trans. Nonferrous Met. Soc. China (Engl. edn) 15 1420
- RongAGaoX PLiG RYanT YZhuH YQuJ QSongD Y 2006 J. Phys. Chem. B 110 14754 http://dx.doi.org/10.1021/jp062875r
- XuJZhangHPanQXiangQLiC 2007 Kuei Suan Jen Hsueh Pao/ J. Chin. Ceram . Soc. 35 978
- FuXWangXLongJDingZYanTZhangGZhangZLinH 2009 J. Solid State Chem. 182 517 http://dx.doi.org/10.1016/j.jssc.2008.11.029
- WangSYangZLuMZhouYZhouGQiuZZhangHZhangA 2007 Mater. Lett. 61 3005 http://dx.doi.org/10.1016/j.matlet.2006.07.197
- LouXJiaXXuJLiuSGaoQ 2006 Mater. Sci. Eng. A 432 221 http://dx.doi.org/10.1016/j.msea.2006.06.010
- CunWXinmingWJincaiZBixianMGuoyingSPing'anPJiamoF 2002 J. Mater. Sci. 37 2989 http://dx.doi.org/10.1023/A:1016077216172
- ZhangYGuoMZhangMYangCMaTWangX 2007 J. Cryst. Growth 308 99 http://dx.doi.org/10.1016/j.jcrysgro.2007.07.030
- CusackP AMonkA WPearceJ AReynoldsS J 1989 Fire Mater. 14 23 http://dx.doi.org/10.1002/(ISSN)1099-1018
- BaruahSDuttaJ 2009 Sci. Technol. Adv. Mater. 10 013001 http://dx.doi.org/10.1088/1468-6996/10/1/013001
- HeRLawMFanRKimFYangP 2002 Nano Lett. 2 1109 http://dx.doi.org/10.1021/nl0257216
- HuJBandoYLiuZ 2003 Adv. Mater. 15 1000 http://dx.doi.org/10.1002/adma.200304825
- HuJ QMengX MJiangYLeeC SLeeS T 2003 Adv. Mater. 15 70 http://dx.doi.org/10.1002/(ISSN)1521-4095
- JiangYMengX MLiuJHongZ RLeeC SLeeS T 2003 Adv. Mater. 15 1195 http://dx.doi.org/10.1002/adma.200304852
- WenJ GLaoJ YWangD ZKyawT MFooY LRenZ F 2003 Chem. Phys. Lett. 372 717 http://dx.doi.org/10.1016/S0009-2614(03)00485-8
- KuoC WShiuJ YChoY HChenP 2003 Adv. Mater. 15 1065 http://dx.doi.org/10.1002/adma.200304824
- BaruahSDuttaJ 2009 J. Cryst. Growth 311 2549 http://dx.doi.org/10.1016/j.jcrysgro.2009.01.135
- SuliemanK MHuangXLiuJTangM 2007 Mater. Lett. 61 1756 http://dx.doi.org/10.1016/j.matlet.2006.07.179
- ChrissanthopoulosABaskoutasSBouropoulosNDracopoulosVTasisDYannopoulosS N 2007 Thin Solid Films 515 8524 http://dx.doi.org/10.1016/j.tsf.2007.03.146
- KeatingC DNatanM J 2003 Adv. Mater. 15 451 http://dx.doi.org/10.1002/adma.200390105
- ZhangR QLifshitzYLeeS T 2003 Adv. Mater. 15 635 http://dx.doi.org/10.1002/adma.200301641
- DengZQiJZhangYLiaoQHuangYCaoJ 2008 Acta Phys.—Chim. Sinica 24 193 http://dx.doi.org/10.1016/S1872-1508(08)60008-X
- WalterE CMurrayB JFavierFPennerR M 2003 Adv. Mater. 15 396 http://dx.doi.org/10.1002/adma.200390089
- YanHHeRJohnsonJLawMSaykallyR JYangP 2003 J. Am. Chem. Soc. 125 4728 http://dx.doi.org/10.1021/ja034327m
- PalmerG BPoeppelmeierK RMasonT O 1997 J. Solid State Chem. 134 192 http://dx.doi.org/10.1006/jssc.1997.7576
- ChenHWangJYuHYangHXieSLiJ 2005 J. Phys. Chem. B 109 2573 http://dx.doi.org/10.1021/jp046125y
- Alpuche-AvilesM AWuY 2009 J. Am. Chem. Soc. 131 3216 http://dx.doi.org/10.1021/ja806719x
- ZhaoJ WQinL RZhangL D 2007 Solid State Commun. 141 663 http://dx.doi.org/10.1016/j.ssc.2007.01.013
- WangCXuB Q 2009 J. Mater. Sci. 44 919 http://dx.doi.org/10.1007/s10853-008-3190-0
- FangJHuangAZhuPXuNXieJChiJFengSXuRWuM 2001 Mater. Res. Bull. 36 1391 http://dx.doi.org/10.1016/S0025-5408(01)00621-3
- ZhuHYangDYuGZhangHJinDYaoK 2006 J. Phys. Chem. B 110 7631 http://dx.doi.org/10.1021/jp060304t
- CushingB LKolesnichenkoV LO'ConnorC J 2004 Chem. Rev. 104 3893 http://dx.doi.org/10.1021/cr030027b
- MallinM PMurphyC J 2002 Nano Lett. 2 1235 http://dx.doi.org/10.1021/nl025774n
- XiaYYangPSunYWuYMayersBGatesBYinYKimFYanH 2003 Adv. Mater. 15 353 http://dx.doi.org/10.1002/adma.200390087
- PatzkeG RKrumeichFNesperR 2002 Angew. Chem., Int. Ed. Engl. 41 2446 http://dx.doi.org/10.1002/(ISSN)1521-3773
- ZengJXinMLiKWangHYanHZhangW 2008 J. Phys. Chem. C 112 4159 http://dx.doi.org/10.1021/jp7113797
- JieJWangGHanXFangJYuQLiaoYXuBWangQHouJ G 2004 J. Phys. Chem. B 108 8249 http://dx.doi.org/10.1021/jp049230g
- WangJ Xet al 2004 J. Cryst. Growth 267 177 http://dx.doi.org/10.1016/j.jcrysgro.2004.03.052
- WangJ Xet al 2004 Solid State Commun. 131 435 http://dx.doi.org/10.1016/j.ssc.2004.06.009
- WangLZhangXLiaoXYangW 2005 Nanotechnology 16 2928 http://dx.doi.org/10.1088/0957-4484/16/12/034
- KovachevaDPetrovK 1998 Solid State Ion. 109 327–32 http://dx.doi.org/10.1016/S0167-2738(97)00507-9
- FuGChenHChenZZhangJKohlerH 2002 Sensors Actuators B 81 308 http://dx.doi.org/10.1016/S0925-4005(01)00971-6
- KurzABrakechaKPuetzJAegerterM A 2006 Thin Solid Films 502 212 http://dx.doi.org/10.1016/j.tsf.2005.07.276
- NikolićNSrekoviTRistiM M 2001 J. Eur. Ceram. Soc. 21 2071 http://dx.doi.org/10.1016/S0955-2219(01)00174-1
- XuJJiaXLouXShenJ 2006 Solid-State Electron. 50 504 http://dx.doi.org/10.1016/j.sse.2006.02.001
- FolettoE LJahnS LDe Fatima PeraltaMuniz Moreira R 2009 J. Appl. Electrochem. 40 59 http://dx.doi.org/10.1007/s10800-009-9967-2
- FanHZengYXuXLvNZhangT 2010 Sensors Actuators B doi:10.1016/j.snb.2010.10.026
- ZengYZhangTFanHLuGKangM 2009 Sensors Actuators B 143 449 http://dx.doi.org/10.1016/j.snb.2009.07.021
- D RLide 2005Handbook of Chemistry and Physics Boca Raton, FL CRC Press
- ZhuX JGengL MZhangF QLiuY XChengL B 2009 J. Power Sources 189 828 http://dx.doi.org/10.1016/j.jpowsour.2008.07.028
- DurigJ RBushS FMercerE E 1966 J. Chem. Phys. 44 4238 http://dx.doi.org/10.1063/1.1726612
- BraibantiADallavalleFPellinghelliM ALeporatiE 1968 Inorg. Chem. 7 1430 http://dx.doi.org/10.1021/ic50065a034
- JiXHuangXLiuJJiangJLiXDingRHuYWuFLiQ 2010 J. Alloys Compd. 503 L21 http://dx.doi.org/10.1016/j.jallcom.2009.12.038
- AnnamalaiACarvalhoDWilsonK CLeeM J 2010 Mater. Charact. 61 873 http://dx.doi.org/10.1016/j.matchar.2010.05.011
- ByrappaKHaberM 2001 Hydrothermal Technology for Crystal Growth Park Ridge, NJ Noyes
- YoungD LWilliamsonD LCouttsT J 2002 J. Appl. Phys. 91 1464 http://dx.doi.org/10.1063/1.1429793
- SuYZhuL AXuLChenYXiaoHZhouQFengY 2007 Mater. Lett. 61 351 http://dx.doi.org/10.1016/j.matlet.2006.04.062
- GhoshMRaychaudhuriA K 2008 Nanotechnology 19 445704 http://dx.doi.org/10.1088/0957-4484/19/44/445704
- LeiterF HAlvesH RHofstaetterAHofmannD MMeyerB K 2001 Phys. Status Solidi b 226 R4 http://dx.doi.org/10.1002/(ISSN)1521-3951
- SunYGeorgeNdifor-AngwaforJasonRileyAshfoldM N R 2006 Chem. Phys. Lett. 431 352 http://dx.doi.org/10.1016/j.cplett.2006.09.100
- FuZYangH KMoonB KChoiB CJeongJ H 2009 Curr. Appl Phys. 9 1360 http://dx.doi.org/10.1016/j.cap.2009.02.023
- VanheusdenKSeagerC HWarrenW LTallantD RCarusoJHampden-SmithM JKodasT T 1997 J. Lumin. 75 11 http://dx.doi.org/10.1016/S0022-2313(96)00096-8
- VanheusdenKSeagerC HWarrenW LTallantD RVoigtJ A 1996 Appl. Phys. Lett. 68 403 http://dx.doi.org/10.1063/1.116699
- ChoonH B NWaiY F 2006 J. Phys. Chem. B 110 20801 http://dx.doi.org/10.1021/jp061835k
- TsunekawaSFukudaTKasuyaA 2000 J. Appl. Phys. 87 1318 http://dx.doi.org/10.1063/1.372016
- SmithR A 1978 Semiconductors Cambridge Cambridge University Press
- SatohKKakehiYOkamotoAMurakamiSUrataniFYotsuyaT 2005 Japan. J. Appl. Phys. 44 L34 http://dx.doi.org/10.1143/JJAP.44.L34
- SegevDWeiS H 2005 Phys. Rev. B 71 1 http://dx.doi.org/10.1103/PhysRevB.71.125129
- YoungD LMoutinhoHYanYCouttsT J 2002 J. Appl. Phys. 92 310 http://dx.doi.org/10.1063/1.1483104
- EnokiHNakayamaTEchigoyaJ 1992 Phys. Status Solidi a 129 181 http://dx.doi.org/10.1002/(ISSN)1521-396X
- BelliardFConnorP AIrvineJ T S 2000 Solid State Ion. 135 163 http://dx.doi.org/10.1016/S0167-2738(00)00296-4
- ScaifeD E 1980 Sol. Energy 25 41 http://dx.doi.org/10.1016/0038-092X(80)90405-3
- KashyoutA BSolimanH M AShokryHassanAbousehlyA M 2010 J. Nanomater. 341841
- YaoI CLinPTsengT Y 2010 Adv. Sci. Lett. 3 548
- ChenJLiJXiaoGYangX 2011 J. Alloys Compd. 509 740 http://dx.doi.org/10.1016/j.jallcom.2010.09.043
- BarrecaDBekermannDCominiEDeviAFischerR AGasparottoAMacCatoCSadaCSberveglieriGTondelloE 2010 Cryst. Eng. Commun. 12 3419
- ZengWLiuT MLiuD J 2010 Physica B 405 4235 http://dx.doi.org/10.1016/j.physb.2010.07.017
- MohammadiM RFrayD J 2010 Sensors Actuators B 150 631 http://dx.doi.org/10.1016/j.snb.2010.08.029
- MoonJParkJ ALeeS JZyungTKimI D 2010 Sensors Actuators B 149 301 http://dx.doi.org/10.1016/j.snb.2010.06.033
- KimS JHwangI SChoiJ KLeeJ H 2010 Thin Solid Films 519 2020 http://dx.doi.org/10.1016/j.tsf.2010.10.026
- SenguttuvanT DSrivastavaVTawalJ SMishraMSrivastavaSJainK 2010 Sensors Actuators B 150 384 http://dx.doi.org/10.1016/j.snb.2010.06.053
- BarsanNKoziejDWeimarU 2007 Sensors Actuators B 121 18 http://dx.doi.org/10.1016/j.snb.2006.09.047
- KorotcenkovG 2007 Mater. Sci. Eng. B 139 1 http://dx.doi.org/10.1016/j.mseb.2007.01.044
- KorotcenkovGIvanovMBlinovIStetterJ R 2007 Thin Solid Films 515 3987 http://dx.doi.org/10.1016/j.tsf.2006.09.044
- LupanOChowLShishiyanuSMonaicoEShishiyanuTSonteaVRoldan CuenyaBNaitabdiAParkSSchulteA 2009 Mater. Res. Bull. 44 63 http://dx.doi.org/10.1016/j.materresbull.2008.04.006
- CarottaM Cet al 2009 Sensors Actuators B 137 164 http://dx.doi.org/10.1016/j.snb.2008.11.007
- ChouS MTeohL GLaiW HSuY HHonM H 2006 Sensors 6 1420 http://dx.doi.org/10.3390/s6101420
- CominiEFagliaGSberveglieriGPanZWangZ L 2002 Appl. Phys. Lett. 81 1869 http://dx.doi.org/10.1063/1.1504867
- KoshizakiNOyamaT 2000 Sensors Actuators B 66 119 http://dx.doi.org/10.1016/S0925-4005(00)00323-3
- LeeY ILeeK JLeeD HJeongY KLeeH SChoaY H 2009 Curr. Appl. Phys. 9 S79 http://dx.doi.org/10.1016/j.cap.2008.08.024
- MitraPMukhopadhyayA K 2007 Bull. Polish Acad. Sci. 55 281
- AhnM WParkK SHeoJ HKimD WChoiK JParkJ G 2009 Sensors Actuators B 138 168 http://dx.doi.org/10.1016/j.snb.2009.02.008
- CominiEBarattoCFagliaGFerroniMVomieroASberveglieriG 2009 Prog. Mater. Sci. 54 1 http://dx.doi.org/10.1016/j.pmatsci.2008.06.003
- GrigorievaA VGoodilinE ADerlyukovaL EAnufrievaT ATarasovA BDobrovolskiiY ATretyakovY D 2009 Appl. Catal. A 362 20 http://dx.doi.org/10.1016/j.apcata.2009.04.011
- ZhangMHuCLiuHXiongYZhangZ 2009 Sensors Actuators B 136 128 http://dx.doi.org/10.1016/j.snb.2008.09.021
- MoonW JYuJ HChoiG M 2001 Sensors Actuators B 80 21 http://dx.doi.org/10.1016/S0925-4005(01)00884-X
- LuZTangY 2005 Mater. Chem. Phys. 92 5 http://dx.doi.org/10.1016/j.matchemphys.2004.11.029
- GratzelM 2003 J. Photochem. Photobiol. C 4 145 http://dx.doi.org/10.1016/S1389-5567(03)00026-1
- GratzelM 2004 J. Photochem. Photobiol. A 164 3 http://dx.doi.org/10.1016/j.jphotochem.2004.02.023
- GratzelM 2005 MRS Bull. 30 23 http://dx.doi.org/10.1557/mrs2005.4
- HagfeldtAGrätzelM 2000 Acc. Chem. Res. 33 269 http://dx.doi.org/10.1021/ar980112j
- O'ReganBGrätzelM 1991 Nature 353 737 http://dx.doi.org/10.1038/353737a0
- ChaeJKimD YKimSKangM 2010 J. Ind. Eng. Chem. 16 906
- LeeYChaeJKangM 2010 J. Ind. Eng. Chem. 16 609
- JangS RChoiM JVittalRKimK J 2007 Sol. Energy Mater. Sol. Cells 91 1209 http://dx.doi.org/10.1016/j.solmat.2007.04.007
- AkhtarM SKhanM AJeonM SYangO B 2008 Electrochim. Acta 53 7869 http://dx.doi.org/10.1016/j.electacta.2008.05.055
- BaxterJ BAydilE S 2006 Sol. Energy Mater. Sol. Cells 90 607 http://dx.doi.org/10.1016/j.solmat.2005.05.010
- ChenJLiCSongJ LSunX WLeiWDengW Q 2009 Appl. Surf. Sci. 255 7508 http://dx.doi.org/10.1016/j.apsusc.2009.03.091
- KuC HWuJ J 2007 Nanotechnology 18 505706 http://dx.doi.org/10.1088/0957-4484/18/50/505706
- LeeJ-HParkN-GShinY-J 2011 Sol. Energy Mater. Sol. Cells 95 179 http://dx.doi.org/10.1016/j.solmat.2010.04.027
- Nang DinhNBernardM-CHugot-LeGoffStergiopoulosTFalarasP 2006 Chim. 9 676 http://dx.doi.org/10.1016/j.crci.2005.02.042
- TennakoneKKumaraG R R AKottegodaI R MPereraV P S 1999 Chem. Commun.
- NiinobeDMakariYKitamuraTWadaYYanagidaS 2005 J. Phys. Chem. B 109 17892 http://dx.doi.org/10.1021/jp051753g
- LiBLuoLXiaoTLuLWangJTangY 2010 J. Alloys Compd.