Abstract
We have recently constructed a phenomenological theory that provides a unified explanation for athermal and isothermal martensitic transformation processes. On the basis of this theory, we predict some properties of martensitic transformation and confirm them experimentally using some Fe-based alloys and a Ni–Co–Mn–In magnetic shape memory alloy.
Introduction
Martensitic transformations are classified into two groups with respect to their kinetics: athermal and isothermal transformations. Whereas the former has a well-defined transformation temperature, Ms, and occurs instantaneously, the latter transformation does not have a certain Ms and occurs after some incubation time during isothermal holding [Citation1, Citation2]. Thus, an athermal transformation can be regarded as a special case of isothermal transformation with an undetectably short incubation time [Citation2]. Fe–Ni–Mn and Fe–Ni–Cr alloys are example materials exhibiting isothermal transformations [Citation2–4].
We have demonstrated that an isothermal transformation can change to an athermal one and vice versa when a magnetic field or hydrostatic pressure is applied to iron-based alloys [Citation5–7]. This result means that the two transformation processes are closely related and that their differences are not intrinsic. We have constructed a phenomenological theory [Citation8] that provides a unified explanation for the two transformation processes. The theory makes the following three assumptions: (i) particles (atoms, electrons) must thermally overcome a certain potential energy barrier Δ before they can change the state from austenite to martensite; (ii) the transition probability (Pe) from the austenitic state to martensitic state is proportional to the Boltzmann factor and is expressed as Pe=P0 exp(−Δ/kBT), where P0 and kB are constants; (iii) when Δ≠0, martensitic transformation does not start even if one particle is excited, but it starts when some critical number of particles, n∗, among excited particles, m, form a cluster and are excited in some region of the austenite.
On the basis of these assumptions, the probability (P) of the martensitic transformation was derived as [Citation8]
where N is the total number of particles, n∗ is the minimum number of particles in the cluster required to initiate a martensitic transformation, m and n represent the number of excited particles, and f (N, m, n, n∗) is the possible number of clusters consisting of n particles within m excited particles. Assuming that the well-known ergodic hypothesis holds in the present analysis, the incubation time at which a martensitic transformation starts can be evaluated as P−1. Details of the theory were reported elsewhere [Citation8].
On the basis of this theory, we can predict that (i) isothermal holding at a temperature above Ms induces a martensitic transformation after some finite incubation time in the materials exhibiting an athermal transformation; (ii) a martensitic transformation occurs isothermally after some finite incubation time in the materials in which athermal martensitic transformation is suppressed by a composition change; (iii) a hydrostatic pressure or magnetic field alters the incubation time of the TTT diagram; (iv) the forward martensitic transformation, although usually observed upon cooling, can also occur upon heating. In this paper, we demonstrate the above general predictions on specific examples.
Experimental procedures
We have studied Fe–24.0Ni–4.3Cr (at.%) alloy and three alloys of Fe with 29.9, 31.7 and 32.3 at.% nickel produced by melting the component metals in a high-frequency induction furnace in an argon atmosphere and casting into a water-cooled iron mold. Details of the alloy production and sample preparation were reported in [Citation6, Citation7]. Specimens for electrical resistivity measurements (2×5×0.5 mm) were cut from the ingot, homogenized and solution-treated in a silica capsule filled with argon. Electrical resistivity was measured with or without the application of hydrostatic pressure and/or magnetic field. The hydrostatic pressure was generated using a piston-cylinder-type instrument (1.5 GPa), in which kerosene and transformer oil in a Teflon capsule were used as a liquid pressure medium. The magnetic fields were static (10 MA m−1) and/or pulsed (30 MA m−1).
We also prepared a Ni45Co5Mn36.5In13.5 (at.%) alloy by arc melting. The ingot was cut into several pieces and remelted to improve the homogeneity of the ingot. Then, the ingot was heat-treated at 1173 K for 96 h in an evacuated quartz tube (2×10⁻⁴ Pa) for homogenization and quenching into ice water. Two specimens with dimensions of 1.5×1.5×3 mm were cut from the ingot for magnetization measurements and heat-treated at 623 K for 24 h to increase the long-range order. Then, the oxidized surface layer was removed by electropolishing in an electrolyte composed of 80 vol.% C2H5OH and 20 vol.% HClO4. Magnetization of the specimen was measured with an MPMS system (Quantum Design).
Results
Isothermal holding of Fe–Ni alloys in zero field
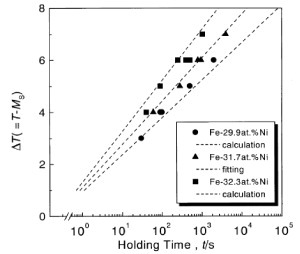
Four-probe electrical resistivity measurements yielded Ms temperatures of 212, 153 and 125 K for alloys of Fe with 29.9, 31.7 and 32.3 at.% of nickel, respectively. The cooling and heating rates were conventionally set to 0.05 K s−1. Then, isothermal holding experiments were carried out by setting a temperature above Ms to induce a martensitic transformation after some incubation time. A typical result for the Fe–31.7Ni alloy is shown in figure . The martensitic transformation occurs instantaneously after a finite incubation time of 1020 s during isothermal holding. This observation agrees well with the prediction based on the phenomenological theory, as mentioned above in (i). Then, we deduced the incubation times of the alloys by varying the holding temperature, and the results are shown in figure . A characteristic feature in the figures is that the incubation time increases with increasing ΔT and decreases with increasing Ni content at a given ΔT for Fe–Ni alloys.
Figure 1 Electrical resistivity as a function of isothermal holding time at ΔT (=T−Ms)=6 K for the Fe–31.7Ni alloy.
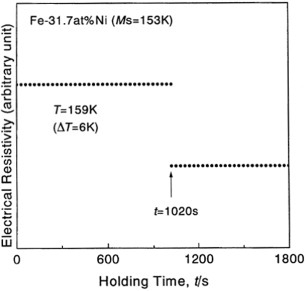
Figure 2 Relationship between holding temperature and incubation time required to initiate the martensitic transformation in Fe–29.9Ni, Fe–31.7Ni and Fe–32.3Ni alloys.
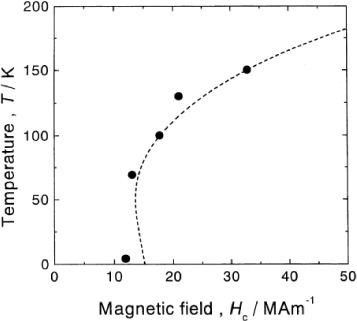
Next, we measured the electrical resistivity during isothermal holding for the Fe–32.6Ni alloy which does not show any athermal martensitic transformation even at 4.2 K. This measurement aimed to confirm the occurrence of martensitic transformation after some incubation time, as mentioned above in (ii). We found that a martensitic transformation occurs after a certain incubation time during isothermal holding at temperatures between 77 and 125 K, and the TTT diagram is a C-curve with the `nose' temperature of about 85 K, as shown in figure . This result is in good agreement with the above prediction (ii). Then, we applied a pulsed high magnetic field to the alloy at 4.2 K and the result is shown in figure . The martensitic transformation occurs instantaneously in a critical magnetic field indicated with an arrow. The critical magnetic field was deduced by varying the temperature and the result is shown in figure . The critical field increases with increasing temperature, which is the same behavior as in the alloys exhibiting an athermal martensitic transformation [Citation6]. The obtained relation between the temperature and the critical magnetic field agrees well with the values calculated using the equation derived in [Citation6], as shown by the dotted line in the figure. This result demonstrates that the isothermal process changes to the athermal process in high magnetic field, as mentioned in the introduction.
Figure 3 TTT diagram of the isothermal martensitic transformation in the Fe–32.6Ni alloy.
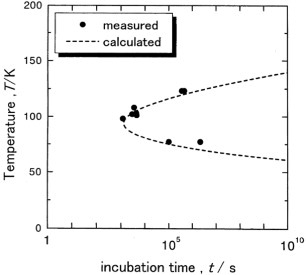
Figure 4 Magnetization versus magnetic field at 4.2 K for the Fe–32.6Ni alloy.
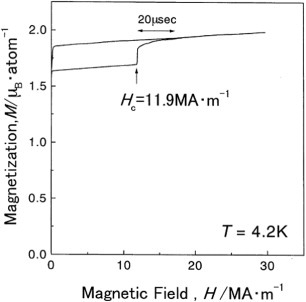
Figure 5 Relation between critical magnetic field and temperature for the Fe–32.6Ni alloy. The dotted line indicates values calculated with the equation proposed in [Citation6].
Isothermal holding of Fe–24.0Ni–4.3Cr alloy under hydrostatic pressure or in magnetic field
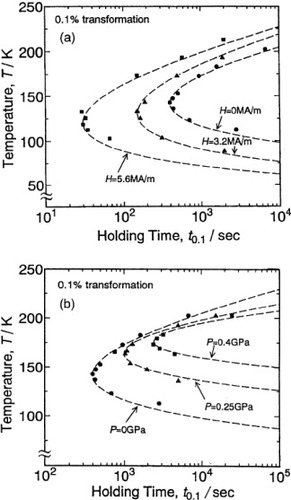
We have conducted isothermal holding measurements on the Fe–24.0Ni–4.3Cr (at.%) alloy in a static magnetic field and under a hydrostatic pressure in order to construct TTT diagrams. In these experiments, we applied magnetic fields lower than the critical one to avoid an instantaneous martensitic transformation [Citation5]. The TTT diagrams obtained for two values of static magnetic field are shown by the solid triangles (3.2 MA m−1) and solid squares (5.6 MA m−1) in figure (a), and the zero-field TTT diagram (solid circles) is also added for comparison. These TTT diagrams are C-curves with the lower nose temperatures and shorter incubation times than those in the zero-field diagram, and their shapes agree well with the theoretical prediction [Citation8]. The shift of the nose temperature and the incubation time increase with increasing magnetic field. Similar isothermal holding measurements were performed under hydrostatic pressure. The results are shown by the solid triangles (0.25 GPa) and solid squares (0.4 GPa) in figure (b), and the zero-pressure TTT diagram is represented by the solid circles. These TTT diagrams are also C-curves. Their nose temperature is higher and the incubation time is longer than those in the zero-pressure diagram, and their shapes agree well with the theoretical prediction [Citation8]. The shift of the nose temperature and the incubation time increase with increasing hydrostatic pressure. The incubation time at each set temperature is plotted in figures (a) and (b); these data were averaged over five measurements and the accuracy of the nose temperature is ±5 K.
Figure 6 TTT diagrams of the isothermal martensitic transformation in (a) Fe–24.0Ni–4.3Cr (at.%) alloy in static magnetic fields and (b) under hydrostatic pressures. The dotted lines represent the TTT diagrams calculated with the theory developed in [Citation8].
Martensitic transformation on heating a Ni–Mn–In–Co alloy
In most iron-based alloys, the application of a magnetic field promotes martensitic transformation. In contrast, the magnetic field suppresses the martensitic transformation in a Ni–Co–Mn–In magnetic shape memory alloy [Citation9, Citation10] because the magnetization of the parent phase is larger than that of the martensite phase. An interesting phenomenon was reported for this alloy in [Citation10], that is the martensitic transformation occurs upon heating. Such behavior can also be explained by our theory [Citation8].
According to our theory [Citation8], the TTT diagram of a Ni–Co–Mn–In alloy should exhibit a C-curve as shown by curve `A' in figure . The application of a magnetic field should affect the incubation time of martensitic transformation, namely, shorten it for the Fe–24.0Ni–4.3Cr alloy (see figure (a)). This shortening occurs because the magnetization of the martensite phase in the alloy is larger than that of the parent phase, and consequently, the potential barrier is lowered by the application of a magnetic field. In contrast, for a Ni–Co–Mn–In alloy, the magnetization of the martensite phase is smaller than that of the parent phase, and the application of a magnetic field should extend the incubation time. Considering the C-curve mentioned above, the specimen can be cooled to 4.2 K without initiating a martensitic transformation in a magnetic field because the cooling curve does not intersect the C-curve (curve `B' in figure ).
Figure 7 Schematic TTT diagram showing the effect of magnetic field on the proposed C-curves for a Ni–Co–Mn–In alloy. Transformation occurs at Ms upon cooling in zero magnetic field as shown in (a), but is suppressed by the field (b). Upon heating in zero field after the field cooling process, the transformation starts at Ms' as shown in (c).
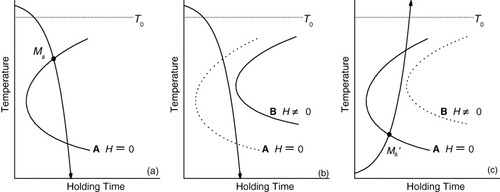
If the magnetic field is switched off at 4.2 K, then the C-curve returns to the original position (curve `A'). However, the incubation time is very long at 4.2 K, which is far below the nose temperature of the C-curve, and thus, the martensitic transformation is hindered at 4.2 K even in zero field. Thus, we can retain the parent phase at 4.2 K. Upon heating in zero field, the transformation occurs by intersecting the C-curve, as indicated by the point Ms' in figure . This is the reason why the martensitic transformation occurs upon heating in the Ni–Co–Mn–In alloy.
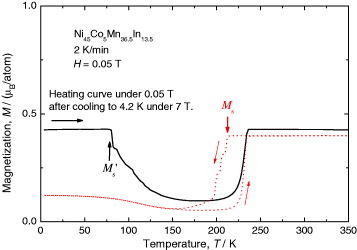
Our theory also predicts that martensitic transformation should occur after some incubation time if the specimen is kept above Ms or below Ms', which we confirmed for the Ni45Co5Mn36.5In13.5 alloy as follows. The dotted curve in figure shows the temperature dependence of magnetization of the Ni45Co5Mn36.5In13.5 alloy measured in a low magnetic field of 0.05 T. There is a sharp decrease in magnetization at 214 K during the cooling process. This sharp decrease is due to martensitic transformation, and its Ms can be defined as 214 K. This Ms value depends strongly on the magnetic field, and the martensitic transformation on cooling is completely suppressed in a magnetic field of 1.6 MA m−1 or higher. The transformation is also suppressed by switching off the magnetic field at 4.2 K as mentioned above. During the subsequent heating (2 K min−1) in a low magnetic field of 4.5 kA m−1, the magnetization decreases sharply at 85 K as shown by the solid curve in figure . This decrease is due to the martensitic transformation as predicted in figure (c), and the Ms' value is 85 K. The difference in the magnetization between the solid curve and dotted curve in the parent phase originates from the difference in the magnetic domain structure.
Figure 8 Magnetization curves showing martensitic transformation upon cooling (dotted curve) and heating (solid curve) in Ni45Co5Mn36.5In13.5 alloy. The dotted curve was measured on cooling and subsequent heating in 0.05 T. The solid curve was measured upon heating in 0.05 T after cooling in 7 T.
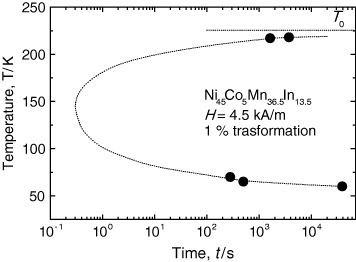
We have also confirmed the existence of incubation time for the martensitic transformation in the Ni45Co5Mn36.5In13.5 alloy above Ms and below Ms'. Then, by evaluating the fraction of the martensite phase as a function of time, we have obtained the TTT diagram for the 1% formation of martensite phase in the Ni45Co5Mn36.5In13.5 alloy as shown in figure . The TTT diagram near the nose temperature is not completed yet, and the dotted curve is just a guide for the eyes.
Figure 9 A segment of TTT diagram for 1% transformation of the martensite phase in the Ni45Co5Mn36.5In13.5 alloy.
In this way, we can rationalize the martensitic transformation in the Ni–Co–Mn–In alloy with the model described above.
Discussion
We have shown that the incubation time required for the formation of martensites, which is observed by setting a temperature above Ms, increases with increasing ΔT for Fe–Ni alloys. In this section, we explain this result with an approximate equation for the incubation time, P−1 (P is the probability of the martensitic transformation) which was derived in [Citation8]:
Here, A, m∗ and B are temperature-independent parameters and Δ is the potential barrier between the parent and the martensite phase. By fitting equation (2) to the experimental relation between incubation time and ΔT, we obtain the respective values of A, m∗ and B for the Fe–31.7Ni alloy as 6.46×1065, 800 and 150, and the fit is shown by a dotted line in figure . Then, we calculated the ΔT(t) relations for Fe–29.9Ni and Fe–32.3Ni alloys with equation (2) using the same values of A, m∗ and B, and plotted them with dotted lines in figure . The calculated values agree well with the experiment, and confirm that the incubation time required for the martensite formation increases with increasing ΔT and decreases with increasing Ni content at a given ΔT.
The same analysis was conducted for the Fe–32.6Ni alloy using the same parameters A, m∗ and B mentioned above, and the result is indicated in figure by the dotted line. Here again, the calculation agrees well with the experiment. We also calculated the TTT diagrams of the Fe–24.0Ni–4.3Cr (at.%) alloy in static magnetic fields and under hydrostatic pressures. The potential barrier Δ of the alloy in a magnetic field and under hydrostatic pressure was calculated in [Citation8] using the ΔG(T) function derived in [Citation11]. The results are shown with dotted lines in figures (a) and (b), together with the zero-field TTT diagram. The C-curves are reproduced well, once again confirming the validity of our theory.
Conclusions
On the basis of the experimental results reported here, we conclude that our theory [Citation8] successfully explains the time-dependent nature of athermal and isothermal martensitic transformations in Fe–Ni and Fe–Ni–Cr alloys, and that there is a clear distinction between these two transformation processes.
Using the fit parameter m∗, which represents the number of particles in the cluster required to initiate a martensitic transformation, and the previously obtained lattice parameter of the parent phase [Citation5, Citation6], it is possible to estimate the cluster size needed to induce a martensitic transformation. This size is smaller than 2 nm3 for all the alloys considered in this study and is almost the same as that in the previous studies [Citation12, Citation13].
Acknowledgment
This work was partially supported by Priority Assistance for the Formation of Worldwide Renowned Centers of Research—The Global COE Program (Project: Center of Excellence for Advanced Structural and Functional Materials Design) from MEXT, Japan.
References
- KaufmanLCohenM 1958 Prog. Metal Phys. 7 165 http://dx.doi.org/10.1016/0502-8205(58)90005-4
- KurdjumovG VMaksimovaO P 1948 Dokl. Akad. Nauk SSSR 61 83
- GuptaS KRaghavanV 1975 Acta Metall. 23 1239 http://dx.doi.org/10.1016/0001-6160(75)90042-5
- KajiwaraS 1992 Mater. Trans. JIM 33 1027
- KakeshitaTSatoYSaburiTShimizuKMatsuokaYKindoK 1999 Mater. Trans. JIM 40 100
- KakeshitaTShimizuKFunadaSDateM 1985 Acta Metall. 33 1381 http://dx.doi.org/10.1016/0001-6160(85)90039-2
- KakeshitaTKuroiwaKShimizuKIkedaTYamagishiADateM 1993 Mater. Trans. JIM 34 415
- KakeshitaTKuroiwaKShimizuKIkedaTYamagishiADateM 1993 Mater. Trans. JIM 34 423
- KainumaRImanoYItoWSutouYMoritoHOkamotoSKitakamiOOikawaKFujitaAKanomataTIshidaK 2006 Nature 439 957 http://dx.doi.org/10.1038/nature04493
- ItoWItoKUmetsuRYKainumaRKoyamaKWatanabeKFujitaAOikawaKIshidaKKanomataT 2008 Appl. Phys. Lett. 92 021908 http://dx.doi.org/10.1063/1.2833699
- KorenkoM K 1973 Doctoral thesis MIT, Cambridge, USA
- KakeshitaTTakeguchiTFukudaTSaburiT 1996 Mater. Trans. JIM 37 299
- KakeshitaTYamamotoTShimizuKSugiyamaKEndoS 1995 Mater. Trans. JIM 36 1018