Abstract
Nine diffusion couples and 32 key samples were prepared to map the phase diagram of the Ca–Mg–Zn system. Phase relations and solubility limits were determined for binary and ternary compounds using scanning electron microscopy, electron probe microanalysis and x-ray diffraction (XRD). The crystal structure of the ternary compounds was studied by XRD and electron backscatter diffraction. Four ternary intermetallic (IM) compounds were identified in this system: Ca3MgxZn15−x (4.6x12 at 335 °C, IM1), Ca14.5Mg15.8Zn69.7 (IM2), Ca2Mg5Zn13 (IM3) and Ca1.5Mg55.3Zn43.2 (IM4). Three binary compounds were found to have extended solid solubility into ternary systems: CaZn11, CaZn13 and Mg2Ca form substitutional solid solutions where Mg substitutes for Zn atoms in the first two compounds, and Zn substitutes for both Ca and Mg atoms in Mg2Ca. The isothermal section of the Ca–Mg–Zn phase diagram at 335 °C was constructed on the basis of the obtained experimental results. The morphologies of the diffusion couples in the Ca–Mg–Zn phase diagram at 335 °C were studied. Depending on the terminal compositions of the diffusion couples, the two-phase regions in the diffusion zone have either a tooth-like morphology or contain a matrix phase with isolated and/or dendritic precipitates.
Introduction
As weight reduction is one of the major means of improving fuel efficiency, magnesium-based alloys have attracted considerable attention as the lightest structural materials for the aerospace and automotive applications. The addition of calcium has been recently reported as a replacement to costly rare earth metals [Citation1]. It is well known that the addition of up to 0.3 wt.% Ca increases ductility through grain size refinement [Citation2]. Ca also enhances the strength, castability and creep and corrosion resistance of Mg alloys [Citation3], whereas the addition of Zn to binary Mg–Ca alloys improves the age hardening response [Citation4]. While many researchers [Citation2–4] have concentrated on the Mg-rich compositions, a biocompatible metallic glass has recently been found by Zberg et al [Citation5, Citation6] in Ca–Mg–Zn alloys containing approximately 28 at.% Zn. This metallic glass shows great potential for the development of biodegradable implants. Thus, Ca–Mg–Zn alloys are promising next-generation materials for transportation and biomedical applications, and clarifying their phase diagram and crystallography is important.
Although many researchers [Citation7–14] studied the solubility range and crystal structure of Ca2Mg6Zn3, their results are contradictory. Paris [Citation7] reported a ternary compound with the composition Ca2Mg5Zn5, as shown in figure . Using metallography and powder x-ray diffraction (XRD), Clark [Citation8] characterized two solid solutions β and ω as shown in figure and determined the compositions of two ternary compounds as Ca2Mg6Zn3 and Ca2Mg5Zn13 [Citation9, Citation10]. Clark [Citation9] and Larinova et al [Citation11] reported that Ca2Mg6Zn3 has a hexagonal structure with lattice parameters a=9.725 Å and c=10.148 Å, but they did not mention the space group and structure type. Later, Jardim et al [Citation12, Citation13] and Oh-ishi et al [Citation14] studied this compound by transmission electron microscopy (TEM). They confirmed the Ca2Mg6Zn3 composition which is similar to the compound reported by Clark [Citation9]. However, they mentioned that this compound has a Si2Te6Mn3-like trigonal structure with space group and lattice parameters a=9.7 Å and c=10 Å, which disagrees with the hexagonal structure reported by Clark [Citation9] and Larinova et al [Citation11]. More recently, the homogeneity range and crystal structure of this Mg-rich solid solution have been studied by scanning electron microscopy (SEM), electron probe microanalysis/wavelength dispersion spectroscopy (EPMA/WDS), TEM and XRD by our group [Citation15]. The Ca3MgxZn15−x (4.6x12) compositions at 335 °C and a Sc3Ni11Si4-like hexagonal structure with space group P63/mmc (No. 194) were assigned to this alloy.
Figure 1 Isothermal section of the Ca–Mg–Zn system at 335 °C, redrawn from the database of Wasiur-Rahman and Medraj [Citation17], including comparison of the ternary compounds reported in [Citation7–14].
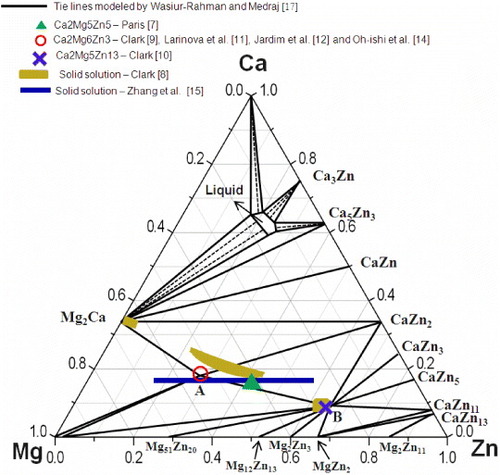
Brubaker and Liu [Citation16] and Wasiur-Rahman and Medraj [Citation17] modeled the Ca–Mg–Zn ternary phase diagram and included two ternary compounds. They did not consider the ternary homogeneity ranges. The thermodynamic model proposed by Brubaker and Liu [Citation16] was based on the random mixing of atoms in the liquid phase and thus cannot properly deal with short-range ordering. Wasiur-Rahman and Medraj reanalyzed this system using a modified quasichemical model [Citation17], and the isotherm at 335 °C, calculated in terms of mole fraction based on their work, is shown in figure .
The present study employs the high throughput diffusion couple technique, a valuable experimental approach for mapping the phase diagram of ternary systems [Citation18–22]. In the solid–solid diffusion couples or diffusion multiples, there are no problems associated with melting or powder contamination since all the phases form by diffusion reactions of the bulk constituents at the temperature of interest [Citation23]. Within the diffusion layers the equilibrium phases occur, whereas at the interface only local equilibrium takes place [Citation23]. However, the diffusion couple approach is not infallible, and when it is used to determine phase diagrams, one should always consider the possibility of missing phases [Citation20, Citation23]. This may occur because the nucleation of these phases can be so slow that the formed diffusion layers are too thin to be detected by EPMA. This can result in inaccuracies in estimating tie-line compositions for these phases because of errors in extrapolating few-point data. To solve this problem and to ensure the consistency of analysis, other diffusion couples with different terminal compositions should be used to compare and determine the phase equilibria. It is also important to verify whether the known binary and ternary phases form. Furthermore, to guarantee the precision and reliability of the information obtained, a combination of the diffusion couple technique with an investigation of selected equilibrated alloys is desirable, especially for regions where the exact phase boundaries are questionable.
Experimental procedures
Nine diffusion couples and 32 key alloys were prepared to map the entire Ca–Mg–Zn composition range at 335 °C based on the preliminary thermodynamic model of Wasiur-Rahman and Medraj [Citation17]. The starting materials were Mg (purity 99.98%), Zn (99.99%) ingots and Ca (99%) supplied by Alfa Aesar. The key alloys were prepared in an arc-melting furnace with water-cooled copper crucible in an argon atmosphere using a non-consumable tungsten electrode. Samples were remelted five times to ensure their homogeneity.
Solid–solid and solid–liquid diffusion couples
To prepare solid–solid diffusion couples, the contacting surfaces are grinded down to 1200 grit SiC paper and polished using 1 μm water-based diamond suspension with 99% pure ethanol as a lubricant. Two end members were carefully pressed, clamped with a steel ring, placed in a Ta container and sealed in a quartz tube. The tube was filled with argon to avoid the reaction of Mg and Ca with oxygen and nitrogen. The tube was annealed at 335 °C for 4 weeks followed by quenching in water. The terminal compositions of the solid–solid diffusion couples are shown in figure (a).
Figure 2 Terminal compositions of the diffusion couples superimposed on the calculated isothermal section of the Ca–Mg–Zn system at 335 °C based on [Citation17]: (a) six solid–solid diffusion couples; (b) three solid–liquid diffusion couples.
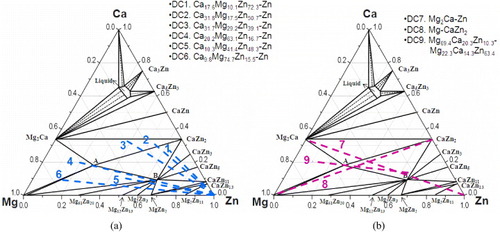
When the solid–solid diffusion couples failed, solid–liquid diffusion couples were used instead. A block of an alloy with the a melting temperature was melted on top of an alloy with a higher melting temperature in an arc-melting furnace in an Ar atmosphere and maintained at 335 °C for 4 weeks. The terminal compositions of the solid–liquid diffusion couples are illustrated in figure (b).
Preparation of key samples
Key samples were encapsulated in tantalum foil, sealed in a quartz tube in an Ar atmosphere, annealed at 335 °C for 4 weeks in an arc-melting furnace and quenched in water. The actual composition of the samples is determined by inductively coupled plasma mass spectrometry (ICP-MS). The difference between the nominal and measured compositions was within 3 at.% in most cases.
Characterization of samples
Diffusion couples and key samples were characterized by SEM, EPMA/WDS), electron backscattered diffraction (EBSD) and XRD. The microstructure, layer thickness, phase composition and homogeneity ranges were analyzed by quantitative EPMA (JEOL-JXA-8900, 2 μm probe diameter, 15 kV accelerating voltage, 20 nA probe current). Phi-Rho-Z matrix corrections (modified ZAF) were applied in the analysis. The error of the EPMA measurements is estimated to be about ±2 at.%. This value is obtained using statistical analysis of the compositions of selected phases from several samples. The phase composition measurements were performed perpendicular to the interfaces between every two adjacent phases in the diffusion couples. The equilibrium compositions of each phase were obtained by extrapolating the composition–distance curves for each element to the phase boundaries [Citation20, Citation24].
XRD was used for phase analysis and determination of the solubility limits in the key alloys. The XRD patterns were acquired using a PANalytical X'pert Pro powder x-ray diffractometer (CuKα radiation) at 45 kV and 40 mA in the angular range of 2θ=20 to 120° with a 0.02° step. The patterns were analyzed with X'Pert HighScore Plus Rietveld analysis software in combination with Pearson's crystal database [Citation25].
To improve the surface condition for EBSD measurements, the samples were first subjected to a standard mechanical metallographic procedure, then cleaned with plasma, ion milled, and again cleaned with plasma. Three successive stages of ion milling were used for the diffusion couples (DCs) with a current of 5 mA and accelerating voltages of 3.5 kV for 2 h, 2.5 kV for 30 min and 1.5 kV for 30 min. EBSD is a powerful and efficient technique for crystal structure identification with a high spatial resolution [Citation26]. EBSD analysis was performed using a Hitachi SU-70 Schottky-SEM equipped with a Nordlys F+ camera and Oxford HKL Channel 5 software. Typical operation parameters were a 20 kV accelerating voltage and a 13 nA beam current. Surface topographic features were observed in secondary electron images (SEIs). Phases were identified by comparing experimental Kikuchi diffraction patterns with patterns computer-generated from the known structure parameters.
Results and discussion
Isothermal section at 335 °C through diffusion couples
Solid–solid diffusion couples
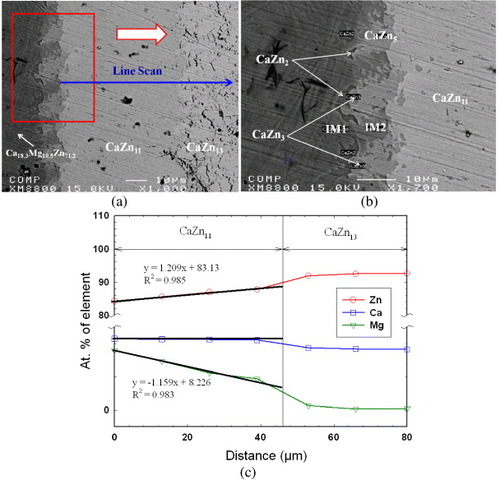
Figures (a) and (b) show backscatter electron (BSE) images of the solid–solid DC1 with gradually increased magnification of the area of interest. During heat treatment, extensive interdiffusion of Ca, Mg and Zn took place allowing various equilibrium phases to form. An EPMA line scan was used to determine the solubility ranges of CaZn11, CaZn13 and Zn phases, as shown in figures (a) and (c). Spot analysis was carried out to deduce the composition of minor phases, such as CaZn5 and IM2. On the basis of the compositional EPMA information, ternary and binary intermetallic compounds were identified and the solid solubility of the binary compounds extending into ternary system was evaluated. By taking advantage of the local equilibrium at the interfaces formed between the phases, the sequence of phases along the diffusion path was deduced as: CaZn2+(IM1)→ CaZn2+IM2 → CaZn3+IM2 → CaZn5+IM2→ CaZn5+(CaZn11)→ (CaZn11)→CaZn13→ Zn. The following three-phase triangulations were identified from figure (b): CaZn2, (IM1) and IM2; CaZn2, IM2 and CaZn3; CaZn3, IM2 and CaZn5; and CaZn5, IM2 and CaZn11. Two ternary intermetallic compounds were identified in this diffusion couple by EPMA spot analysis: IM1 with the composition of 16.7 at.% Ca, 26.0 at.% Mg and 57.3 at.% Zn and a new ternary stoichiometric compound IM2 with the composition Ca14.4Mg15.8Zn69.8. Figure (c) summarizes the results of an 80 μm EPMA line scan across the diffusion couple. It reveals that the CaZn11 phase forms a substitutional solid solution where Mg substitutes for Zn atoms while the Ca content remains constant at 8.3 at.%. On the other hand, CaZn13 does not show significant solid solubility. The least-squares approximation was used to obtain the solubility limits of the CaZn11 phase. The Mg and Zn concentration profiles show that the substitution of Zn by Mg takes place, along with their diffusion, demonstrating that CaZn11 forms a substitutional solid solution. The deviation from linearity is about ±1 at.%, which is within the accuracy of the EPMA measurements.
Figure 3 (a, b) BSE images of the solid–solid DC1 annealed at 335 °C for 4 weeks, showing the formation of seven intermetallic compounds and the tooth like morphology; (c) composition profile along the line scan shown in (a).
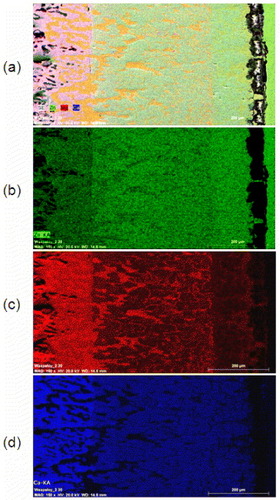
The BSE image of the solid-solid DC5 (figure (a)) shows the formation of five different intermetallic compounds. On the basis of the compositional information obtained from quantitative EPMA, EBSD analysis was performed to verify the crystallographic information. Two ternary intermetallic compounds IM1 (hP36) and IM3 (hP92) and the extended solid solubility of CaZn13 (cF112) in the ternary system were confirmed by both EPMA and EBSD. Determination of the crystal structure by EBSD is extremely useful for analyzing this system near the Zn-rich corner since several phases have similar compositions and EPMA data alone could not be enough to distinguish them. For instance, the extended binary homogeneity ranges are very close for Ca(Mg,Zn)11 (8.3 at.% Ca) and Ca(Mg,Zn)13 (7.1 at.% Ca). Also, owing to the extensive amount of Mg concentration (15.8 at.%) in Ca(Mg,Zn)13, it is very difficult to conclude whether this is an isolated ternary compound or a binary compound with extended solubility into ternary system. Fortunately, this confusion is resolved by EBSD crystal structure determination. Without EBSD, this would require the time-consuming FIB-TEM and selected area electron diffraction analysis to confirm the results. The crystallographic information of intermetallic compound was used for the indexation of Kikuchi diffraction bands using the structure parameters listed in table . A detailed description of the crystal structure of the IM1 ternary compound was reported in our previous paper [Citation15]. The composition, homogeneity range and crystal structure of IM3 ternary phase have been identified and the details will be published elsewhere. Figure (b) shows the EBSD patterns of IM1, IM3 and CaZn13 phases. The maximum and minimum solubilities in CaZn13 were deduced by EPMA, and the structure of CaZn13 was confirmed by EBSD, as shown in figures (a) and (b). Qualitative SEM/EDS mapping clearly demonstrates that CaZn13 forms a substitutional solid solution in which Zn substitutes for Mg atoms while the Ca content remains constant, as illustrated in figure .
Figure 4 (a) BSE images of the solid–solid DC5 annealed at 335 °C for 4 weeks showing the formation of five intermetallic compounds; (b) EBSD patterns of (I) IM1 and (II) IM3 ternary compounds and (III) CaZn13 binary compound having extended solid solubility into ternary system. The right panels are indexed copies of the left EBSD patterns.
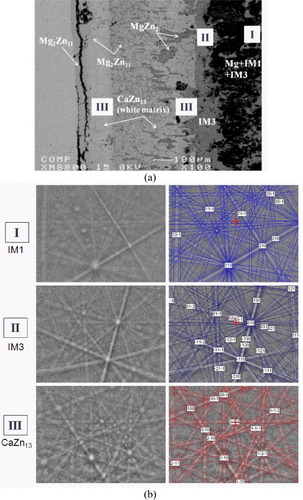
Figure 5 SEM/EDS maps of the solid–solid DC5. The intensity of green, red and blue colors reflects the atomic concentrations of Zn, Mg and Ca, respectively.
Crystallographic information of the phases in the Ca–Mg–Zn system [Citation25].
Analysis of the diffusion reaction zone reveals that the sequence of phases along the diffusion path is: (IM1)+(IM3)+(Mg) → CaZn2+IM2→ (IM3)+(MgZn2)→ (CaZn13)+(MgZn2)→ (CaZn13)+Mg2Zn11→ Mg2Zn11→ Zn. The following three-phase triangulations were identified from figure (a): (IM1), (IM3) and (Mg); (IM3), (CaZn13) and (MgZn2); and (CaZn13), (MgZn2) and Mg2Zn11. IM3 ternary compound has a complex homogeneity range of 8.2–9.1 at.% Ca, 27.1–31.0 at.% Mg and 60.8–64.7 at.% Zn, where Zn atoms substitute for both Ca and Mg atoms. This composition is close to that of the solid solution ω reported by Clark [Citation8]. The solubility of Zn in Mg was measured to be 2.3 at.%, and EPMA indicates no significant solid solubility of Mg2Zn11. This result is consistent with the Mg–Zn binary phase diagram reported by Park and Wyman [Citation27].
Solid–liquid diffusion couples
Solid–liquid diffusion couples cannot be used when preparing solid–solid diffusion couples owing to the brittleness of the end members. A Mg2Ca–Zn solid–liquid diffusion couple was prepared and analyzed. Figure (a) shows a BSE image of the solid–liquid DC7, annealed at 335 °C for 4 weeks, and indicates three intermetallic compounds. Analysis of the diffusion reaction zone indicates the following sequence of phases along the diffusion path: (Mg2Ca)→ (IM1) → (CaZn13) →Zn. Figure (b) shows the analysis of the 120 μm EPMA line scan across the diffusion couple illustrating that Mg2Ca forms a complex solid solution in which Zn substitutes for both Ca and Mg atoms. The IM1 and CaZn13 compounds form substitutional solid solutions in which Mg substitutes for Zn atoms while the Ca content remains constant at 16.7 and 7.3 at.%, respectively. The least-squares approximation was used to establish the elemental concentration profiles of Mg2Ca, IM1 and CaZn13 compounds. The Ca, Mg and Zn concentration profiles of Mg2Ca show that the substitutions of Ca and Mg by Zn have linear relationships with the diffusion distance. Also, the Mg and Zn concentration profiles in IM1 and CaZn13 compounds show that the substitution of Mg by Zn has a linear relationship with the diffusion distance. The deviation from linearity is ±2 at.% for all phases, which is within the EPMA measurement accuracy. On the basis of this diffusion couple, the maximum solid solubility in Mg2Ca was determined by EPMA to be 31.1 at.% Ca, 64.1 at.% Mg and 4.8 at.% Zn, which is consistent with the solubility limit obtained from the solid–solid DC3 and DC4. The minimum and maximum solid solubilities of Mg in the IM1 phase are 38.3 and 44.2 at.%, respectively, and the maximum solid solubility of Mg in CaZn13 is 12.1 at.%.
Figure 6 (a) BSE image of the solid–liquid DC7 annealed at 335 °C for 4 weeks showing the formation of three intermetallic compounds; (b) composition analysis along the line scan shown in (a); (c) partial isothermal section of the Mg–Zn–Ca system obtained from nine diffusion couples annealed at 335 °C for 4 weeks. It summarizes the actual compositions of the key samples used to study the solubility ranges, phase relations and crystal structures of various compounds in the Ca–Mg–Zn system.
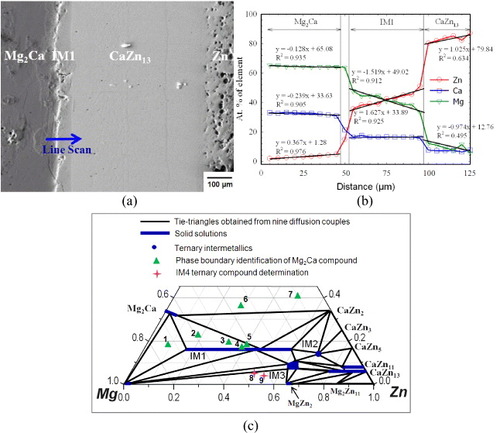
Combining the results obtained from six solid–solid and three solid–liquid diffusion couples provided a wealth of phase equilibrium information. A partial isothermal section of the Ca–Mg–Zn system was constructed at 335 °C, and the phase relations are demonstrated in figure (c). The existence of IM1, IM2 and IM3 ternary phases has been confirmed by these diffusion couples. The IM1 substitutional solid solution was previously studied [Citation15], and IM2 is considered to be a stoichiometric compound. IM3 forms a complex solid solution in which Zn substitutes for both Ca and Mg atoms. On the basis of EPMA, the solid solubility limit in Mg2Ca was determined to be 31.3 at.% Ca, 63.5 at.% Mg and 5.2 at.% Zn, where Zn atoms substitute for both Ca and Mg atoms, which is consistent with the extended solid solution of Mg2Ca phase reported by Clark [Citation8]. CaZn11 and CaZn13 form extended substitutional solid solutions in which Mg substitutes for Zn up to concentrations of 8.4 and 15.5 at.%, respectively. The binary homogeneity range of MgZn2 was determined by EPMA to be 33.3–36.2 at.% Mg and 63.8–66.7 at.% Zn. This result is consistent with the Mg–Zn binary phase diagram reported by Park and Wyman [Citation27]. Besides, the experimental results revealed that the solid–liquid DC9 exhibited tie lines among IM1, IM2 and IM3 compounds in the terminal alloy. This is contradictory to the results for solid–liquid DC7 which shows that IM1 and CaZn13 are in equilibrium. This situation was reported previously [Citation28, Citation29]; it indicates that the local equilibrium is not achieved at the interface because IM2 or IM3 is missing between IM1 and CaZn13 owing to their sluggish nucleation. To improve the reliability of the information obtained from the diffusion couples, 32 selected key alloys were used to study the phase relations, phase boundaries and crystallography of the ternary compounds in the Ca–Mg–Zn system.
Morphological evolution of the reaction zone in the diffusion couples
Solid–solid diffusion couples
In the solid–solid DC1, CaZn11 and CaZn13 phases are the dominant reaction products, as illustrated in the microstructure in figure (a) illustrates. Another morphology of the diffusion zone evolved in this diffusion couple is the tooth like structure shown in figures (a) and (b), which grows in a very irregular fashion, somewhat similar to the finger like structure reported earlier [Citation19, Citation30, Citation31]. However, the concepts and mechanisms of the tooth like and finger like structures are different, as illustrated in figures (a) and (b). In the present work, a two-phase terminal alloy CaZn2+IM1 was prepared, and, to understand the morphology of the tooth like structure model, a diffusion couple with a finger like structure was used for comparison. The diffusion couple can be divided into several sub-diffusion couples. DC1 with the tooth like structure can be considered as several CaZn2–CaZn11 and IM1–CaZn11 sub-diffusion couples. On one hand, the formation of CaZn5 and CaZn3 phases is a result of the interdiffusion reaction between CaZn2 and CaZn11. On the other hand, the IM2 ternary compound forms by the interdiffusion reaction between IM1 and CaZn11, as illustrated with square marks in figure (a). However, in the finger like structure, all the sub-diffusion couples exhibit phases formed by the same interdiffusion reaction. For example, NiSi and NiSi2 phases form as a result of interdiffusion reaction between Ni3Si2 and Si.
Figure 7 Simplified schematic illustration of the morphological characteristics observed in different diffusion couples: (a) tooth like and (b) finger like; (c) possible morphologies in solid–solid diffusion couples when a pure element is attached to a three-phase alloy.
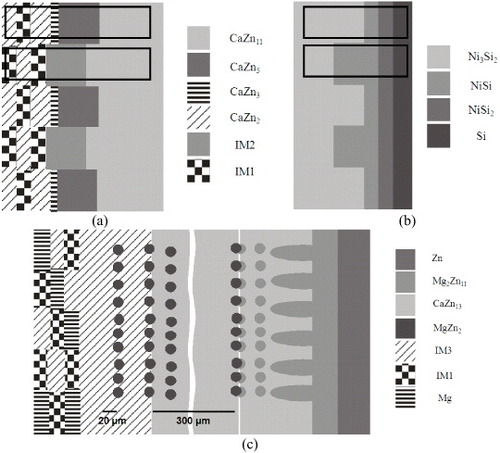
The morphology of the diffusion zone evolved in the solid–solid DC5 is completely different from that of solid–solid DC1. The diffusion reaction starts from the three-phase end member IM1+IM3+Mg, as demonstrated in figure (a); then the morphology changes to a single-phase IM3 layer. Afterwards, the morphology changes to isolated MgZn2 precipitates imbedded in the IM3 matrix. Then, the IM3 matrix changes to CaZn13, which contains 6.4–15.5 at.% Mg and the same isolated MgZn2 precipitates. After that, the morphology of the reaction layer changes gradually, exhibiting another two-phase structure consisting of the same CaZn13 matrix, but with different Mg concentration (3.8–6.4 at.%) and the Mg2Zn11 with the dendrite structure. Then the Mg2Zn11 diffusion layer appears as a continuous layer that changes to the end member Zn. In order to calculate the interdiffusion coefficient, determination of the volume fraction of phases in the diffusion couple is needed. The volume fraction is considerably higher for the CaZn13 matrix with MgZn2 precipitates than for CaZn13 with Mg2Zn11 precipitates and IM3 with MgZn2 precipitates, as illustrated in figure (a). Furthermore, SEM/EDS elemental mapping was carried out to study the morphology of this diffusion couple as shown in figure . The results are consistent with the phase identification by EPMA. A schematic representation of the possible morphologies when a pure element is coupled with a three-phase alloy is depicted in figure (c).
Solid-liquid diffusion couples
The morphology of the diffusion zone evolves in solid–liquid diffusion couples is different from those in solid–solid diffusion couples. For instance, in the solid–liquid DC7, CaZn13 phase is the dominant product during interdiffusion, as illustrated by the microstructure in figure (a). Instead of forming a tooth like morphology or a matrix phase with isolated/dendritic precipitates, uniform layers are observed in this diffusion couple.
Key alloys
Phase boundaries of the Mg2Ca compound and phase relations among Mg2Ca, IM1 and Mg solid solutions
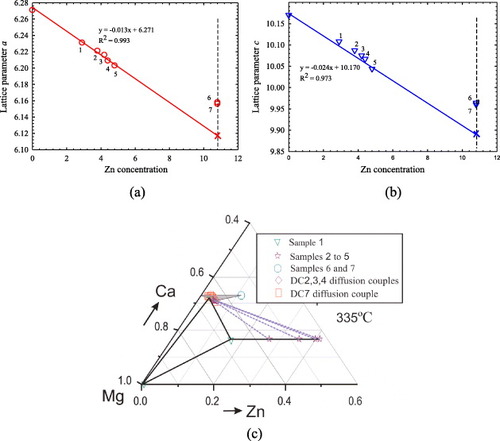
To study the phase boundaries of the Mg2Ca compound and the phase relations among Mg2Ca, IM1 and Mg solid solutions, seven ternary key samples (1 to 7) were prepared, as illustrated in figure (c). The compositions and identified phases of these samples are summarized in table . The actual chemical compositions of these alloys were measured by ICP and the composition of Mg2Ca was verified by EPMA/WDS. The phase relations obtained from EPMA are consistent with the XRD results. BSE image of sample 7 annealed at 335 °C is shown in figure (a). The equilibrium microstructure consists of three phases: Mg2Ca, CaZn and CaZn2. The Mg2Ca phase forms a substitutional solid solution where Zn substitutes for Mg atoms while the Ca content remains constant at 33.3 at.%, and the solid solubility limit of Zn was determined by EPMA to be 10.8 at.%. In order to verify the EPMA findings, this sample was studied by XRD using Rietveld analysis. The XRD pattern is illustrated in figure (b). Full pattern refinement was carried out. The use of Si as an internal calibration standard enabled the correction of the zero shift and specimen displacement, which are the most serious systematic errors in XRD patterns. However, the EPMA and XRD results obtained from samples 1 to 5 clearly show that the Mg2Ca phase has a complex solid solution, where Zn atoms substitute for both Ca and Mg atoms. Figure and table show the cell parameter variations with Zn concentration for samples 1 to 5, where the substitution of Ca and Mg by Zn decreases the unit cell parameters a and c and the lattice volume. Table lists the refined structural parameters for Mg2Ca and the reliability factors. The least-squares approximation is used to establish the relation between the lattice parameters and Zn concentration. The cell parameters a and c extrapolated to 10.8 at.% Zn concentration were used to compare the results obtained from samples 6 and 7, as can be seen in figures (a) and (b). These figures reveal that extrapolation of the data for samples 1–5 to 10.8 at.% Zn yields smaller Mg2Ca lattice parameters than those of samples 6 and 7. Such behavior can be understood from the atomic sizes. The metallic radii of Ca, Mg and Zn are 180, 150 and 130 pm, respectively [Citation30]. Hence, the unit cell parameters in the case when Zn substitutes for both Mg and Ca atoms should be smaller than those when Zn substitutes for only Mg atoms. The experimental results for the solid solubility of the Mg2Ca compound at 335 °C were confirmed by both EPMA and XRD techniques proving the existence of a complex solid solution. The homogeneity ranges and phase relations among the Mg2Ca, Mg and IM1 phases have been collected and analyzed, as demonstrated in figure (c).
Figure 8 Sample 7 annealed at 335 °C for 4 weeks: (a) SEM BSE image; (b) Rietveld analysis.
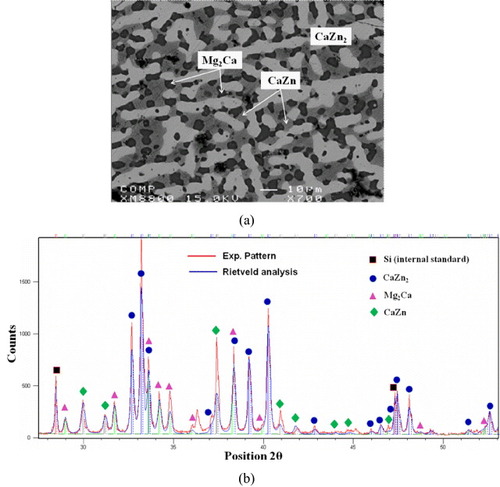
Figure 9 Variation of unit cell parameters (a) a and (b) c with Zn concentration in the Mg2Ca compound. Substitution of Ca and Mg by Zn decreases both a and c. (c) Phase boundaries of Mg2Ca and the phase relations among Mg2Ca, IM1 and Mg solid solutions.
Chemical compositions of the key samples and the phases present.
The chemical compositions and unit cell parameters of Mg2Ca determined by EPMA and Rietveld analysis.
Homogeneity range of IM4 and phase relations between IM3 and IM4
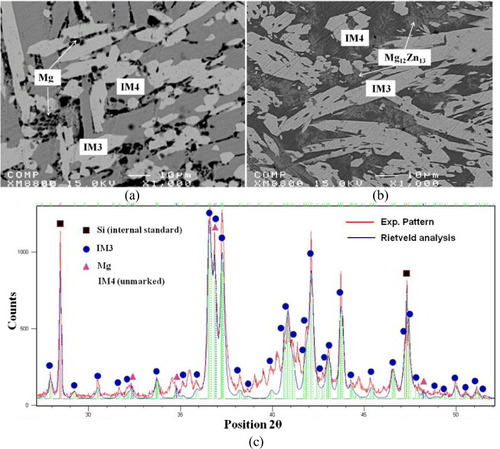
Key samples 8 and 9 have been prepared to determine the homogeneity range of IM4 and the phase relations between IM3 and IM4. BSE images of these samples annealed at 335 °C are shown in figures (a) and (b). The equilibrium microstructure of sample 8 consists of three phases: Mg, IM3 and IM4, and sample 9 contains IM3, Mg12Zn13 and IM4. Although the Ca concentration is only 1.5 at.%, this is a binary compound with extended solubility because there is no Mg–Zn binary compound with about 45 at.% Zn in the Mg–Zn binary system. Hence, IM4 is a new ternary stoichiometric compound with a Ca1.5Mg55.3Zn43.2 composition. A similar compound was reported in the Ce–Mg–Zn system by Kevorkov and Pekguleryuz [Citation32]. The XRD pattern of sample 8 is shown in figure (c), where the XRD pattern of IM4 ternary phase is not marked. A crystallographic study of this sample by TEM is still underway.
Figure 10 (a) BSE image of sample 8; (b) BSE image of sample 9; (c) Rietveld analysis for sample 8.
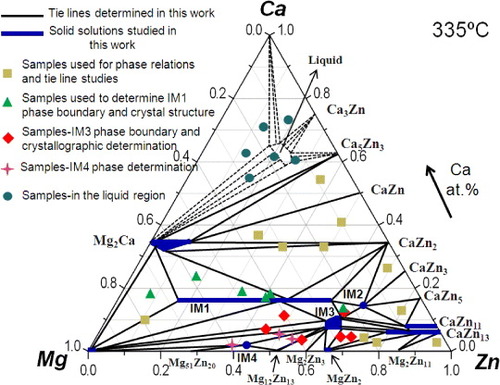
Combining the results obtained from nine diffusion couples and 32 key alloys, the isothermal section of the Ca–Mg–Zn phase diagram at 335 °C was constructed and is presented in figure . The experimental data can be used for CALPHAD modeling and re-optimization of this system.
Figure 11 Isothermal section phase diagram of Mg–Zn–Ca system constructed from nine diffusion couples and 32 key samples annealed at 335 °C.
Conclusion
A combination of the high-throughput diffusion couple technique and selected equilibrated key alloys was used to construct the Ca–Mg–Zn isothermal section at 335 °C. Phase relations, solubility limits and crystallographic information have been determined for binary and ternary compounds using SEM, EPMA, EBSD and XRD techniques. Four ternary compounds were found in this system, and the composition and homogeneity ranges of IM1 and IM3 compounds were determined. IM2 and IM4 are new stoichiometric compounds. CaZn11, CaZn13 and Mg2Ca were found to have extended solid solubility into ternary system. A mechanism explaining the evolution of the different morphologies in the diffusion couples was proposed. Depending on the different terminal compositions of the diffusion couples, the morphology can evolve as tooth like structures, a matrix phase with either isolated or dendritic precipitates and a uniform layer.
Acknowledgments
Financial support from General Motors of Canada Ltd and NSERC through the CRD grant program is gratefully acknowledged. The authors thank Ming Wei and Alain Tessier from the Chemistry Department of Concordia University for their help in conducting the ICP-MS measurements. The authors thank Pierre Hovington from Hydro-Quebec research center for his help in sample preparation for EBSD analysis.
References
- AljarrahMMedrajMWangXEssadiqiEDénèsGMuntasarA 2007 J. Alloys Compd. 438 131 http://dx.doi.org/10.1016/j.jallcom.2006.07.034
- BeffortOHausmannCh 2000 Magnesium Alloys and their Applications B LMordike K UKainer FrankfurtWerkstoff-Informationsgesellschaft mbH p 215
- LuoA A 2004 Int. Mater. Rev. 49 13 http://dx.doi.org/10.1179/095066004225010497
- NieFMuddleB C 1997 Scr. Mater. 37 1475 http://dx.doi.org/10.1016/S1359-6462(97)00294-7
- ZbergBUggowitzerP JLöfflerJ F 2009 Nat. Mater. 8 887 http://dx.doi.org/10.1038/nmat2542
- ZbergBArataaE RUggowitzeraP JLöfflerJ F 2009 Acta Mater. 57 3223 http://dx.doi.org/10.1016/j.actamat.2009.03.028
- ParisR 1934 Ternary Alloys Ministère de L'AirPublications Scientifiques et Techniques du Ministère de L'Air no 45 p 1
- ClarkJ B 1961 Trans. AIME 221 644
- ClarkJ B 1961 JCPDS Card 12-0266
- ClarkJ B 1961 JCPDS Card 12-0569
- LarinovaT VParkW WYouB S 2001 Scr. Mater. 45 7 http://dx.doi.org/10.1016/S1359-6462(01)00982-4
- JardimP MSolorzanoGSandeJ B V 2002 Microsc. Microanal. 8 487 http://dx.doi.org/10.1017/S1431927602010413
- JardimP MSolorzanoGSandeJ B V 2004 Mater. Sci. Eng. A 381 196 http://dx.doi.org/10.1016/j.msea.2004.04.043
- Oh-ishiKWatanabeRMendisaC LHonoK 2009 Mater. Sci. Eng. A 526 177 http://dx.doi.org/10.1016/j.msea.2009.07.027
- ZhangY NKevorkovDLiJEssadiqiEMedrajM 2010 Intermetallics 18 2404 http://dx.doi.org/10.1016/j.intermet.2010.08.033
- BrubakerC OLiuZ K 2004 J. Alloys Compd. 370 114 http://dx.doi.org/10.1016/j.jallcom.2003.08.097
- Wasiur-RahmanSMedrajM 2009 Intermetallics 17 847 http://dx.doi.org/10.1016/j.intermet.2009.03.014
- KirkaldyJ SBrownL C 1963 Can. Metall. Q. 2 90
- ClarkJ B 1963 Trans. Metall. Soc. AIME 227 1250
- KodentsovA ABastinG Fvan LooF J J 2001 J. Alloys Compd. 320 207 http://dx.doi.org/10.1016/S0925-8388(00)01487-0
- ZhaoJ C 2001 Adv. Eng. Mater. 3 143 http://dx.doi.org/10.1002/(ISSN)1527-2648
- ZhaoJ C 2001 J. Mater. Res. 16 1565 http://dx.doi.org/10.1557/JMR.2001.0218
- ZhaoJ CJacksonM RPelusoL A 2003 Acta Mater. 51 6395 http://dx.doi.org/10.1016/j.actamat.2003.08.007
- XuHDuYZhouYJinZ P 2006 Rare Met. 25 427 http://dx.doi.org/10.1016/S1001-0521(06)60079-X
- VillarsPCenzualK 2009 Pearson's Crystal Data—Crystal Structure Database for Inorganic Compounds Materials Park, OHASM International (on CD-ROM)
- SchwartzA JKumarMAdamsB L 2000 Electron Backscatter Diffraction in Materials Science DordrechtKluwer
- ParkJ JWymanL L 1957 WADC Technical Report 57-504, Astia Document No. AD142110 p 1
- van LooF J JRieckG D 1973 Acta Metall. 21 61 http://dx.doi.org/10.1016/0001-6160(73)90220-4
- van LooF J JRieckG D 1973 Acta Metall. 21 73 http://dx.doi.org/10.1016/0001-6160(73)90221-6
- CallisterW D 2003 Materials Science and Engineering: An Introduction New YorkWiley
- LatrocheMKalisvaartPNottenP H L 2006 J. Solid State Chem. 179 3024 http://dx.doi.org/10.1016/j.jssc.2006.05.032
- KevorkovDPekguleryuzM 2009 J. Alloys Compd. 478 427 http://dx.doi.org/10.1016/j.jallcom.2008.11.119