Abstract
Multilayers of gold nanoclusters (GNCs) coated with a thin Pd layer were constructed using GNCs modified with self-assembled monolayers (SAMs) of mercaptoundecanoic acid and a polyallylamine hydrochloride (PAH) multilayer assembly, which has been reported to act as a three-dimensional electrode. SAMs were removed from GNCs by electrochemical anodic decomposition and then a small amount of Pd was electrochemically deposited on the GNCs. The kinetics of the oxygen reduction reaction (ORR) on the Pd modified GNC/PAH multilayer assembly was studied using a rotating disk electrode, and a significant increase in the ORR rate was observed after Pd deposition. Electrocatalytic activities in alkaline and acidic solutions were compared both for the GNC multilayer electrode and Pd modified GNC electrode.
Introduction
Improvement of the rate of electrochemical reduction of oxygen is essential for the realization of highly efficient fuel cells, because the overpotential for oxygen reduction is relatively large compared with that for hydrogen oxidation, even for noble metals such as Pt. The associated reactions are rather complex [Citation1, Citation2], and have been studied on examples of well-defined surfaces, including single crystals of Au [Citation3], Ru [Citation4] and Pt [Citation5, Citation6].
Many researchers have been developing efficient electrocatalysts for the oxygen reduction reaction (ORR) and one of the most promising approaches is to design a bimetallic electrocatalyst [Citation7–17]. Watanabe and Motoo proposed the concept of adatom [Citation7, Citation8]. Electrochemical deposition of various noble metals such as Ru, Rh and Pd on Pt was carried out to obtain a highly active electrode [Citation9–15].
Pd is one of the most important metals for many electrocatalytic applications. Electrochemical properties of Pd submonolayer on a foreign metal electrode are quite different from those of the bulk Pd electrode. Formation and reduction of Pd oxide from the Pd submonolayer on Au(111) and Au(100) surfaces take place at more and less positive potentials, respectively, than those of the bulk Pd and Pd multilayers on Au(111) and Au(100) surfaces and the electrocatalytic activity of formaldehyde oxidation is highest when the Pd coverage is less than a monolayer [Citation16]. The electrocatalytic oxygen reduction has also been investigated at Au(111) [Citation12] and Pt(111) [Citation13, Citation14] electrodes modified with thin Pd layers. Electrocatalytic activity for the ORR strongly depends on the Pd layer thickness, and higher reduction rates were observed for the electrodes with lower amounts of deposited Pd. To clarify the origin of the unique electrocatalytic properties of a thin Pd layer on a gold single crystal surface, the interfacial geometric and electronic structures of the Pd thin film/Au single crystal electrode were studied by surface x-ray scattering (SXS) [Citation17,Citation18] and second harmonic generation (SHG) spectroscopy [Citation19], respectively. Although Pd forms pseudomorphic layers on Au(111) for a few layers [Citation17] and on Au(100) for over 20 layers [Citation18], the unique electrochemical characteristics were observed only for the gold electrodes covered with a submonolayer of Pd. This observation suggests the importance of electronic effect that was further confirmed by SHG measurements [Citation19]. Thus, the construction of an electrode of high surface area based on the concept of submonolayer modification by Pd is an interesting approach to develop a highly active electrocatalyst for the ORR.
We have already reported the construction of a multilayer of self-assembled monolayer (SAM) protected gold nanoclusters (GNCs) and polyelectrolyte using electrostatic interaction on gold and indium tin oxide (ITO) surfaces, which acted as three-dimensional electrodes [Citation20–25]. In this study, a three-dimensional electrocatalytic electrode was constructed by careful removal of the SAM by anodic oxidation, followed by the deposition of a small amount of Pd on the surface of GNCs in the multilayer assembly. The kinetics of ORR at this electrode was studied using a rotating disk electrode (RDE). The ORR rate at the GNC multilayer electrode was increased significantly by the Pd modification. Electrocatalytic activities of the GNC and Pd modified GNC multilayer electrodes in alkaline and acidic solutions were examined.
Experimental
Materials
Hydrogen tetrachloaurate (HAuCl4, 99.99%), sodium tetrahydroborate (NaBH4), ethanol (superpure grade), toluene (spectroscopy grade), hexanethiol (C6SH, superpure grade) and sulfuric acid (ultrapure grade) were purchased from Wako Pure Chemicals. Tetra-n-octyl ammonium bromide was obtained from Tokyo Kasei Kogyo, and 11-mercaptoundecanoic acid (MUA, 97%) and polyallylamine hydrochloride (PAH) were supplied by Aldrich. Ferrocenyl alkanethiol (FcC8SH) was synthesized by a previously reported method [Citation26]. Ultrapure water was produced with a Milli-Q water purification system (Millipore), and ultrapure Ar (99.999%) and O2 (99.5%) gases were purchased from Air Water.
Synthesis of SAM protected GNCs
GNCs covered by C6SH, FcC8SH and MUA SAMs (MHF-GNCs) were prepared by the procedure reported previously [Citation20–25]: C6SH SAM protected GNCs were synthesized by the two-phase method of Brust et al [Citation27]. Then, FcC8SH and MUA were introduced sequentially onto the surface of the C6SH SAM protected GNCs by the place exchange method [Citation28]. Here, FcC8SH was used as a probe to estimate the amount of GNC in the multilayer during the oxidative removal of SAM by measuring the redox charge of the ferrocene group, and MUA acted as a binder based on the carboxylate/PAH/carboxylate electrostatic interaction. The molar ratio of C6SH:FcC8SH:MUA on the MHF-GNCs surface was estimated by 1H-NMR (Hitachi, R-1900, 90 MHz) as 28:12:60. The core size of the MHF-GNCs was estimated as 1.8 nm by transmission electron microscopy (TEM)(JEOL, JEM-200FX) [Citation22, Citation23].
Electrochemical measurements
We employed a three-electrode electrochemical cell with a hanging meniscus configuration. A Pt wire and Ag/AgCl (NaCl saturated) were used as counter and reference electrode, respectively. The electrode potential was controlled by a potentiostat/function generator system (Hokuto Denko, HSV-100).
RDE measurements of the ORR were carried out using a dual potentiostat (Hokuto Denko, HR-101B) and a function generator (Hokuto Denko, HB-105). The rotation rate was varied stepwise from 500 to 4500 rpm using a speed control unit (Hokuto Denko, HR-202). ORR was carried out in 0.1 M KOH (pH=13) and 0.1 M H2SO4 (pH=1) solutions. These solutions were saturated with oxygen by passing oxygen gas through them for at least 1 h. Polarization curves were recorded between −600 and 200 mV in a 0.1 M KOH solution and between −200 and 800 mV in a 0.1 M H2SO4 solution, at a scan rate of 10 mV s−1.
All measurements were carried out at room temperature (25 °C) after the electrolyte solution was deaerated by passing Ar gas through it for at least 30 min except for the ORR study. The surface areas of Au(111) electrode and Au RDE were 0.045 and 0.265 cm2, respectively [Citation29, Citation30].
Preparation of the multilayer of SAM protected GNCs
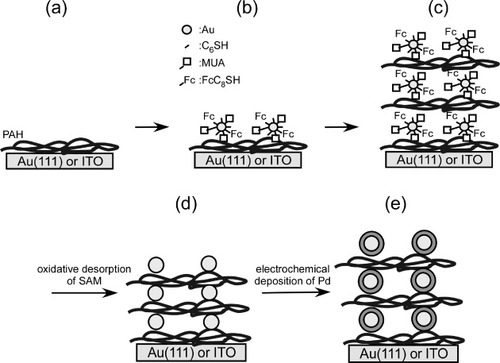
A gold single crystal bead was prepared from a gold wire (99.999%, diameter 1 mm, Tanaka Precious Metals) by Clavilier's method [Citation31]. It was cut parallel to the (111) facet, mechanically polished using 0.5 μm diamond slurry (Maruto) and annealed at 800 °C for 8 h in an electric furnace (Denken, KDF-S-70) under ultrapure N2 atmosphere. Before the preparation of SAM protected GNCs, the electrode surfaces were treated as follows. The gold single crystal was annealed in a hydrogen flame and gradually cooled in a nitrogen stream. An ITO substrate was cleaned by immersing it in a 3:1 H2SO4 (conc.)-H2O2 (30%) solution for 5 s, then thoroughly rinsed with Milli-Q water and finally dried in ultrapure nitrogen. A gold RDE was polished to a mirror finish with 3.0 μm diamond slurry (Maruto) and cleaned by rinsing with Milli-Q water. Then, oxidation reduction cycles between −200 and 1450 mV were applied in a 0.1 M H2SO4 solution at a scan rate of 200 mV s−1 for about 2 h. Multilayers of SAM protected GNCs were prepared on gold and ITO surfaces. The substrate was dipped first in a 0.1 M NaOH aqueous solution containing 2 mg mL−1 PAH for 5 min and then in an ethanol solution containing 0.15 wt% GNCs for 15 min, with a rinse after each dip. The PAH/GNC dipping cycle was repeated to obtain the PAH/GNC multilayer as shown in scheme (a)–(c) [Citation21–25].
Scheme 1 Preparation of a multilayer of SAM modified bare and Pd modified GNCs on Au and ITO electrodes. (a) PAH modification, (b) formation of the monolayer of SAM modified GNCs, (c) formation of the multilayer of SAM modified GNCs, (d) removal of the SAMs from the GNCs and (e) adsorption of Pd on the GNCs.
Removal of SAMs from and deposition of Pd on the GNC surfaces in the multilayer
SAMs were removed from GNC surfaces by electrochemical oxidative desorption repeating the potential cycles between 0 and 1300 mV in a 0.1 M HClO4 solution with a scan rate of 50 mV s−1 (Scheme (d)) [Citation24]. After each potential cycle, a CV was recorded between 0 and 800 mV to monitor the redox response of the ferrocene group and evaluate the amount of remaining SAMs on the GNC surface. The oxidative desorption of SAMs from the GNC surface was also monitored by observing the surface of the ITO electrode (1×0.5 cm) covered with the multilayer of the SAM protected GNCs/PAH in a field emission scanning electron microscope (FE-SEM, Hitachi, 5200-S) at an acceleration voltage of 25 keV.
After confirming the complete removal of SAMs, Pd was electrodeposited on the surface of the GNCs in the multilayer by stepping the potential from 850 to 200 mV in a 0.1 M H2SO4 solution containing 0.1 mM PdCl4 (Scheme (e)) [Citation24]. The deposition time was adjusted to pass the charge corresponding to the monolayer coverage of GNCs. Electrochemical measurements in Ar saturated solutions were also carried out after the oxidative desorption of SAMs and further Pd deposition.
Results and discussion
Oxidative desorption of SAMs from the multilayer of PAH/SAM protected GNCs
The solid line in figure (a) shows a CV of a 5-layer GNC electrode on a Au(111) electrode in a 0.1 M HClO4 solution (scan rate 50 mV s−1). The oxidation/reduction wave of the ferrocence group attached to the GNCs was observed at around 380 mV. The redox process of the surface attached ferrocene group can be expressed as [Citation26, Citation32, Citation33],
where −Fc and −Fc+ represent the neutral and oxidized states of the ferrocene group, respectively, −X− is an anion in solution, and −Fc+X− is an ion pair between the ferricenium cation and the anion.
Figure 1 (a) Cyclic voltammograms of the 5-layer GNC electrode on the Au(111) electrode measured in an Ar saturated 0.1 M HClO4 solution at a scan rate of 50 mV s−1: (—) 0, (− −) 5, (····) 10, (−··−) 20, (−·−) 30 cycles between 0 and 1300 mV were applied to desorb SAM. (b) Cyclic voltammograms of oxidative desorption of SAM from 5 layers of the GNC electrode on the Au(111) electrode measured in an Ar saturated 0.1 M HClO4 solution at a sweep rate of 50 mV s−1, repeating the potential cycle between 0 and 1300 mV for 5 (− −), 10 (····), 20 (−··−), and 30 (−·−) times to desorb SAM.
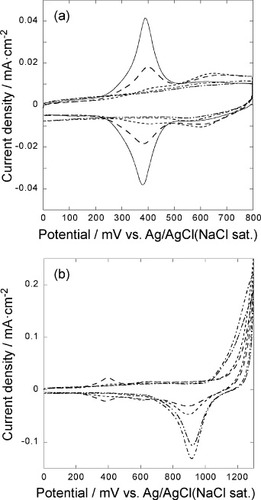
Figure (b) shows CVs of the 5-layer GNC electrode on the Au(111) electrode in a 0.1 M HClO4 solution when the potential was scanned between 0 and 1300 mV at a rate of 50 mV s−1. In the positive going scan a large anodic current was started to be observed at around 1000 mV and a small cathodic peak was observed at around 950 mV in the negative going scan. The cathodic peak should be due to the reduction of gold oxide. As the potential cycle was repeated, the anodic current started to flow from more negative potential, and the charge of the cathodic peak increased up to 25 cycles and then decreased. The wave due to the redox of the ferrocene moiety decreased as the potential cycle was repeated and disappeared after about 20 cycles. These results show that the anodic current was due to both the formation of Au oxide and anodic oxidation of the SAMs at the GNC surface, which proceeds as follows [Citation34]:
Initially, the GNC surfaces were covered with SAMs and the oxidative decomposition proceeded at positive potentials. As the potential cycle was repeated, the SAMs were gradually removed, exposing larger areas of the gold surface and thereby increasing the charge for the gold oxide reduction. After 20–25 cycles, the SAMs were totally removed and a small decrease in the charge for the gold oxide reduction was observed, suggesting a small decrease in the surface area, i.e. the aggregation of the GNCs. The decrease in the charge was gradual, revealing that the GNCs did not aggregate significantly even after the SAMs were removed.
FE-SEM was used to examine the size of the GNCs after the oxidative desorption of the SAMs. Figure shows the FE-SEM images of 5 layers of GNCs/PAH on an ITO surface after up to 15 oxidative desorption cycles in a 0.1 M HClO4 solution at a scan rate of 50 mV s−1. The 50–100 nm sized grains observed in all images originate from the ITO surface. The GNC size before the oxidative desorption was estimated as 1.8 nm by TEM, which was too small to be observed by the present FE-SEM measurements [Citation22, Citation23]. After repeating the potential cycles for oxidative desorption of the SAMs, the GNCs became visible in the FE-SEM images because of the aggregation of GNCs. The average diameters of the GNC clusters reached about 5 nm after 7 cycles (figure (d)) and did not change upon further potential cycles.
Figure 2 FE-SEM images of (a) ITO, (b) ITO coated with PAH, 5 layers of PAH/GNCs on ITO substrates after (c) 0, (d) 1, (e) 2, (f) 3, (g) 4, and (h) 14 oxidative desorption cycles in a 0.1 M HClO4 solution applied at a scan rate of 50 mV s−1.
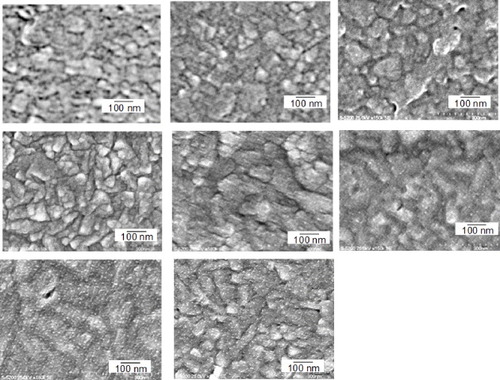
GNCs in the close vicinity were aggregated because the electrostatic interaction between PAH, i.e. cationic polymer, and GNCs with MUA, i.e. anionic moiety, was lost after oxidative desorption of SAMs. However, the aggregation stopped when the size of GNCs became about 5 nm. This suggests that the energy gain due to the further aggregation was smaller than the energy barrier for the GNCs to be close enough for further growth because GNCs were surrounded by PAH even after MUA was removed.
Electrochemical deposition of Pd on the surface of bare GNCs within the multilayer
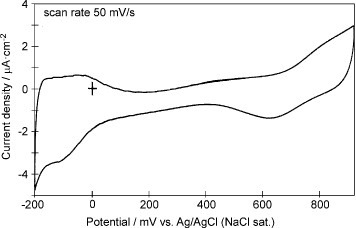
After SAM molecules were oxidatively desorbed from the GNC surfaces, Pd was electrodeposited on the GNCs by stepping the potential from 850 to 200 mV in a 0.1 M H2SO4 solution containing 0.1 mM PdCl4. Figure shows the CV of the 5-layer GNC electrode measured in a 0.1 M H2SO4 solution after Pd depositionFootnote6. Hydrogen adsorption and desorption peaks, which were absent before Pd deposition, are observed between −200 and 0 mV, and surface oxide formation and reduction take place at a much more positive potential than before Pd deposition. The amount of Pd deposited on the GNC surface can be estimated from the charge corresponding to the hydrogen adsorption and desorption peaks that was 50 μC cm−2. The charge for the oxide reduction of the 5-layer GNC electrode after 30 oxidative desorption cycles, i.e. bare GNCs, was about 400 μC cm−2 (figure (b)). Thus, the Pd coverage on the GNCs within the multilayer was estimated to be 25% because hydrogen adsorption/desorption and oxide reduction are 1 and 2 electron processes, respectively. The discrepancy between the values corresponding to Pd deposition (monolayer equivalent) and hydrogen adsorption/desorption may be due to the high double layer charging current at the multilayer modified electrode.
Figure 3 Cyclic voltammogram of the 5-layer Pd modified GNC electrode in a 0.1 M H2SO4 solution measured at a scan rate of 50 mV s−1.
Catalytic activity of the multilayer of bare and Pd modified GNC electrodes in alkaline solution
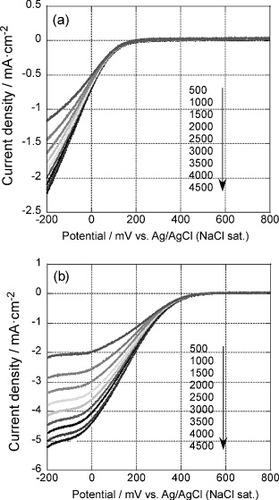
Figure shows the polarization curves of the 5-layer GNC electrode deposited on a RDE after 35 oxidative desorption cycles. The curves were measured before (figure (a)) and after (figure (b)) Pd deposition, in an oxygen saturated 0.1 M KOH solution, at a scan rate of 10 mV s−1 and a rotation rate between 500 and 4500 rpm as indicated in the figure. Before Pd deposition, cathodic current started to be observed at around −50 mV. It increased as the electrode potential became more negative and then limiting current was observed. The potential where cathodic current started to flow was more positive than the values for Au(111) or carbon-supported Au nanoparticles in alkaline solution by about 30 mV [Citation35]. These results show that the ORR activity was higher at the GNC multilayer electrode.
Figure 4 Rotation rate dependent polarization curves of the 5-layer GNC electrode after 35 oxidative desorption cycles (a) before and (b) after Pd deposition. The curves were measured in an oxygen saturated 0.1 M KOH solution at a scan rate of 10 mV s−1.
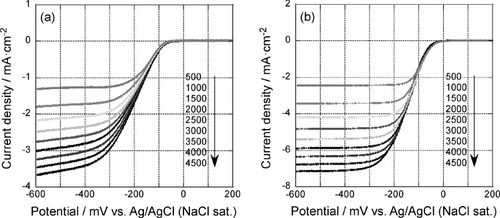
At the Pd modified GNC electrode, cathodic current became observable at around 50 mV. It increased as the potential was scanned to negative direction and reached limiting current at around −300 mV. Although the onset potential was shifted by only about 100 mV after Pd deposition, the limiting current at a given rotation rate of the Pd modified GNC electrode was about twice of that of the bare GNC electrode.
The relationship between the diffusion limited current density and rotation rate is given by the Levich equation as
Here, iL is the diffusion limited current, n is the number of electrons transferred in the overall reaction process, F is the Faraday constant (96490 C mol−1), v is the kinematic viscosity (0.01 cm2 s−1) [Citation36], D is the diffusion coefficient of oxygen molecules, CO2∗ is the bulk concentration of oxygen (0.1 M KOH: 1.2×10⁻⁶ mol cm−3, 0.1 M H2SO4: 1.1×10⁻⁶ mol cm−3) [Citation37, Citation38] and ω is the rotation rate. The plot of iLversus ω1/2 is expected to yield a straight line and the number of electrons can be determined from the slope.
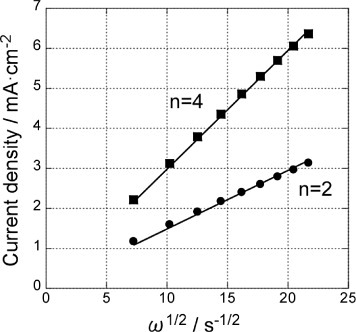
Figure shows the Levich plots for the GNC multilayer electrode before and after Pd deposition using the data at −600 mV of figure . Linear relations are obtained in both cases with the slopes corresponding to the 2- and 4-electron ORR processes described below for the former and the latter, respectively [Citation39]:
Thus, a submonolayer amount of Pd on GNCs significantly enhanced the ORR activity, and the activity of the present Pd modified GNC electrode was superior to those of Pd(111) and carbon-supported Pd nanoparticles [Citation35, Citation40, Citation41].
Figure 5 Levich plots for the GNC multilayer electrode at −600 mV before (▪) and after () Pd deposition (figure ). Solid lines are fit for 2-electron and 4-electron processes.
For a more quantitative analysis, one needs to obtain the potential dependent rate constant of the ORR. The current–potential relations can be analyzed with the following Koutecky–Levich (K–L) equation:
where ik is the current in the absence of any mass transfer, which is given by
Therefore, a plot of 1/i versus 1/ω1/2 should be linear and can be extrapolated to 1/ω1/2=0 to yield 1/ik. Then, the rate constant, k, can be obtained from equation (9). Figure shows the K–L plots for the 5-layer GNC electrode (a) before and (b) after Pd deposition based on the data shown in figure . The slopes of the K–L plots of the former and the latter agree with those expected for the 2-electron and 4-electron reduction processes, respectively. The kinetic current, ik, which is related to the reaction rate constant k, can be obtained from the intercept of the K–L plots for various potentials.
Figure 6 Koutecky–Levich plots for the polarization curves (figure ) of the 5-layer GNC electrode (a) before and (b) after Pd deposition.
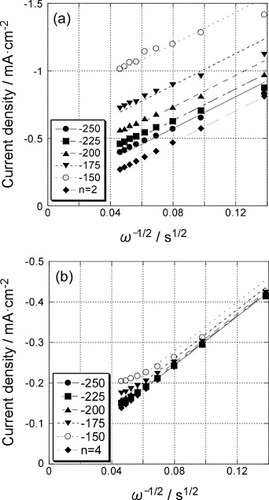
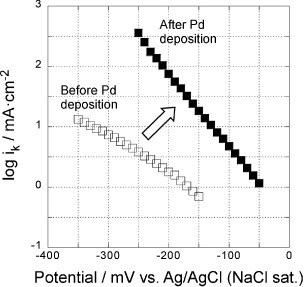
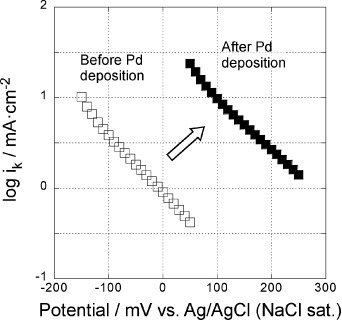
Figure shows the mass transfer corrected Tafel plots, i.e. log ik versus potential, of the 5-layer GNC electrodes before (open symbols) and after (solid symbols) Pd deposition in a 0.1 M KOH solution. The Tafel slopes decreased from 150–170 mV decade−1 before Pd deposition to about 80 mV after deposition, reflecting the change in the ORR mechanism from 2-electron to 4-electron process, even though the Pd coverage was only about half a monolayer.
Figure 7 Potential dependence of reaction rate constants of the 5-layer GNC electrode, measured in a 0.1 M KOH solution before (open symbols) and after Pd deposition (solid symbols).
Catalytic activity of the multilayer of bare and Pd modified GNC electrodes in acidic solution
Figure shows the polarization curves of the 5-layer GNC electrode deposited on a RDE. The curves were measured after 35 oxidative desorption cycles, before (figure (a)) and after (figure (b)) Pd deposition, in an oxygen saturated 0.1 M H2SO4 solution, at a scan rate of 10 mV s−1 and rotation rate between 500 and 4500 rpm as indicated in the figures. Before Pd deposition, cathodic current started to be observed at around 250 mV and increased as the electrode potential became more negative. Limiting currents were, however, not observed in this solution as current due to hydrogen evolution started to flow. This result agrees with the previous reports that the Au electrode has low electrocatalytic activity for the ORR in acidic solutions [Citation42–46].
Figure 8 Rotation rate dependent polarization curves of the 5-layer GNC electrode measured after 35 oxidative desorption cycles in an oxygen saturated 0.1 M H2SO4 solution at a scan rate of 10 mV s−1, (a) before and (b) after Pd deposition.
After Pd deposition, cathodic current started to be observed at around 550 mV and saturation was observed when the electrode potential became more negative than about −50 mV. The enhancement effect of Pd was more significant in a 0.1 M H2SO4 solution as the onset potential for the ORR shifted positively by about 300 mV in a 0.1 M H2SO4 solution, whereas the shift was only about 100 mV in a 0.1 M KOH solution.
Figure shows the Levich plot for the GNC multilayer electrode after Pd deposition using the data at −100 mV of figure (b). A linear relation corresponding to the 4-electron ORR process was obtained. The Levich plot cannot be shown for the electrode before Pd deposition because no limiting currents were observed.
Figure 9 Levich plot for the GNC multilayer electrode at −100 mV after Pd deposition (figure (b)). Solid line is a fit by a 4-electron process.
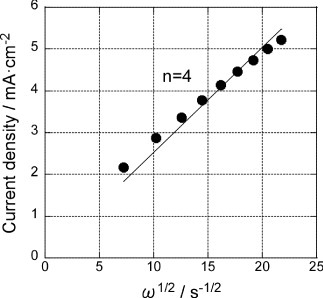
Figure shows the K–L plots for the 5-layer GNC electrode (a) before and (b) after Pd deposition using the data at various potentials of figure . The slopes of the K–L plots of the former and the latter agreed with those expected for the 2-electron and 4-electron reduction processes, respectively. Thus, although the Levich plot could not be obtained for the GNC electrode before Pd deposition, the K–L plots confirmed that the ORR in a 0.1 M H2SO4 solution proceeded via 2-electron and 4-electron processes at the GNC electrode before and after Pd deposition, respectively.
Figure 10 Koutecky–Levich plots for the polarization curves (figure ) of the 5-layer GNC electrode (a) before and (b) after Pd deposition.
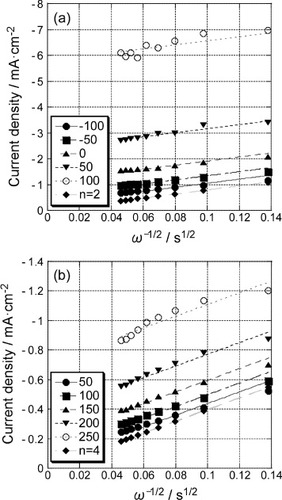
Figure shows the mass transfer corrected Tafel plots (log ik versus potential) for the 5-layer GNC electrodes before (open symbols) and after (solid symbols) Pd deposition in a 0.1 M H2SO4 solution. Although the electrocatalytic activity was enhanced significantly by Pd deposition, the Tafel slope in a 0.1 M H2SO4 solution was not affected much. This behavior is different from that in a 0.1 M KOH solution. The slope at the Pd modified GNC multilayer electrode was larger than that at Pd metal electrode in the same solution. This may be related to the ionization of PAH. Since PAH is a polyelectrolyte of weak base with pKa of 9–11 [Citation47], the PAH chains are fully ionized by a positive charge in a 0.1 M H2SO4 solution, and H+, which is one of the reactants for the ORR in acidic solutions, is essentially rejected by PAH. Thus, the distribution of H+ near the Pd modified GNC in the multilayer should be quite different from that near the Pd metal electrode in a H2SO4 solution, resulting in a relatively large Tafel slope.
Figure 11 Potential dependence of reaction rate constants of the 5-layer GNC electrode measured in a 0.1 M H2SO4 solution before (open symbols) and after (solid symbols) Pd deposition.
Conclusions
Electrocatalytic activities for ORR at bare and Pd modified GNC multilayer electrodes in alkaline and acidic solutions were investigated using RDE. After the multilayer of GNCs modified with MUA SAM and PAH was constructed, the SAMs were oxidatively removed from the GNC surface by cycling potential between 0 and 1300 mV and the multilayer of bare GNC with a diameter of about 5 nm and PAH was obtained. Relatively high catalytic activity for the ORR was observed at the bare GNC/PAH multilayer electrode in an alkaline solution. Electrochemical deposition of Pd submonolayer deposition on bare GNCs in the multilayer resulted in Pd modified GNC/PAH multilayer electrode. The Pd modification enhanced the electrocatalytic activity for the ORR in both acidic and alkaline solutions. Oxygen was reduced via 2-electron and 4-electron processes at the bare and Pd modified GNC multilayer electrodes, respectively.
Acknowledgments
This work was partially supported by a Grant-in-aid for Scientific Research (A) (No. 18205016), the Global COE program (Project No. B01: Catalysis as the Basis for Innovation in Material Science) and the World Premier International Research Center (WPI) Initiative on Materials Nanoarchitectonics from the Ministry of Education, Culture, Sports, Science and Technology (MEXT, Japan).
Notes
The CV in figure has a background originating from dissolved oxygen within the multilayer. Although the solution was deaerated by passing Ar gas for more than 30 min, dissolved oxygen remained within the multilayer.
References
- AdzicR R 1998 Frontiers in Electrochemistry vol 5 Electrocatalysis JLipkowski P NRoss New York VCH p 197
- KinoshitaK 1992 Electochemical Oxygen Technology New York Wiley
- AdzicR RStrbacSAnastasijevicN 1989 Mater. Phys. Chem. 22 349 http://dx.doi.org/10.1016/0254-0584(89)90005-9
- InoueHBrankovicS RWangJ XAdzicR R 2002 Electrochim. Acta 47 3777 http://dx.doi.org/10.1016/S0013-4686(02)00348-1
- KitaHLeiH-WGaoY 1994 J. Electroanal. Chem. 379 407 http://dx.doi.org/10.1016/0022-0728(94)87164-7
- KadiriF ElFaureRDurandR 1991 J. Electroanal. Chem. 301 177 http://dx.doi.org/10.1016/0022-0728(91)85468-5
- WatanabeMMotooS 1975 J. Electroanal. Chem. 60 259 http://dx.doi.org/10.1016/S0022-0728(75)80260-9
- WatanabeMMotooS 1975 J. Electroanal. Chem. 60 267 http://dx.doi.org/10.1016/S0022-0728(75)80261-0
- ZhangJVukmirovicM BXuYMavrikakisMAdzicR R 2005 Angew. Chem. Int. Edn Engl. 44 2132. http://dx.doi.org/10.1002/(ISSN)1521-3773
- KohSStrasserP 2007 J. Am. Chem. Soc. 129 12624 http://dx.doi.org/10.1021/ja0742784
- StamenkovicV RMunB SArenzMMayrhoferK J JLucasC AWangGRossP NMarkovicN M 2007 Nat. Mater. 6 241 http://dx.doi.org/10.1038/nmat1840
- NaoharaHYeSUosakiK 2000 Electrochim. Acta 45 3305 http://dx.doi.org/10.1016/S0013-4686(00)00440-0
- ArenzMSchmidtT JWandeltKRossP NMarkovicN M 2003 J. Phys. Chem. B 107 9813 http://dx.doi.org/10.1021/jp034789m
- ClimentVMarkovicN MRossP N 2000 J. Phys. Chem. B 104 3116 http://dx.doi.org/10.1021/jp993480t
- UeharaHOkawaYSasakiYUosakiK 2009 Chem. Lett. 38 148 http://dx.doi.org/10.1246/cl.2009.148
- NaoharaHYeSUosakiK 2001 J. Electroanal. Chem. 500 435 http://dx.doi.org/10.1016/S0022-0728(00)00390-9
- TakahasiMHayashiYMizukiJTamuraKKondoTNaoharaHUosakiK 2000 Surf. Sci. 461 213 http://dx.doi.org/10.1016/S0039-6028(00)00583-5
- TakahashiMTamuraKMizukiJKondoTUosakiK 2010 J. Phys.: Condens. Matter 22 474002 http://dx.doi.org/10.1088/0953-8984/22/47/474002
- AwataniTYagiINoguchiHUosakiK 2002 J. Electroanal. Chem. 524–525 184 http://dx.doi.org/10.1016/S0022-0728(02)00647-2
- YagiIIshidaTUosakiK 2004 Electrochem. Commun. 6 773 http://dx.doi.org/10.1016/j.elecom.2004.05.025
- UosakiKKondoTOkamuraMSongW 2002 Faraday Discuss. 121 373 http://dx.doi.org/10.1039/b200397j
- SongWOkamuraMKondoTUosakiK 2003 Phys. Chem. Chem. Phys. 5 5279 http://dx.doi.org/10.1039/b309678e
- SongWOkamuraMKondoTUosakiK 2003 J. Electroanal. Chem. 554 385 http://dx.doi.org/10.1016/S0022-0728(03)00303-6
- HaradaMZanetakisNNoguchiHTakakusagiSUosakiK 2008 Trans. Mater. Res. Soc. J. 33 1093
- SongWOkamuraMKondoTUosakiK 2008 J. Electroanal. Chem. 612 105 http://dx.doi.org/10.1016/j.jelechem.2007.09.017
- UosakiKSatoYKitaH 1991 Langmuir 7 1510 http://dx.doi.org/10.1021/la00055a038
- BrustMWaklerMBethellDSchiffrinD JWhymanR 1994 J. Chem. Soc. Chem. Commun. 801
- HostetlerM JTempletonA CMurrayR W 1999 Langmuir 15 3782 http://dx.doi.org/10.1021/la981598f
- QuayumM EYeSUosakiK 2002 J. Electroanal. Chem. 520 126 http://dx.doi.org/10.1016/S0022-0728(02)00643-5
- KondoTSumiTUosakiK 2002 J. Electroanal. Chem. 538–539 59 http://dx.doi.org/10.1016/S0022-0728(02)01000-8
- ClavilierJFaureRGuinetGDurandR 1980 J. Electroanal. Chem. 107 205 http://dx.doi.org/10.1016/S0022-0728(79)80022-4
- UosakiKSatoYKitaH 1991 Electrochim. Acta 36 1799 http://dx.doi.org/10.1016/0013-4686(91)85047-B
- ShimazuKYagiISatoYUosakiK 1992 Langmuir 8 1385 http://dx.doi.org/10.1021/la00041a023
- YeSHabaTSatoYShimazuKUosakiK 1999 Phys. Chem. Chem. Phys. 1 3653 http://dx.doi.org/10.1039/a902952d
- LimaF H BZhangJShaoM HSasakiKVukmirovicM BTicianelliE AAdzicR R 2007 J. Phys. Chem. C 111 404 http://dx.doi.org/10.1021/jp065181r
- KullapereMJurmannGTennnoT TPaprotnyJ JMirkhalafFTammeveskiK 2007 J. Electroanal. Chem. 599 183 http://dx.doi.org/10.1016/j.jelechem.2005.12.026
- GubbinsK EWalkerR D J 1965 J. Electrochem. Soc. 112 469 http://dx.doi.org/10.1149/1.2423575
- DavisR EHorvathG LTobiasC W 1967 Electrochim. Acta 12 287 http://dx.doi.org/10.1016/0013-4686(67)80007-0
- FischerPHeitbaumJ 1980 J. Electroanal. Chem. 112 231 http://dx.doi.org/10.1016/S0022-0728(80)80404-9
- SafaviAMalekiNTajabadiFFarjamiE 2007 Electrochem. Commun. 9 1963 http://dx.doi.org/10.1016/j.elecom.2007.05.006
- JiangLHsuAChuDChenR 2009 J. Electrochem. Soc. 156 B643 http://dx.doi.org/10.1149/1.3098478
- DamjanovicAGenshawM ABockrisJ O‘M 1967 J. Electroanal. Chem. 15 173 http://dx.doi.org/10.1016/0022-0728(67)85021-6
- WroblowaH SPanY CRazumneyG 1976 J. Electroanal. Chem. 69 195 http://dx.doi.org/10.1016/S0022-0728(76)80250-1
- ZurillaR WSenR KYeagerE 1978 J. Electrochem. Soc. 125 1103 http://dx.doi.org/10.1149/1.2131628
- VilambiN R KTaylorE J 1989 J. Electroanal. Chem. 270 61 http://dx.doi.org/10.1016/0022-0728(89)85028-4
- PaliteiroC 1994 Electrochim. Acta 39 1633 http://dx.doi.org/10.1016/0013-4686(94)85147-6
- MermuntOBarrettC J 2003 J. Phys. Chem. B 107 2525 http://dx.doi.org/10.1021/jp027278t