Abstract
In a multicomponent nematic liquid crystal (NLC) mixture of a liquid crystal (negative-type NLC) and a photosensitive acrylic prepolymer, photopolymerization upon UV irradiation induces the separation of the LC and photosensitive acrylic prepolymer layers, thereby leading to a vertical arrangement of LC molecules. In this study, we propose a simple vertical alignment method for LC molecules, by adding a chiral smectic A (SmA∗) liquid crystal having homeotropic texture characteristics to an NLC mixture solution. Measurements of electro-optical properties revealed that the addition of the SmA∗ LC not only strengthened the anchoring force of the copolymer alignment film surface, but also significantly enhanced the contrast ratio (∼73%), response time and grayscale switching performance of the device.
Introduction
Currently, the prevailing method of aligning liquid crystal (LC) molecules involves rubbing the film surface of organic polymers (e.g., polyimide, polyvinyl alcohol and Nylon 66) [Citation1–11]. However, several issues, if left unresolved, can result in damage to drive circuits, and thus in defective devices, leading to a decrease in production rate [Citation8]. Notable examples of such issues include dust particle pollution and electrostatic retention resulting from rubbing alignment, the difficulties in controlling rubbing strength, brush marks and other factors. These issues fuel the development of noncontact alignment technologies such as photoalignment [Citation12–20], ion-beam (or high-energy laser) alignment [Citation21, Citation22], nanoimprinting [Citation23–28], monolayer self-assembly [Citation29–36] and oblique evaporation [Citation37–39].
In our previous reports on noncontact photoinduced vertical alignment [Citation40, Citation41], we specifically highlighted the proposal of Vorflusev and Kumar from Kent State University in 1999 on multilayered phase separation composite film (PSCOF) technology [Citation42]. Their seminal work has served as the theoretical basis of the present study of multicomponent mixtures of LCs and photosensitive prepolymers. In this study, we aim to extend the possibilities of the application and fabrication of LC electrooptical devices using vertical alignment, with the additional benefit of completely eliminating polyimide preprocessing (i.e. cell processes such as coating and rubbing in the liquid crystal display industry) and increasing production yield and rate.
Several similar technologies, e.g. the use of LC/photosensitive prepolymers, have been used in the fabrication of LC devices before the introduction of the PSCOF method by Kumar et al. These technologies include photopolymerization-induced phase separation (PIPS) [Citation43–46] methods such as those using polymer-stabilized cholesteric texture (PSCT) [Citation47, Citation48], polymer-dispersed liquid crystals (PDLCs) [Citation49–58], polymer-dispersed ferroelectric liquid crystals (PDFLCs) [Citation59], polymer-dispersed chiral liquid crystals (PDCLCs) [Citation60], holographic polymer-dispersed liquid crystals (HPDLCs) [Citation61–64], homeotropic reverse-mode polymer liquid crystals (HRPLCs) [Citation65], polymer-liquid crystals (PoLiCryst's) [Citation66], cholesteric LC-polymer dispersion [Citation67] and cholesteric LC-polymer gel dispersion [Citation68]. The morphology of polymers can vary widely with different process parameters, e.g. photosensitive prepolymer structure, the mixing ratio between LCs and photosensitive prepolymers, cell thickness, temperature and the duration and intensity of UV irradiation. The marked variations in polymer morphology led to differences in the operation mode, drive circuit design, and applications of LC devices [Citation69–77].
In 2000, Kumar and co-workers [Citation75] reviewed relevant theories and experimental results to outline how a phase separation can be induced in a mixture of an LC and a photosensitive prepolymer after UV irradiation, and highlighted the strong dependence of polymer morphology on polymerization rate. In 2005, by following the theoretical framework previously established, Kumar et al. further varied process parameters, such as UV irradiation intensity, environment temperature and cell thickness and empirically demonstrated the effective control of these parameters to obtain polymer (PSCOF or PDLC) films with different morphologies [Citation77]. Thus, in our previous studies [Citation40, Citation41], by building on the works of Kumar et al., we demonstrated the fabrication of vertical alignment copolymer film (VACOF) LC devices with double vertical-alignment-mode layers.
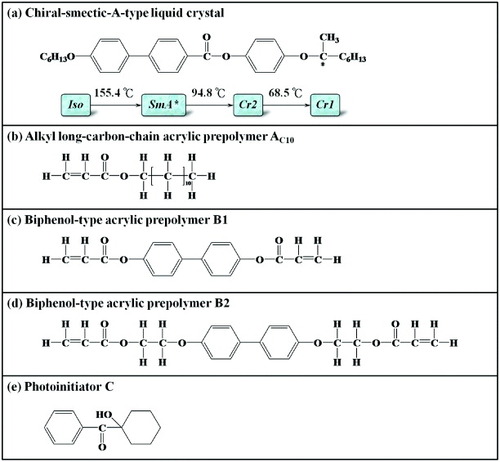
In this study, we synthesized a chiral smectic A (SmA∗) LC [Citation78] with the chemical structure shown in figure (a). The SmA∗ LC exhibits an electroclinic effect [Citation2, Citation79–82]; in other words, in the presence of an electrical field (E), LC molecules follow the direction of E and tilt from their original orientation. This is a particularly profound manifestation of spontaneous polarization. Under the application of an external electrical field, the spontaneous polarization of a material will lead to an alignment with the electrical field. In recent years, spontaneous polarization has attracted attention owing to its potential for creating a switch between bright and dark states. Besides the excellent, stable chemical structure, the electroclinic effect of the SmA∗ LC offers the additional benefit of a faster response than the ferroelectric LC and the grayscale adjustment capability [Citation82]. The rapid tilt angle conversion also enables a wide range of applications in display technology [Citation83]. In addition, after fabricating SmA∗ LC and using it to fill an LC cell with no polymer alignment film, we observed a complete vertical alignment of LC molecules (homeotropic texture) under crossed polarizers [Citation78]. Thus, in this study, to exploit the aforementioned phenomenon and experimental results, we added an SmA∗ LC compound to a mixture of a negative-type nematic LC (NLC) and a photosensitive acrylic prepolymer (presented in our previous study) to achieve the auxiliary vertical alignment of LC molecules in the original system (NLC mixture). From our previous results, we found that mixing the SmA∗ LC compound and altering the main-chain-type biphenol acrylic prepolymer structure of the VACOF would not only enhance the surface anchoring force of the VACOF or improve the contrast ratio of the LC device, but also improve the electrooptical characteristics, such as the grayscale performance and response time, of the device.
Figure 1 Chemical structures of compounds used in this work. Phase transitions and corresponding temperatures are given at the bottom of panel (a).
Experiments
Material composition and description of multicomponent LC mixtures
We used the chiral SmA∗ LC that we synthesized previously to supplement an NLC mixture with a noncontact-mode photoinduced vertical alignment (vertical-alignment-mode) effect. Figure (a) shows the chemical structure and phase-transition temperatures of the SmA∗ LC compound. Its core consists of a biphenyl ring connected to a single benzene ring by an ester group (–COO–); the core is linked to chiral centers via oxygen bridges (–O–), which stabilize the molecule. To further improve the stability of the SmA∗ LC, we designed a terminal soft segment (with 6 carbon atoms in the alkoxy group) and a chiral soft segment (with 6 carbons in the alkyl group) with appropriate lengths. From the results of the structural design, x-ray diffraction (XRD) and thermal analyses (differential scanning calorimetry, DSC) of the LC molecules, we deduced that the novel SmA∗ LC encompasses a broad temperature range (∼60 °C) and possesses a large electrical-field-induced molecular tilt angle (∼10 °), a short switching time (9–15 μs) and grayscale adjustment capability [Citation78].
The prime motivation for altering the main chain structure of the VACOF was our prior discovery that the density of the cross-linking grid formed on the VACOF surface significantly affects contrast ratio [Citation41]. After the incorporation of photosensitive acrylic prepolymers with longer molecular structures into the main chain, the LC molecules of the LC device would, under the influence of an electric field, collectively rotate in the direction of the electric field, thereby leading to an increase in transmittance and an increase in contrast ratio. Adding the SmA∗ LC compound to the NLC mixture (NLC-SmA∗/photosensitive acrylic prepolymer mixture or NSLC mixture for short) meant that, besides the desirable SmA∗ LC characteristics, LC molecules would vertically align on the surface of an indium-tin oxide (ITO) substrate when the SmA∗ LC compound fills an empty cell without a polymer film alignment layer (cell thickness 4 μm), thereby giving rise to a uniformly dark state under crossed polarizers [Citation78]. Thus, the objective of our experiment was to improve the electrooptical properties of the NLC mixture by adding a trace amount of SmA∗ LC to it. The chemical structures of the photosensitive acrylic prepolymer and photoinitiator used for the multicomponent LC mixture are shown in figures (b)–(e).
Preparation of NSLC mixtures
As detailed in [Citation40] and [Citation41], we mixed the alkyl long-carbon-chain acrylic prepolymer AC10, the biphenol acrylic prepolymer B1 or B2, the photoinitiator C, and an NLC to obtain materials impacts with two different main chain structures, denoted as NLC/B1 and NLC/B2. We used organic polymers with a side chain structure similar to that of polyimide to simulate the traditional rubbing process typically involved in the fabrication, and the long carbon alkyl side chain of AC10 (alkyl carbon number 10, dodecyl prop-2-enoate, SeaEn Special Material Co) was supposed to affect the vertical alignment of LC molecules. The photoinitiator C (1-hydroxy-cyclohexyl-phenyl ketone, Ciba Specialty Chemicals Co) starts the free-radical polymerization during the UV irradiation. The prepolymers B1 (4,4′-bisacry-loylbiphenyl) and B2 (4,4′-bis[4-(acryloyxy)hexyloxy]biphenyl) were purchased from SeaEn Special Material Co The NLC (Merck) had the following parameters: Δε=−4.1, Δn=0.0899, η1=0.21 kg m2 s and Keff=18.1 pN.
We previously achieved the best electrooptical properties and the highest contrast ratio in LC devices with an alkyl carbon number of 10 for the acrylic prepolymer A and the main chain structure of B2 [Citation41]. In this work, we altered the main chain structure by changing B2 to B1 and added an SmA∗ LC with homeotropic texture characteristics to produce the NSLC system. The main component of the mixture was the NLC, and the mixing ratios are listed in table .
Compositions of LC mixtures.
The mixing ratio of the SmA∗ LC compound was equivalent to the total mixing ratios of the acrylic prepolymer AC10 (1.8 wt%), B2 (0.32 wt%) and photoinitiator C (0.1 wt%) in the NLC/B2 mixture (AC10+B2+C=2.22 wt%). Thus, we measured the electrooptical and display properties of the LC devices using the 1:10 NSLC mixture, that is, SmA∗: AC10+B2+C=1:10. We also studied their phase-transition behavior, XRD patterns, UV conversion percentage and device display effects, in addition to their transmittance, grayscale capability and response time.
Next, we obtained the NSLC solutions by heating the SmA∗ LC compound to approximately 20 °C above the clear point (isotropic temperature), followed by ultrasonication and stirring for about 1 h. The LC mixture solutions were subsequently kept stable in a homogeneously isotropic phase at room temperature, followed by injection via capillary action under vacuum to fill an empty cell with ball-shaped glass fiber spacers (diameter 4 μm). We also observed the effects of increasing the concentration of the SmA∗ LC compound on the electrooptical properties of the LC device.
PIPS and UV conversion behaviors of NLC/B1, NLC/B2 and NSLC mixtures
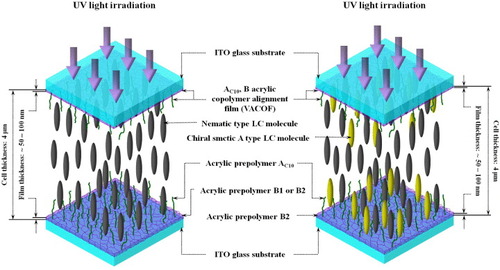
Many factors affect polymer film morphology, e.g. cell thickness, temperature, and the intensity and duration of UV irradiation. They all have different effects on the PIPS rate of the photosensitive prepolymer and can result in polymer (PSCOF and PDLC) films [Citation75, Citation77] with markedly different morphologies, characteristics and applications. To obtain VACOFs with smooth surface, the temperatures of the NLC/B1, NLC/B2 and NSLC mixtures were kept at 90 °C (the isotropic temperature of the NLC) using a Mettler FP-82HT hot stage during the UV irradiation (intensity ∼5 mW cm-2). After completing the PIPS (figure ), the LC cells with the NLC/B1, NLC/B2 and NSLC mixtures were slowly cooled to room temperature.
Figure 2 Schematics of multicomponent LC mixture cells after UV irradiation, showing formation of double VACOF layers due to phase separation.
In addition, we prepared NLC/B1, NLC/B2 and NSLC mixtures with a methanol solvent concentration of 3.3×10⁻⁶ mol l-1, and measured the variations in the optical absorption value (λmax) of the five LC mixtures during the UV irradiation (duration 0–30 min). From these data, we calculated the conversion percentage of the materials and the degree of VACOF polymerization.
Thermal analysis
The phase-transition temperatures of the pure NLC and NSLC mixtures were measured with a differential scanning calorimeter (DSC, PerkinElmer DSC 4000) as the maxima of endothermic and exothermic peaks (Tendo,max and Texo,max). All the compounds were first heated and cooled at a rate of 5 °C min-1 in a nitrogen atmosphere. The transition temperatures were measured during the second heating and cooling scans.
The LC textures of the NLC and NSLC mixtures were observed by polarized optical microscopy (POM, Olympus Optical Co, Ltd, models BHSP-2 and BX-51) coupled with a Mettler FP-82HT hot stage, and the degree of vertical alignment was evaluated by conoscopy.
XRD analysis of SmA∗ LC
On account of the homeotropic texture exhibited by the SmA∗ LC between 95 and 155 °C, we applied Bragg's law [Citation84, Citation85] to determine the molecular arrangements in the crystal 1 (Cr1) and crystal 2 (Cr2) states as
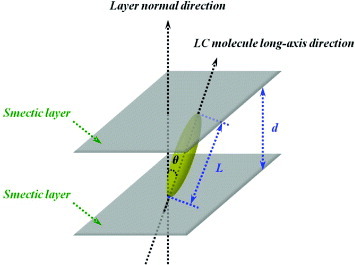
where the integer n is the ‘order’ of reflection, λ is the x-ray wavelength, d is the spacing between the SmA∗ LC layers and ϕ is the angle of incidence. From the XRD analysis results, one can determine the practical projection length of the LC molecules and then calculate the largest theoretical length L of the LC molecules (with the LC molecules in the coplanar, trans configuration) through 3D simulation.
Synchrotron powder XRD measurement was then performed in a transmission geometry at the beamline BL17A (λ=1.33366 Å) of the National Synchrotron Radiation Research Center (NSRRC), Taiwan. The XRD data were collected using a Mar345 image plate detector mounted normal to the beam, 220 mm away from the sample, with diffraction signals accumulated for 30 s. The powder samples were packed into a capillary tube and heated by a heat gun equipped with a temperature controller. The scattering angle was calibrated using a mixture of silver behenate and silicon. For the 2D XRD patterns, surface-aligned samples of mesophases were obtained by a slow cooling (1 °C min-1) of a small droplet of the compound from the isotropic melt on a glass plate treated with a commercially available homeotropic agent.
After complete scanning and plotting the intensity versus diffraction angle 2ϕ, we studied the sharp small-angle diffraction peaks observed at different temperatures and calculated d with equation (1). Substituting d into equation (2) enables us to estimate the tilt angle θ (see figure ) as
Figure 3 Tilt angle θ of LC molecules deduced by comparing projection length d of LC molecules (obtained from XRD data) with theoretical length L.
Electrooptical properties of LC mixtures
Transmittance, threshold voltage, driving voltage and saturation voltage
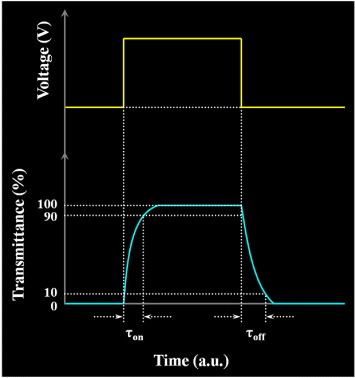
In the experiments, we used a white light source [Citation40, Citation41] and a setup for measuring optical transmittance, threshold voltage (Vth), driving voltage (Von) and saturation voltage (Vsat). We first placed the LC cell under a POM with crossed polarizers (V=0) and defined transmittance to be 0%; then, we applied a saturation voltage (V=Vsat) and assigned a transmittance of 100% to the state with the maximum brightness. Next, we placed the LC cell under the crossed polarizers of the POM and applied an alternating electric field (0–7 V, 60 Hz, square wave) with a waveform generator. The light signal received by a photomultiplier (International light, SED038) was subsequently calibrated with a radiometer to study the variation in transmittance with slowly increasing voltage [Citation86]. From the transmittance versus applied voltage curve, we deduced the threshold, driving and saturation voltages, i.e. Vth, Von and Vsat, respectively, defined as the voltages when the transmittance reached 10, 90 and 100%, respectively. The maximum transmittance was obtained when the tilt angle of the LC molecules inside the LC cell under the influence of the electrical field (V=Vsat) reached 45° with crossed polarizers. The transmitted light intensity I is given as [Citation87, Citation88]
where I0 and λ are the intensity and wavelength of incident light, respectively, ψ is the angle between the polarization direction of the incident light and the long axes of the LC molecules, d is the cell thickness, Δn(V) is the birefringence at the voltage V and dΔn (V) is the retardation R of the LC.
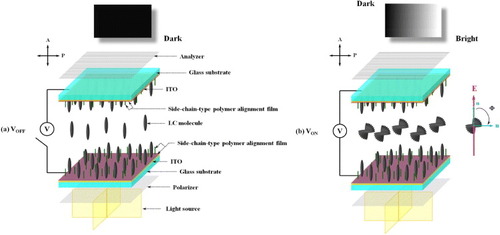
Additionally, under the POM with crossed polarizers, we could observe the dark- and bright-state display conditions before (V=0, the long axis of the LC molecules is aligned to the normal of the ITO substrate) and after (V=Vsat, the short axis of the LC molecules is aligned to the electric field) a voltage was applied to the LC cell, owing to the electrically controlled birefringence effect [Citation89–91]. The principles behind the electrooptical effects of the vertical alignment mode [Citation92, Citation93] are shown in figure .
Figure 4 Electrooptical effects related to photoinduced vertical alignment. (a) Dark state before application of voltage. (b) Bright state after application of voltage.
Response time
We employed a He–Ne laser (10 mW, λ=632.8 nm) as the incident light source [Citation40, Citation41, Citation86] and positioned the LC cell between crossed polarizers for measurements. After the application of an alternating saturation voltage (10 Hz, square wave), the signal was detected by a photodiode and displayed on an oscilloscope. From the detected shapes of the waveform, we calculated the total response time as the sum of the rise time (τon) and fall time (τoff):
Here, τon is the time required for the transmittance to rise from 10 to 90% and τoff is the time required for the transmittance to fall from 90 to 10%, as shown in figure .
Figure 5 Definitions of rise time (τon) and fall time (τoff) of LC molecule orientation.
Results and discussion
UV conversion percentage of LC mixtures
After the NLC/B1, NLC/B2 and NSLC mixtures were exposed to UV light for 0–30 min, PIPS resulted in the production of free radicals by the photoinitiator. The interaction of free radicals with the unsaturated functional groups (acetyl double bonds) of the photosensitive acrylic prepolymer initiated copolymerization reactions. At this stage, the miscibility of the liquid crystal and photosensitive acrylic prepolymer slowly decreased to the point where the reactions terminated and a complete phase separation was achieved. The photoinitiator would attack the unsaturated acetyl double bonds, thus causing the UV absorption values to decrease and saturate. Thus, we converted the variations in the UV absorptions of the NLC/B1, NLC/B2 and NSLC mixtures during the UV irradiation to the UV conversion percentage, as shown in figure .
Figure 6 UV conversion percentages of NLC/B1, NLC/B2, NSLC/1, NSLC/2 and NSLC/3 mixtures versus UV irradiation time (inset: time required to reach 89% conversion).
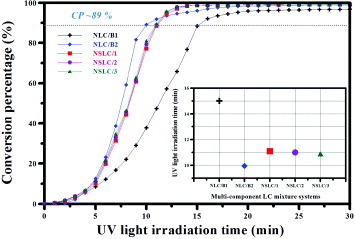
Figure shows that the conversion percentages of the NLC/B1, NLC/B2 and NSLC mixtures were reached 89% after UV irradiation for 15, 10 and 11 min, respectively. We can conclude from this observation that the change in the main chain type in the LC mixtures from B1 to B2 leads to an increase in the copolymerization rate (inset of figure ). Nevertheless, after UV irradiation for 30 min, the conversion percentages of all the LC mixtures exceeded 97%.
We selected five LC mixtures whose conversion percentages were 89% primarily to avoid the incomplete separation of LC molecules from the copolymer volume of the photosensitive acrylic prepolymer under insufficient UV irradiation time, which would lead to a PDLC film structure morphology. In another scenario, where the UV irradiation time was exceedingly long despite the phase separation being nearly complete, the cross-linking density of the polymer film would be greater and the degree of crystallization would increase rapidly, rendering the formed VACOF more brittle.
To achieve uniformity in the experimental conditions and avoid the occurrence of the aforementioned scenarios, we selected NLC/B1, NLC/B2, NSLC/1 NSLC/2 and NSLC/3 mixtures with approximately the same conversion percentages (∼89%) for further experiments.
Phase-transition behaviors and POM observations of pure NLC and NSLC mixtures
We conducted DSC analysis and POM (cell thickness 4 μm) observations on NLC and NSLC mixtures irradiated with UV light. The UV conversion percentage of the NSLC mixture was ∼89% (see figure ), and the results are summarized in table .
Phase-transition temperatures deduced from DSC thermograms, enthalpies of transitions, and optical textures observed with POM during second cooling (cell thickness 4 μm). The phase-transition temperatures were taken at the maxima of endothermic and exothermic DSC peaks during the second heating and cooling cycles at 5 °C min-1. For the heating and cooling processes, we used positive (negative) values for endothermic (exothermic) variations in enthalpy. Cr=crystalline, N=nematic and I=isotropic liquid phase; •=phase exists.
From table , the isotropic temperature of pure NLC was 92.1 °C (second cooling process). The POM image in table (a) showed a nematic Schlieren texture during the second cooling (temperature ∼30 °C). On the other hand, when a trace amount of pure SmA∗ LC compound was added, the photosensitive acrylic prepolymer and photoinitiator had little effect on the phase-transition temperature of pure NLC, with isotropic temperature varying between -91.7 and -91 °C. Therefore, this addition should not affect the application temperature range of pure NLC. Tables (b–d) show that the nematic and smectic LC molecules of the NSLC mixture, after being photoaligned and cooled below 30 °C (second cooling), exhibited uniform vertically aligned states and conoscopic patterns.
Auxiliary mechanism of vertical alignment in NSLC mixture
In previous studies of photoinduced vertical alignment in LC devices, POM and scanning electron microscopy (SEM, JEOL, JSM-6390LV) were used to prove that the copolymer morphology after photoalignment is indeed a VACOF with a smooth surface, instead of a networked PDLC film (where the devices operated in the scattering mode) [Citation40, Citation41].
Our main motivation for adding an SmA∗ LC was that the anchoring force of the alignment film surface formed after the regular photoalignment process was relatively weak. Thus, we added an SmA∗ LC with a homeotropic texture not only to improve the vertical alignment of LC molecules in the auxiliary LC mixture, but also to enhance the anchoring force of the VACOF surface.
One can deduce from figure and the subsequent results on the electrooptical properties that most of the SmA∗ LC molecules were uniformly distributed on the VACOF surfaces of the upper and lower layers, thereby strengthening the anchoring force of the alignment film surfaces.
XRD analysis of SmA∗ LC
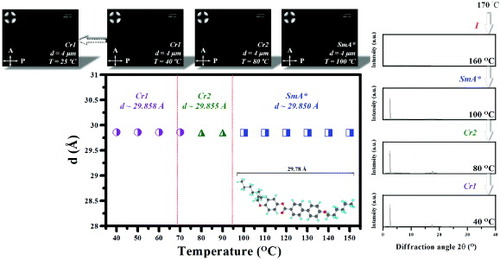
To further ascertain the molecular arrangement of the SmA∗ LCs, we employed XRD analysis to determine the structure of the different phases and the CS Chem3D Ultra 7.0 software to perform molecular simulation. We were armed with the knowledge that the molecular core assumed the coplanar configuration while the alkoxy chain spacers took on the fully extended all-trans configuration with a molecular length of 29.78 Å (see the inset of figure ). Additionally, figure shows the spacing between SmA∗ LC layers (d), as measured by XRD analysis at different temperatures and in different phase states. From the figure (see the XRD patterns in figure ), one can see that the SmA∗ LC compound exhibited a very broad diffraction peak at the isotropic temperature (∼160 °C). As the temperature was gradually lowered to the range of the chiral SmA∗ and even of the Cr2 and Cr1 phases, sharp diffraction peaks appeared at a small angle of 2.56°. From equation (1), this value corresponds to the average spacing between molecular layers of 29.85 Å. Figure shows that, within the temperature range of the chiral SmA∗ LC, Cr2 and Cr1 phases, the spacing between molecular layers was unchanged, and that the distance between the molecular layers of the Cr2 and Cr1 phases was the same as the molecular length. This finding explains why the LC molecules were perpendicular to the molecular layers. On the other hand, the POM inset of figure shows the homeotropic texture of the SmA∗ LC at that particular temperature, as well as the accompanying uniform vertical alignment state and conoscopic pattern. Even when the mixture was cooled to room temperature (∼25 °C), we observed the same state of the SmA∗ LC molecules, namely, light interference stripes in the form of a dark cross, suggesting that the LC molecules were optically uniaxial, with the optical axis and glass substrate exhibiting a vertical state, and hinting at the molecular arrangement of the LC molecules. In addition, the appearance of broad diffraction features was primarily the result of the variations in SmA∗ LC molecular distance (see the XRD patterns of figure ). These results clearly demonstrate that as temperature was lowered, the intermolecular interactions became stronger, resulting in a closer molecular packing and a higher density. A transition occurred from the Cr2 state to the Cr1 state, and while the spacing between layers did not change significantly, the LC molecules all exhibited vertical alignment with respect to the surface of the glass substrate (top row in figure ).
Figure 7 Spacing between SmA∗ LC layers as function of temperature during cooling from isotropic liquid phase. Top row: photographs and conoscopic patterns of SmA∗ LC compound. The inset in the main figure shows the structure and length of the SmA∗ LC molecule simulated with the CS Chem3D Ultra software. The right part shows the XRD patterns of the SmA∗ compound. I=isotropic liquid phase; Cr1,2=crystalline phase 1, 2.
Electrooptical studies of LC mixtures
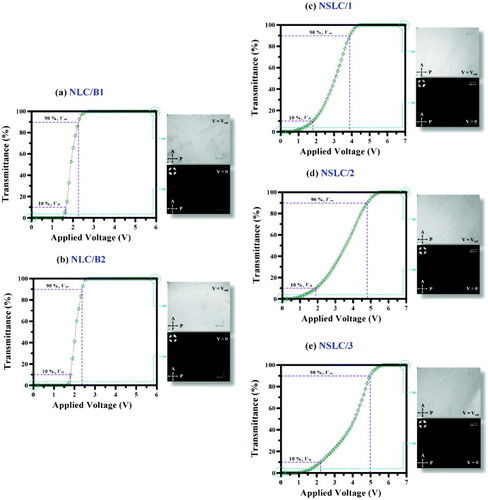
Figures (a)–(e) show the voltage-dependent transmittance of the NLC/B1, NLC/B2 and NSLC mixtures. From figures (a) and (b) and table , it is clear that, although the NLC/B1 and NLC/B2 mixtures had smaller values of Vth and Von than the NSLC mixture, the addition of SmA∗ LC markedly improved the grayscale switching performance of the LC device. Additionally, we observed that both Vth and Von increased with increasing concentration of the SmA∗ LC in the NSLC mixture, indirectly proving that the anchoring force of the VACOF surface increased upon the SmA∗ addition.
Figure 8 Transmittance versus applied voltage for (a) NLC/B1, (b) NLC/B2, (c) NSLC/1, (d) NSLC/2 and (e) NSLC/3 mixtures. Inset: POM images before and after a voltage was applied to the LC cells.
Threshold voltages (Vth), driving voltages (Von) and contrast ratios of LC mixtures.
The POM insets of figures (a)–(e) show the NLC/B1, NLC/B2 and NSLC mixtures with no voltage applied. On account of the vertical alignment of the LC molecules, a uniform dark state was observed in all five cases. After the application of a saturation voltage (V=Vsat), the short axes of the LC molecules collectively rotated in the direction of the electric field, thereby resulting in a single-domain bright-state display.
The theoretical Vth of the pure NLC has been calculated as ∼2.22 V using the following equation [Citation94, Citation95]:
where Keff is the effective elastic constant, ε0 is the vacuum permittivity and Δε is the dielectric anisotropy of the LC. Note that Vth is independent of cell thickness. From table , the experimental Vth values of the NLC/B1, NLC/B2, NSLC/1 and NSLC/2 mixtures were all smaller than the theoretical Vth of 2.22 V, suggesting fast driving in LC devices [Citation96–100]. Moreover, figures (a)–(e) show that all the LC mixtures retained excellent bright-state displays after the application of Vsat. We think that the LC mixture also has a satisfactory voltage holding ratio, yet another important indicator of the vertical alignment characteristics of LC molecules.
We found that the contrast ratios of the NLC/B2 and NSLC/1 mixtures increased by ∼56 and ∼73%, respectively, relative to that of the NLC/B1 mixtures (if one were to further increase the intensity of the incident light source in a sufficiently dark state, one could presumably increase the contrast ratio significantly). We interpret these results as follows. Although the VACOF surface cross-linking grids that formed on the NLC/B1 mixtures upon photoalignment (cross-linking reaction) were denser and resulted in excellent transmission for the dark state (V=0), the rotation of the LC molecules under an electric field (V=Vsat) would likely affect the transmission, resulting in a decrease in the overall contrast ratio. Moreover, although the dark states of the NLC/B2 mixtures were inferior to those of the NLC/B1 mixtures, the density of the VACOF surface grid after the cross-linking reaction was lower in NLC/B2 than in NLC/B1 (a longer main chain resulted in a higher d among the VACOF surface cross-linking gridlines). Thus, the transmission at V=Vsat was higher, which led to a marked increase in contrast ratio. In summary, a trace amount of SmA∗ LC compound was added to the NSLC mixtures; after the UV irradiation, the SmA∗ LC became distributed across the VACOF surfaces of the upper and lower layers. In addition to improving the dark-state performance of the NLC/B2 mixtures, this approach also enhanced the anchoring force of the VACOF surfaces (see table ) and improved the transmission of the LC molecules in the electric field, that is, the overall contrast ratio of the device. Increasing the concentration of the SmA∗ LC resulted in the distribution of the SmA∗ molecules in the LC cell, which affected not only the configuration of the NLC molecules but also their rotation in the electric field. This leads to a slight decrease in the transmittance, and thus in contrast ratio.
As to the temporal response of the LC mixtures, the rise and fall times can be respectively calculated as follows [Citation94, Citation95]:
where η1 is the rotation viscosity of the LC. For all the LC mixtures, τoff was slightly larger than τon (see table ). The rise time is the time required for the LC molecules to generate an electrooptical effect, whereas the fall time is the time required for the LC molecules to restore their original positions after the removal of the electric field; thus, equation (7) is independent of applied voltage. According to equations (6) and (7), decreasing cell thickness should speed up the LC response. Although the viscosity and effective elastic constant of the material also affect response time, these factors are less important than the surface anchoring force of the VACOF produced after the photoalignment of the NLC/B1 NLC/B2 and NSLC mixtures. The measured τ values are listed in table .
Rise times (τon), fall times (τoff) and total response times (τtot) of LC mixture systems.
From the experimental results, it is apparent that the weak anchoring force of the VACOF surfaces in the NLC/B2 mixtures resulted in a short τon. However, after the removal of the electric field, the weaker anchoring force of the VACOF surfaces results in a longer time required for the LC molecules to return to their original positions. Thus, after adding the SmA∗ LC into the NLC/B2 mixtures (we refer primarily to the NSLC/1 mixture), the increase in the anchoring force of the VACOF surface resulted in a slight decrease in τon. Nonetheless, in comparison with those of the NLC/B1 and NLC/B2 mixtures, the τoff and total response time of NSLC/1 mixture showed obvious improvements (see table ). Likewise, the accompanying NSLC mixture exhibited a decrease in τon and a slight increase in τoff as the anchoring force of the VACOF surface increased with increasing concentration of the SmA∗ LC. The total response times for the five LC mixtures ranged from 14 to 20 ms.
Conclusions
Using previously developed noncontact photoalignment techniques, we successfully fabricated LC devices with pseudo-polyimide VACOF. In this study, we added a chiral SmA∗ LC into NLC/B2 mixtures and achieved a photoinduced vertical alignment. This addition not only strengthened the anchoring force of the VACOF surface, but also enhanced characteristics such as grayscale switching, contrast ratio and response time. We think that employing the noncontact photopolymerization method in conjunction with the use of a flexible plastic substrate and multidomain vertical alignment technology holds much promise for fabricating LC devices with wide viewing angles and high contrast ratios. We will continue in our further development of these NSLC mixtures for liquid crystal display applications.
Acknowledgments
The authors thank Mr Kai-Neng Yang from Chimei Innolux Corporation for supplying the photosensitive acrylic prepolymer, photoinitiator and other materials for the experiment, and for his advice and numerous suggestions, which were invaluable for the smooth completion of the experiments. Additionally, we would like to express our gratitude to Dr Jey-Jau Lee for assistance with the XRD analysis at the National Synchrotron Radiation Research Center (NSRRC, beamline BL17A) in Taiwan. Last but not least, we gratefully acknowledge the financial support from the National Science Council of Taiwan (ROC) through Grant no. 98-2221-E-011-004.
References
- BerremamD W 1972 Phys. Rev. Lett. 28 1683 http://dx.doi.org/10.1103/PhysRevLett.28.1683
- ClarkN ALagerwallS T 1980 Appl. Phys. Lett. 36 899 http://dx.doi.org/10.1063/1.91359
- GearyJ MGoodbyJ WKmetzA RPatelJ S 1987 J. Appl. Phys. 62 4100 http://dx.doi.org/10.1063/1.339124
- ToneyM FRussellT PLoganJ AKikuchiHSandsJ MKumarS K 1995 Nature 374 709 http://dx.doi.org/10.1038/374709a0
- LeeK WPaekS HLienADurningC JFukuroH 1996 Macromolecules 29 8894 http://dx.doi.org/10.1021/ma960683w
- LiBHeTLiYDingM 1997 Polym. Adv. Technol. 8 513 http://dx.doi.org/10.1002/(ISSN)1099-1581
- GeJ J et al 2001 J. Am. Chem. Soc. 123 5768 http://dx.doi.org/10.1021/ja0042682
- HaarenJ V 2001 Nature 411 29 http://dx.doi.org/10.1038/35075178
- StöhrJSamantM GLüningJCallegariA CChaudhariPDoyleJ PLaceyJ ALienS APurushothamanSSpeidellJ L 2001 Science 292 2299 http://dx.doi.org/10.1126/science.1059866
- BehdaniMKeshmiriH SSoriaSBaderA MIhlemannJMarowskyGRasingT 2003 Appl. Phys. Lett. 82 2553 http://dx.doi.org/10.1063/1.1565703
- KumarSKimJ HShiY 2005 Phys. Rev. Lett. 94 077803 http://dx.doi.org/10.1103/PhysRevLett.94.077803
- EgertonP LPittsEReisterA 1981 Macromolecules 14 95 http://dx.doi.org/10.1021/ma50002a019
- IchimuraKSuzukiYSekiTHosokiAAokiK 1988 Langmuir 4 1214 http://dx.doi.org/10.1021/la00083a030
- ShannonP JGibbonsW M 1994 Nature 368 532 http://dx.doi.org/10.1038/368532a0
- SchadtMSeiberleHSchusterA 1996 Nature 381 212 http://dx.doi.org/10.1038/381212a0
- NeillM OKellyS M 2000 J. Phys. D: Appl. Phys. 33 R67 http://dx.doi.org/10.1088/0022-3727/33/10/201
- WangYXuSKanazawaAShionoTIkedaTMatsukiYTakeuchiU 2001 Liq. Cryst. 28 473 http://dx.doi.org/10.1080/02678290010017962
- OoT NIwataTKimuraMAkahaneT 2005 Sci. Technol. Adv. Mater. 6 149 http://dx.doi.org/10.1016/j.stam.2004.11.009
- NazarenkoV GBoikoO PNychA BNastishinYuPergamenshchikV MBosP 2006 Europhys. Lett. 75 448 http://dx.doi.org/10.1209/epl/i2006-10122-9
- KawatsukiNKoezukaY 2009 Polymer 50 2349 http://dx.doi.org/10.1016/j.polymer.2009.03.033
- GibbonsW MShannonP JSunS TSwetlinB J 1991 Nature 351 49 http://dx.doi.org/10.1038/351049a0
- ChaudhariP et al 2001 Nature 411 56 http://dx.doi.org/10.1038/35075021
- ChouS YKraussP RRenstromP J 1996 Science 272 85 http://dx.doi.org/10.1126/science.272.5258.85
- MarzolinCSmithS PPrentissMWhitesidesG M 1998 Adv. Mater. 10 571 http://dx.doi.org/10.1002/(ISSN)1521-4095
- XiaYWhitesidesG M 1998 Angew. Chem., Int. Ed. Engl. 37 550 http://dx.doi.org/10.1002/(ISSN)1521-3773
- ChouS YKeimeiCGuJ 2002 Nature 417 835 http://dx.doi.org/10.1038/nature00792
- ChiouD RYehK YChenL J 2006 Appl. Phys. Lett. 88 133123 http://dx.doi.org/10.1063/1.2191472
- ChiouD RChenL J 2006 Langmuir 22 9403 http://dx.doi.org/10.1021/la061875f
- WassermanS RTaoY TWhitesidesG M 1989 Langmuir 5 1074 http://dx.doi.org/10.1021/la00088a035
- GuptaV KAbbottN L 1996 Langmuir 12 2587 http://dx.doi.org/10.1021/la960003i
- GuptaV KAbbottN L 1996 Phys. Rev. E 54 R4540 http://dx.doi.org/10.1103/PhysRevE.54.R4540
- MillerW JAbbottN L 1997 Langmuir 13 7106 http://dx.doi.org/10.1021/la970621e
- EvansS DAllinsonHBodenNFlynnT MHendersonJ R 1997 J. Phys. Chem. B 101 2143 http://dx.doi.org/10.1021/jp9633411
- WuC GChenJ Y 1997 Chem. Mater. 9 399 http://dx.doi.org/10.1021/cm9602860
- LeeBClarkA 2001 Science 291 2576 http://dx.doi.org/10.1126/science.291.5513.2576
- ChungD HFukudaTTakanishiYIshikawaKMatsudaHTakezoeHOsipovM A 2002 J. Appl. Phys. 92 1841 http://dx.doi.org/10.1063/1.1493658
- JanningJ L 1972 Appl. Phys. Lett. 21 173 http://dx.doi.org/10.1063/1.1654331
- UrbachWBoixMGuyonE 1974 Appl. Phys. Lett. 25 479 http://dx.doi.org/10.1063/1.1655556
- HeffnerW RBerremanD WSammonMMeiboomS 1980 Appl. Phys. Lett. 36 144 http://dx.doi.org/10.1063/1.91408
- HoC YLeeJ Y 2010 Liq. Cryst. 37 997 http://dx.doi.org/10.1080/02678291003746247
- HoC YTsaiP SLinH GLiF CLinF HLeeJ Y 2011 Polym. Adv. Technol. at press
- VorflusevVKumarS 1999 Science 283 1903 http://dx.doi.org/10.1126/science.283.5409.1903
- DoaneJ WVazN AWuB GZumerS 1986 Appl. Phys. Lett. 48 269 http://dx.doi.org/10.1063/1.96577
- StannariusRCrawfordG PChienL CDoaneJ W 1991 J. Appl. Phys. 70 135 http://dx.doi.org/10.1063/1.350326
- CrawfordN JDadmunM DBunningT JNatarajanL V 2006 Polymer 47 6311 http://dx.doi.org/10.1016/j.polymer.2006.06.058
- DuranHMengSKimNHuJKyuTNatarajanL VTondigliaV PBunningT J 2008 Polymer 49 534 http://dx.doi.org/10.1016/j.polymer.2007.11.039
- DierkingIKosbarL LAfzaliArdakaniLoweA CHeldG A 1997 J. Appl. Phys. 81 3007 http://dx.doi.org/10.1063/1.364335
- DierkingIKosbarL LAfzaliArdakaniLoweA CHeldG A 1997 Appl. Phys. Lett. 71 2454 http://dx.doi.org/10.1063/1.120087
- DrzaicP S 1986 J. Appl. Phys. 60 2142 http://dx.doi.org/10.1063/1.337167
- ParmarD SSinghJ J 1992 Appl. Phys. Lett. 61 2039 http://dx.doi.org/10.1063/1.108352
- ShenCKyuT 1995 J. Chem. Phys. 102 556 http://dx.doi.org/10.1063/1.469435
- MasoodS HDumonMEloundouJ PPascaultJ P 1996 Polymer 37 4795 http://dx.doi.org/10.1016/S0032-3861(96)00330-8
- PogueR TNatarajanL VSiweckiS ATondigliaV PSutherlandR LBunningT J 2000 Polymer 41 733 http://dx.doi.org/10.1016/S0032-3861(99)00196-2
- ZhangWLinJYuTLinSYangD 2003 Eur. Polym. J. 39 1635 http://dx.doi.org/10.1016/S0014-3057(03)00074-0
- NatarajanL VBrownD PWoffordJ MTondigliaV PSutherlandR LLloydP FBunningT J 2006 Polymer 47 4411 http://dx.doi.org/10.1016/j.polymer.2006.04.033
- ChoiS WMatsumotoSTakanishiYIshikawaKNishiyamaIKawamuraJTakadaHTakezoeH 2006 Org. Electron. 7 295 http://dx.doi.org/10.1016/j.orgel.2006.02.005
- HeJYanBWangXYuBWangY 2007 Eur. Polym. J. 43 4037 http://dx.doi.org/10.1016/j.eurpolymj.2007.06.032
- WhiteT JNatarajanL VTondigliaV PLloydP FBunningT JGuymonC A 2007 Polymer 48 5979 http://dx.doi.org/10.1016/j.polymer.2007.08.007
- KitzerowH SMolsenHHeppkeG 1992 Appl. Phys. Lett. 60 3093 http://dx.doi.org/10.1063/1.106762
- LuZ JYangD K 1994 Appl. Phys. Lett. 65 505 http://dx.doi.org/10.1063/1.112984
- EscutiJKossyrevPCrawfordG PFiskeT GColegroveJSilversteinL D 2000 Appl. Phys. Lett. 77 4262 http://dx.doi.org/10.1063/1.1335544
- VilfanMZalarBFontecchioA KVilfanMEscutiM JCrawfordG PZumerS 2002 Phys. Rev. E 66 021710 http://dx.doi.org/10.1103/PhysRevE.66.021710
- ChoY HHeMKimB KKawakamiY 2004 Sci. Technol. Adv. Mater. 5 319 http://dx.doi.org/10.1016/j.stam.2003.12.016
- ChoY HKawadeRKubotaTKawakamiY 2005 Sci. Technol. Adv. Mater. 6 435 http://dx.doi.org/10.1016/j.stam.2005.03.014
- MuraiHGotohTNakataTHasegawaE 1962 J. Appl. Phys. 81 1962 http://dx.doi.org/10.1063/1.364052
- VicariL 1999 J. Opt. Soc. Am. B 16 1135 http://dx.doi.org/10.1364/JOSAB.16.001135
- YangD KChienL CDoaneJ W 1992 Appl. Phys. Lett. 60 3102 http://dx.doi.org/10.1063/1.106765
- FungY KYangD KDoaneJ W 1992 Proc. SPIE 1664 41 http://dx.doi.org/10.1117/12.60347
- LovingerA JAmundsonK RDavisD D 1994 Chem. Mater. 6 1726 http://dx.doi.org/10.1021/cm00046a027
- RajaramC VHudsonS DChienL C 1995 Chem. Mater. 7 2300 http://dx.doi.org/10.1021/cm00060a018
- RajaramC VHudsonS DChienL C 1996 Chem. Mater. 8 2451 http://dx.doi.org/10.1021/cm9505207
- LegrangeJ DCarterS AFuentesMBooJFreenyA EClevelandWMillerT M 1997 J. Appl. Phys. 81 5984 http://dx.doi.org/10.1063/1.364388
- CarterS ALegrangeJ DWhiteWBooJWiltziusP 1997 J. Appl. Phys. 81 5992 http://dx.doi.org/10.1063/1.364447
- PrkN HChoS AKimJ YSuhK D 2000 J. Appl. Polym. Sci. 77 3178 http://dx.doi.org/10.1002/(ISSN)1097-4628
- QianTKimJ HKumarSTaylorP L 2000 Phys. Rev. E 61 4007 http://dx.doi.org/10.1103/PhysRevE.61.4007
- DuFWuS T 2003 Appl. Phys. Lett. 83 1310 http://dx.doi.org/10.1063/1.1602152
- WangQParkJ OSrinivasaraoMQiuLKumarS 2005 Japan J. Appl. Phys. 44 3115 http://dx.doi.org/10.1143/JJAP.44.3115
- HoC YWangL SLinF HLeeJ Y 2011 Liq. Cryst. 38 381 http://dx.doi.org/10.1080/02678292.2010.550068
- GaroffSMeyerR B 1977 Phys. Rev. Lett. 38 848 http://dx.doi.org/10.1103/PhysRevLett.38.848
- AnderssonGDahlIKellerPKuczyńskiWLagerwallS TSkarpKSteblerB 1987 Appl. Phys. Lett. 51 640 http://dx.doi.org/10.1063/1.98341
- ElstonSSamblesR 1998 The Optics of Thermotropic Liquid Crystals London Taylor and Francis
- SpectorM SHeineyP ANacirJWeslowskiB THoltD BShashidharR 2000 Phys. Rev. E 61 1579 http://dx.doi.org/10.1103/PhysRevE.61.1579
- ClarkN ABelliniTShaoR FColemanDBardonSLinkD RMaclennanJ E 2002 Appl. Phys. Lett. 80 4097 http://dx.doi.org/10.1063/1.1480472
- ReddyR ASchroderM WBodyaginMKresseHDieleSPelzlGWeissflogW 2005 Angew. Chem., Int. Ed. Engl. 44 774 http://dx.doi.org/10.1002/(ISSN)1521-3773
- SadashivaB KReddyR APratibhaRMadhusudanaN V 2001 Chem. Commun. 20 2140 http://dx.doi.org/10.1039/b106084h
- SpurceGPringleR D 1988 Mol. Cryst. Liq. Cryst. 154 307 http://dx.doi.org/10.1080/00268948808078739
- deGennesProstJ 1993 The Physics of Liquid Crystals Oxford Clarendon
- YehPGuC 1999 Optics of Liquid Crystal Displays New York J Wiley
- SchiekelM FFahrenschonK 1971 Appl. Phys. Lett. 19 391 http://dx.doi.org/10.1063/1.1653743
- AssoulineGHarengMLeibaE 1971 Electron. Lett. 7 699 http://dx.doi.org/10.1049/el:19710478
- HarengMAssoulineGLeibaE 1972 Proc. IEEE 60 913 http://dx.doi.org/10.1109/PROC.1972.8805
- MooreJ ADasheffA N 1988 Chem. Mater. 1 163 http://dx.doi.org/10.1021/cm00001a029
- BahadurB 1990 Liquid Crystal: Applications and Uses Singapore World Scientific
- JakemanERaynesE P 1972 Phys. Lett. A 39 69 http://dx.doi.org/10.1016/0375-9601(72)90332-5
- NastishinY APolakR DShiyanovskiiS V 1999 Appl. Phys. Lett. 75 202 http://dx.doi.org/10.1063/1.124319
- LiX TKawakamiAAkiyamaHKobayashiSIimuraY 1998 Japan J. Appl. Phys. 37 L743 http://dx.doi.org/10.1143/JJAP.37.L743
- NephewJ BNiheiT CCarterS A 1998 Phys. Rev. Lett. 80 3276 http://dx.doi.org/10.1103/PhysRevLett.80.3276
- ChiangC H et al 2007 Japan J. Appl. Phys. 46 5917 http://dx.doi.org/10.1143/JJAP.46.5917
- NieXXianyuHLuRWuTXWuS T 2007 J. Display Technol. 3 280 http://dx.doi.org/10.1109/JDT.2007.900926
- JiaoMGeZSongQWuS T 2008 Appl. Phys. Lett. 92 061102 http://dx.doi.org/10.1063/1.2841642