Abstract
Metal release from implantable metals and the properties of oxide films formed on alloy surfaces were analyzed, focusing on the highly biocompatible Ti–15Zr–4Nb–4Ta alloy. The thickness and electrical resistance (Rp) of the oxide film on such an alloy were compared with those of other implantable metals. The quantity of metal released during a 1-week immersion test was considerably smaller for the Ti–15Zr–4Nb–4Ta than the Ti–6Al–4V alloy. The potential (E10) indicating a current density of 10 μA cm−2 estimated from the anodic polarization curve was significantly higher for the Ti–15Zr–4Nb–4Ta than the Ti–6Al–4V alloy and other metals. Moreover, the oxide film (4–7 nm thickness) formed on the Ti–15Zr–4Nb–4Ta surface is electrochemically robust. The oxide film mainly consisted of TiO2 with small amounts of ZrO2, Nb2O5 and Ta2O5 that made the film electrochemically stable. The Rp of Ti–15Zr–4Nb–4Ta was higher than that of Ti–6Al–4V, i.e. 0.9 Ω cm2 in 0.9% NaCl and 1.3 Ω cm2 in Eagle's medium. This Rp was approximately five-fold higher than that of stainless steel, which has a history of more than 40 years of clinical use in the human body. Ti–15Zr–4Nb–4Ta is a potential implant material for long-term clinical use. Moreover, E10 and Rp were found to be useful parameters for assessing biological safety.
1. Introduction
Metallic materials have been extensively used in orthopedic implants (e.g. bone screws, bone plates, compression hip screws, intramedullary fixations, short femoral nails, artificial hip joints, artificial knee joints, spinal instruments and dental implants), which have high strength, durability and ductility in terms of structural safety. Stainless steel, cobalt–chrome–molybdenum (Co–Cr–Mo) alloy and titanium (Ti) alloys are most common materials in these applications; in particular, the use of Ti alloys is increasing. Materials of orthopedic implants should satisfy the safety concerns such as biological and mechanical compatibilities. In addition, cytotoxicity, sensitization, genotoxicity, irritation or intracutaneous reactivity, systemic toxicity (acute), sub-chronic toxicity (sub-acute toxicity) and animal implantation tests are conducted to assess the biological compatibility of materials. Both the material and the product are studied for mechanical compatibility: microstructure, corrosion resistance, fatigue and mechanical properties are evaluated for the former, whereas the durability test is conducted for the latter. Metallic materials with a good balance of mechanical and fatigue strengths are frequently used in orthopedic implants, because mechanical safety parameters (e.g. durability) affect the long-term clinical performance of the implant. Materials for clinical implantations should be safe both biologically and mechanically.
The relationships between the cytocompatibility and polarization resistance of various pure metals are summarized in [Citation1–Citation4]. The cytotoxicity of V ions is observed at a medium concentration of 0.1 parts per million by weight (μg ml−1). Among the 70 metals in the periodic table, only Ti and Zr show excellent cytocompatibility to both soft-tissue-derived mouse fibroblast cells and bone-derived mouse osteoblast cells [Citation2]. Adding a small amount of alternative metal elements improves corrosion resistance and biocompatibility of Ti alloys. However, excessive addition of Nb and Ta to Ti alloy may increase manufacturing costs. Ti alloys are categorized into three types according to microstructure: α type having a hexagonal close-packed structure (hcp), β type with a body-centered cubic structure (bcc), and α–β type alloys containing a mixture of the α- and β-phases; the α–β type exhibit better fatigue characteristics than β-type alloys. Among the α–β-type Ti alloys, Ti–6Al–4V has been extensively used for various orthopedic applications. Another α–β-type Ti alloy, Ti–15Zr–4Nb–4Ta, has been developed in Japan as a highly biocompatible material for long-term biomedical applications [Citation5–Citation8] and is now standardized in the Japanese Industrial Standard JIS T 7401-4 [Citation9].
The biological safety parameters (e.g. cytotoxicity, sensitization, genotoxicity irritation or intracutaneous reactivity, systemic toxicity (acute), sub-chronic toxicity (sub-acute toxicity) and implantation properties) of metallic materials depend on the strength and stability of passive films formed on the metal surface. Stainless steel has stable and allowable levels of oxide films (passive films) in the human body. However, it is inferior to the Co–Cr–Mo and especially Ti alloys in this respect. Biological compatibility tests are usually carried out with cultured cells and animals. Recently, new experimental methods for replacing animal tests have been demanded because the existing tests suffer from low sensitivity and are inaccurate for materials with a higher strength of the passive film than that of stainless steel. Thus, our aim in this study was to research the immersion and electrochemical properties (electrochemical strength and stability) of oxide films and develop an alternative method for animal experimentation. Immersion tests, anodic polarization tests and electrochemical impedance measurements were conducted with highly biocompatible Ti–15Zr–4Nb–4Ta, Ti–6Al–4V, Co–Cr–Mo and Zr–2.5Nb alloys and on stainless steel.
2. Materials and methods
2.1. Materials
Vacuum-arc melting was performed on the Ti–15Zr–4Nb–4Ta alloy (JIS T 7401-4) for medical implants [Citation9]. A Ti–15Zr–4Nb–4Ta alloy ingot was homogenized at approximately 1250 °C for more than 5 h, and β-forged at the same temperature to a forging ratio, i.e., the ratio of cross sections before and after forging, of more than 3. Then, β-forging was conducted to reduce the grain growth of β-phase at 1050–1100 °C in proportion to the size of the billet and forging ratio. Afterwards, α–β forging at Tβ-(35–50 °C) was conducted to obtain the α and β structures by decoupling the fine β phase. Here Tβ indicates the β-transus temperature (100 vol% β phase). Billets of 30 × 30 mm cross section were manufactured by α–β forging and then annealed at 700 °C for 2 h. Four alloy types were prepared for comparison: Ti–6Al–4V (ISO 5832-3) [Citation10], Co–Cr–Mo (ISO 5832-4) [Citation11], stainless steel (ISO 5832-1) [Citation12] and Zr–2.5Nb (ASTM F 2384) [Citation13]. The fabricated Ti–6Al–4V ingot was soaked and β-forged into billets successively at 1150 °C for 3 h. The billets were then α–β-forged (starting temperature: 930 °C) and annealed at 700 °C for 2 h. The Co–Cr–Mo alloy was produced by vacuum-induction melting. To prepare annealed Co–Cr–Mo alloy plates, a Co–Cr–Mo alloy ingot was homogenized at 1250 °C for 5 h. After holding at 1200 °C for 1 h, the ingot was hot-forged into rod specimens, and then annealed at 1200 °C for 1 h. Stainless steel specimens were prepared by vacuum-induction melting. Stainless steel billets were solution-treated at 1075 °C for 30 min and then quenched in water (solution-treated). Zr–2.5Nb alloy billets were hot-forged into rod specimens. A Zr–2.5Nb rod was solution-treated at 780 °C for 1 h, quenched in water, and aged at 500 °C for 8 h. Table lists the compositions of the studied alloys.
Table 1. Chemical compositions (mass%) of the studied materials.
2.2. Static immersion test
We conducted a 7-day static immersion test on the alloys to examine the quantities of metal released from each alloy in different solutions and their pH dependence. The immersion test was performed in accordance with the JIS T 0304 standard [Citation14]. Plate specimens with dimensions of 20 × 40 × 1 mm were cut from sample alloys. The test solutions for the electrochemical evaluation of implantable metals are recommended in ISO 16428 [Citation15] and ISO 16429 [Citation16]. Ringer's solution and 0.9% NaCl are the recommended solutions for the corrosion test in ISO 16428 and ISO 16429 standards. ISO 16428 also states that 0.9% NaCl solution adjusted to pH 2 by adding HCl meets the rigorous testing conditions. ISO 16429 also defines 0.9% NaCl + HCl solutions at lower pH prepared by adding HCl (pH = 2, 3, 4, 5 and 6) and NaCl solutions with higher NaCl concentrations (1.8, 2.7, 3.6 and 4.5% NaCl). The solutions used in this immersion test (37 °C) were as follows: 0.9% NaCl (pH = 5.6), 1.8% NaCl (pH = 5.6), 2.7% NaCl (pH = 5.6), 3.6% NaCl (pH = 5.9), 4.5% NaCl (pH = 5.7), Ringer's solution (pH = 6.1), α-medium (pH = 7.5), phosphate-buffered saline [(PBS(–), pH = 7.5], calf serum (pH = 7.5), 0.9% NaCl + HCl (pH = 1,2,3,4,5), 4.5% NaCl + HCl (pH = 2), 1% lactic acid (pH = 2.2), 0.05% lactic acid (pH = 3.0), 0.01% lactic acid (pH = 3.5), artificial saliva (pH = 6.4), calf serum (pH-6.9), 0.01% HCl (pH = 2.0) and 1.2% l-cysteine (pH = 2.1). Unless otherwise noted, % denotes mass%. The plate specimens were surface-finished with different types of waterproof emery paper of 120, 240, 400, 600, 800 and 1000 grit under running water and then ultrasonically cleaned (three times for 5 min). Five plate specimens of each alloy were separately placed in polypropylene bottles and sterilized in an autoclave at 121 °C for 30 min. These bottles were carefully precleaned with 5 vol% concentrated HNO3 solution and with ultrapure water, and sterilized in an autoclave. The PBS solution was also sterilized in an autoclave. The other solutions, except for artificial saliva and 0.01% HCl, were sterilized by filtration through a 0.2-μm-pore membrane filter. A 50-ml aliquot of each solution was then poured into polypropylene bottles, each containing a plate specimen. All the bottles, except that containing the α-medium, were tightly sealed with a lid to maintain aseptic conditions. The bottle containing the α-medium was not tightly sealed to enable pH adjustment. All the bottles were placed inside an incubator in a 95% air–5% CO2 atmosphere at 37 °C for 7 days.
The concentration of metal released into the solution was determined in parts per billion (ng ml−1) using an inductively coupled plasma mass spectrometry (ICP-MS) system equipped with an autosampler. To minimize the effect of the matrix, the isotopic mass numbers were selected as follows: Zr 91 or 92; Nb 93; Ta 181; Al 27; V 51; Ti 49 or 50. Single-element standard solutions (SPEX CertiPrep, Inc., 1 mg ml−1) were diluted to establish the working curves for Zr, Nb, Ta, Al, V and Ti using at least seven datapoints. The ICP-MS measurements were performed in a clean room (class 10000), and the measured solutions were prepared on a clean bench (class 100). The analytical detection limits under these conditions were all below 0.05 ng ml−1. Bottles of each solution without a specimen were prepared as blanks. The quantity of released metal (μg cm−2) was estimated using the following formula: (amount of solution: 50 ml) × [metal concentration in each solution) − (mean metal concentration of three blank bottles)] / (surface area of specimen). The quantity of released metal was considered zero when the metal concentration was below that of the blank. The mean quantity of metal release and standard deviations were calculated for five specimens of each alloy.
2.3. Anodic polarization test
The anode polarization test was performed in accordance with the JIS T 0302 standard [Citation17] on Ti–15Zr–4Nb–4Ta, Ti–6Al–4V, Co–Cr–Mo and Zr–2.5Nb alloys and on stainless steel. Rod specimens of 15 mm diameter and 15 mm length and block specimens of 1 cm2 surface area for impedance measurement were cut from a sample alloy. They were then coated with epoxy resin, polished with different types of waterproof emery paper (120–1000 grit) and ultrasonically cleaned in ethanol (three times for 5 min each). The tests were conducted independently in Ringer's solution (pH = 6.4), PBS(–) (pH = 6.9), calf serum (pH = 7.5), Eagle's medium (pH = 7.5), 0.9% NaCl (pH = 5.6), 0.9% NaCl + HCl (pH = 1,2,4,6), 1.8% NaCl (pH = 5.6), 2.7% NaCl (pH = 5.6), 3.6% NaCl (pH = 5.9), 4.5% NaCl (pH = 5.7) and 1% lactic acid (pH = 2.1) using an automatic potentiostat. Each specimen was initially held at –1 V for 300 s and then at an open-circuit potential (corrosion potential) for 300 s. The test was repeated two or three times from –1 V to a maximum of 5 V at a sweep rate of 20 mV min−1.
2.4. Analysis of the oxide film using FE-TEM and ARXPS
2.4.1. FE-TEM.
Ti–15Zr–4Nb–4Ta alloy samples were polished with 1000, 1200, 2400 and 4000 grit waterproof emery papers, and mirrorlike finished by buff-cleaning with OP-S suspension. After mirrorlike finishing, an oxide film was formed on the alloy surface by anodic polarization from an open-circuit potential to 0.5 V versus the saturated calomel electrode (SCE) at a sweep rate of 40 mV min−1 in Eagle's medium. An FB-2000A focused ion beam (FIB) system (Hitachi, Ltd) and a micro-sampling system were used to prepare samples for field-emission transmission electron microscopy (FE-TEM). The Ti–15Zr–4Nb–4Ta sample was observed using an HF-2000 FE-TEM apparatus (Hitachi, Ltd) at an accelerating voltage of 200 kV at magnifications of 10 000–1 000 000. A sigma energy-dispersive x-ray spectrometer (Kevex) was used for analyzing the composition of the oxide film.
2.4.2. ARXPS.
The chemical bonding in oxide films was examined by angle-resolved x-ray photoelectron spectroscopy (ARXPS). After mirrorlike finishing, an oxide film was formed on the Ti–15Zr–4Nb–4Ta alloy by anodic polarization from an open-circuit potential to 0.5 V versus SCE at a sweep rate of 40 mV min−1 in Eagle's medium. We used a Quantera SXM, Physical Electronics XPS system in the automatic scanning mode, and the following conditions: x-ray source: A1 Kα, 45.1 W output; x-ray spot size: 200 μm; takeoff angles: 15°, 20°, 30°, 45°, 60° and 90°. The chemical state was analyzed from the binding energies extracted from narrow-range photoelectron spectra.
2.5. Analysis of the oxide film using electrochemical impedance spectroscopy
2.5.1. Equivalent circuit of the oxide film.
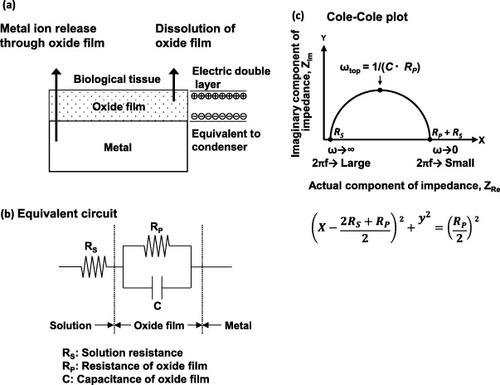
A surface oxide film, referred to as a passive film formed on metallic materials, plays an important role as an inhibitor of metal ion release (figure (a)). The metal surface of an oxide film (electric double layer) becomes equivalent to a capacitor [Citation18–Citation20]. Therefore, the equivalent circuit of an oxide film can be estimated as shown in figure (b). The following equation holds for this equivalent circuit: Here x and y represent the real and imaginary components of alternating impedance Z = E(t)/A(t) = [V/(A cm−2) = Ω cm2], where E is alternating voltage, A is alternating current density (A cm−2). A semicircle with a center at [(RS + RP/2), 0] and a radius of (RP/2) is also drawn. Thus, the resistances of the solution (RS, Ω cm2) and of the oxide film (RP, Ω cm2) are determined by fitting the measurement data using analytical software, and the capacitance C is calculated from the maximum ωtop = 1/(CRP). Impedance was modified using a constant-phase element (CPE), since the actual measurement brings a semicircle on a Nyquist diagram (Cole–Cole plot) [Citation18, Citation20]. CPE impedance is given by CPE = 1/((jω)nZCPE), where ZCPE corresponds to a capacitance-like element, ω (=2πf, f: frequency) is the angular frequency in rad s−1, j is the unit imaginary number, and n is an exponent between 0 and 1. When n = 1, the system behaves like an ideal capacitor and when n = 0, it behaves like an ideal resistor; when n is close to 1, ZCPE is close to C; n values obtained in this work were 0.87–0.96.
Figure 1 (a) Role and (b) equivalent circuit of the oxide film, (c) Cole–Cole plot.
2.5.2. Electrochemical impedance measurement.
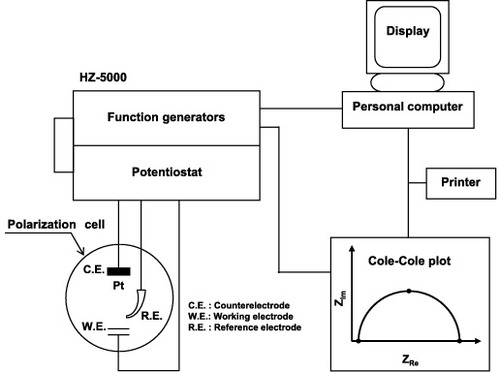
According to the principle described in section 2.5.1, the resistance of an oxide film (electric double layer) can be determined by measuring impedance and frequency. Ti–15Zr–4Nb–4Ta, Ti–6Al–4V, Co–Cr–Mo and Zr–2.5Nb alloys and stainless steel were used for electrochemical impedance spectroscopy (EIS). Samples with a surface area of 0.2–4 cm2 (typically 1 cm2) were soldered with lead for electrical connection and coated with epoxy resin. Then, the surface was finished using 1000 grit waterproof emery paper and ultrasonically cleaned in ethanol for 10 min. To achieve a mirrorlike finish, the samples were polished with 1000, 1200, 2400 and 4000 grit waterproof emery papers and then buff-cleaned using OP-S suspension. Electrochemical impedance measurements were conducted independently in 0.9% NaCl, Ringer's solution, Eagle's medium, 0.9% NaCl + HCl (pH = 1) and 0.9% NaCl containing 25 vol% calf serum (pH = 5.6) using an automatic electrochemical impedance apparatus, HZ-5000 (Hokuto Denkou) or PARSTAT 2273 (Princeton Applied Research). Figure shows the experimental setup. HZ-5000 was equipped with a frequency response analyzer (FRA) and a potentiostat. The Cole–Cole-plot and bode diagram were drawn by fitting them to an equivalent circuit using the analytical software HZ-5000ANAEIS-Analysis (Hokuto Denkou) or ZSimpWin (EChem Software) after the impedance test. The measurement cell contained the test samples, a Luggin capillary and three electrodes, i.e., a counter electrode (CE, platinum), working electrode (WE) and a reference electrode (RE, SCE); RE is electrically connected to the Luggin capillary via an agar salt bridge and a fluid bridge made of saturated KCI solution. The distance between the sample surface and the tip of the Luggin capillary was set to 5 mm, and the distance between the sample surface and CE was 20 mm. The temperature of the test solutions was held at 37 °C using a ceramic heater under atmospheric conditions. The test procedure was as follows: first, open-circuit potential was measured for 100 s. After keeping the test sample under this condition for another 100 s electrochemical impedance measurement was started. Alternating potential or current was measured at a constant alternating potential of 10 mV (for HZ-5000) or at a constant alternating current of 20 nA (for PARSTAT 2273) when the frequency was changed from 100 kHz to 10 mHz to calculate the actual and imaginary components, as well as the absolute value and phase difference of impedance. The measurements were repeated twice per condition to calculate the average and standard deviation. Moreover, to investigate the effects of oxide film thickness on impedance properties, an anodic polarization test was conducted before the impedance test. Anodic polarization was tested at a sweep rate of 40 mV min−1 starting from an open-circuit potential to a maximum of 3V versus SCE. The HZ-5000 auto-executed function enabled the measurement from the anodic polarization test to the impedance test.
Figure 2 Experimental setup for electrochemical impedance measurement.
3. Results and discussion
3.1. Metal ion release
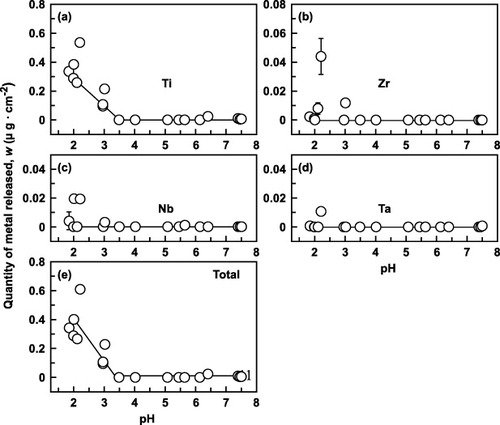
Figures and show the effect of pH on the quantities of metals released from Ti–6Al–4V and Ti–15Zr–4Nb–4Ta alloys, respectively. In Ti–6Al–4V the released quantities rapidly increased along with a pH decrease from 4 to 2, although the changes were relatively small for pH above 3. In contrast, even a low pH had virtually no effect on the metal release from Ti–15Zr–4Nb–4Ta, except for Ti release: the quantity of released Ti started to increase at pH < 3.5, although more gradually than in Ti–6Al–4V. The released quantities were significant at around pH = 2.2 (figure ), possibly due to the influence of 1% lactic acid. The total quantity of released metal was much lower for Ti–15Zr–4Nb–4Ta than Ti–6Al–4V, and it was hardly affected by Cl concentration. Clearly, the 0.9% NaCl + HCl solution adjusted to pH 2 is appropriate as an accelerated immersion test solution.
Figure 3 Effect of pH on the quantity of metal element released from Ti–6Al–4V alloy at 37 °C within 1 week: (a) Ti, (b) Al, (c) V and (d) total.
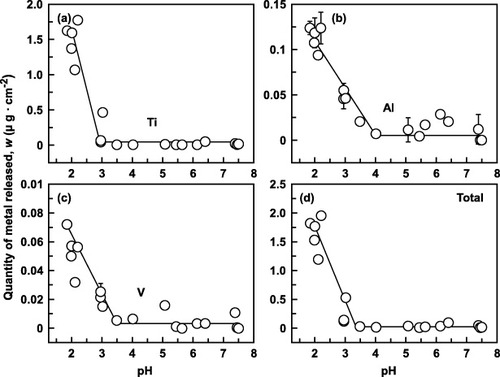
Figure 4 Effect of pH on the quantity of metal element released from Ti–15Zr–4Nb–4Ta alloy at 37 °C within 1 week: (a) Ti, (b) Zr, (c) Nb, (d) Ta and (e) total.
3.2. Anodic polarization properties
Figure shows the anodic polarization curves of Ti–6Al–4V and Ti–15Zr–4Nb–4Ta alloys tested in Ringer's solution, Eagle's medium and 0.9% NaCl. In the case of Ti–6Al–4V, the change in current density was small at a potential of 1.2V or lower, but started to increase at higher potentials. Meanwhile, the current density of the Ti–15Zr–4Nb–4Ta film did not increase until the potential reached 4V, revealing the higher strength and stability of passive film on Ti–15Zr–4Nb–4Ta than Ti–6Al–4V. In terms of polarization behavior, the Ti–15Zr–4Nb–4Ta alloy showed a passive zone nearly three times that of the Ti–6Al–4V alloy. Figure shows the polarization curves obtained from the test in 0.9% NaCl + HCl solutions with different pH values (0.8, 2 and 4). The current density of the Ti–6Al–4V passive films increased in the lower-pH solutions, whereas that of Ti–15Zr–4Nb–4Ta was less strongly affected by pH. The higher strength and stability of the passive film of Ti–15Zr–4Nb–4Ta were verified here as well. Figure shows the polarization curves obtained from the tests in 0.9% NaCl, 3.6% NaCl and 4.5% NaCl. The Cl concentration of the solutions had a very small effect on the curves, especially for Ti–15Zr–4Nb–4Ta.
Figure 5 Anodic polarization curves of (a) Ti–6Al–4V and (b) Ti–15Zr–4Nb–4Ta alloys in 0.9% NaCl, Ringer's solution and Eagle's medium at 37 °C.
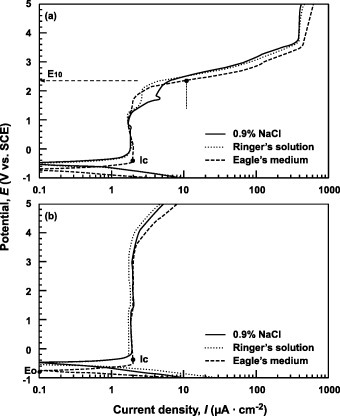
Figure 6 Effect of pH on anodic polarization curves of (a) Ti–6Al–4V and (b) Ti–15Zr–4Nb–4Ta alloys in 0.9% NaCl containing HCl (pH = 0.8, 2 and 4) at 37 °C.
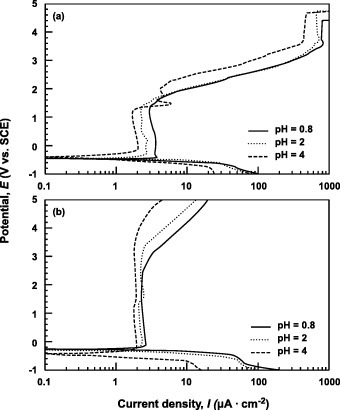
Figure 7 Effect of NaCl concentration on the anodic polarization curves of (a) Ti–6Al–4V and (b) Ti–15Zr–4Nb–4Ta alloys from 0.9 to 4.5% NaCl at 37 °C.
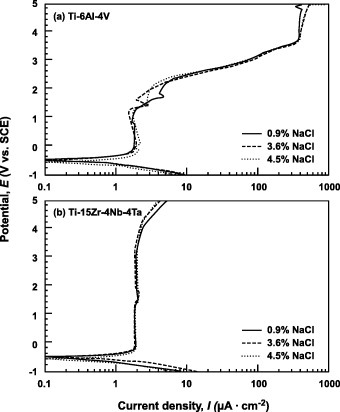
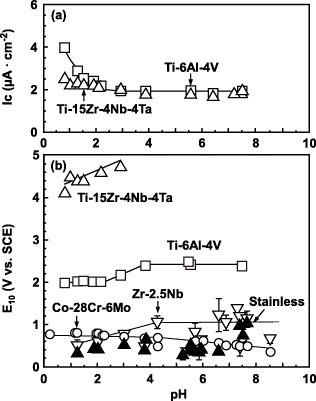
Figure shows the critical current density for passivation (Ic) and the potential (E10 versus SCE) at 10 μA cm−2 (refer figure ) estimated from the anodic polarization curves for the Ti–6Al–4V, Ti–15Zr–4Nb–4Ta, Zr–2.5Nb and Co–Cr–Mo alloys and stainless steel. The critical current density of the Ti–6Al–4V alloy gradually decreased with increasing pH and stabilized at 2 μA cm−2 above pH 3. On the other hand, the Ic of the Ti–15Zr–4Nb–4Ta alloy remained stable in the pH range from 1 to 8. The E10 of the Ti–15Zr–4Nb–4Ta alloy was within 4–5 V, twice higher than for the Ti–6Al–4V alloy, revealing that Ti–15Zr–4Nb–4Ta alloy had a more stable passive film. The E10 values of the Ti alloys were higher than those of the Co–Cr–Mo and Zr–2.5Nb alloys and stainless steel, showing that the passive films on the Ti alloys were stronger (figure (b)).
Figure 8 (a) Critical current density for passivation (Ic), and (b) potential at the current density of 10 μA cm−2 (E10) obtained from anodic polarization curves in various solutions with different pH values.
3.3. FE-TEM of the oxide film
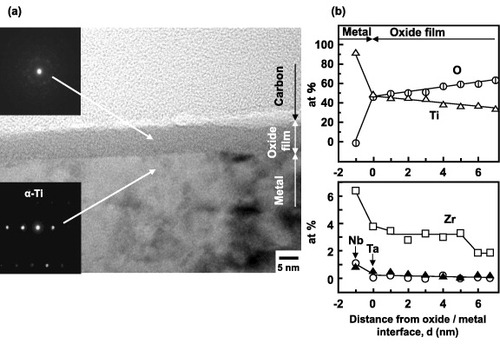
Figure shows an F-TEM image (a) and EDX analysis (b) results of the oxide film formed on the Ti–15Zr–4Nb–4Ta surface by anodic polarization up to 0.5 V versus SCE in Eagle's medium. An oxide film of approximately 7 nm thickness was observed on the alloy surface; it consisted of TiO2 containing Zr and small amounts of Nb and Ta elements, as shown in figure (b). The thickness of the oxide film increased from 4 up to 7 nm with an increase in anodic polarization potential from an open-circuit potential up to 0.5 V versus SCE in Eagle's medium (figure (a)).
Figure 9 (a) FE-TEM image and (b) EDX analysis of the oxide film formed on the Ti–15Zr–4Nb–4Ta alloy surface by anodic polarization up to 0.5 V versus SCE in Eagle's medium at 37 °C.
3.4. Analysis of the oxide film by ARXPS
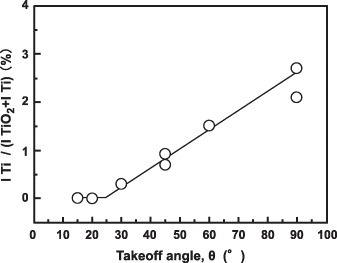
Qualitative analysis of the mirrorike-finished Ti–15Zr–4Nb–4Ta alloy surface was conducted using wide-range photoelectron spectra (takeoff angle θ = 90°). C, O, N, Ti, Si, Zr, Nb and Ta elements were detected. Figure shows the narrow-range spectra of the oxide film at takeoff angles of 20°, 45° and 90°. Ti in the oxide film was in the form of TiO2, and a small peak originating from the base metal was detected at θ = 45° and 90°. No Ti 2p peak was detected at θ = 20°. Figure shows the effect of θ on the integrated intensity ratio of the Ti 2p peaks [ITi/(I TiO2 + ITi)]. Zr in the oxide film was in the form of ZrO2, and a small peak originating from low-valence Zr was also detected at θ = 90°. Nb and Ta in the oxide film were in the form of Nb2O5 and Ta2O5, respectively. No Nb or Ta peaks were detected at θ = 20°, 45° or 90°. Thus, when Zr, Nb and Ta were added, the resultant ZrO2, Nb2O5 and Ta2O5 formed in the TiO2 passive film strengthened the film on the Ti alloy.
Figure 10 ARXPS spectra of an oxide film formed on the Ti–15Zr–4Nb–-4Ta alloy by anodic polarization up to 0.5 V versus SCE in Eagle's medium at 37 °C.
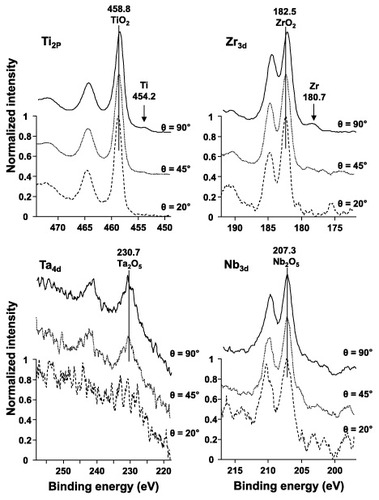
Figure 11 Effect of takeoff angle θ on the intensity ratio ITi /(ITiO2 + ITi) obtained by fitting the ARXPS spectra for the oxide film formed on the Ti–15Zr–4Nb–4Ta alloy surface by anodic polarization up to 0.5 V versus SCE in Eagle's medium at 37 °C.
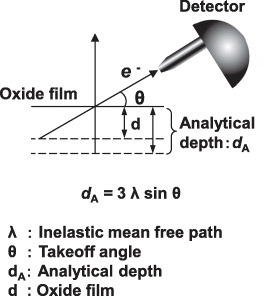
The principle of ARXPS is shown in figure . The analytical depth of the oxide film dA obeys the relation dA = 3λ sin θ [Citation21], where λ is the inelastic mean free path. It was calculated as 2.6 nm for TiO2 using the Tanuma-Powel-Penn-2M formula [Citation22], density 4.23 g cm−3 and electronic number 16. The band gap was taken as 3 eV, as the band gaps of anatase and rutile are 3.2 and 3 eV, respectively [Citation23]. The dA value was estimated at 8 nm, which is close to the thickness (7 nm) of the oxide film measured by FE-TEM (figure ).
Figure 12 Schematic of ARXPS.
3.5. Electrochemical impedance spectroscopy
3.5.1. Effects of sample surface area and solution.
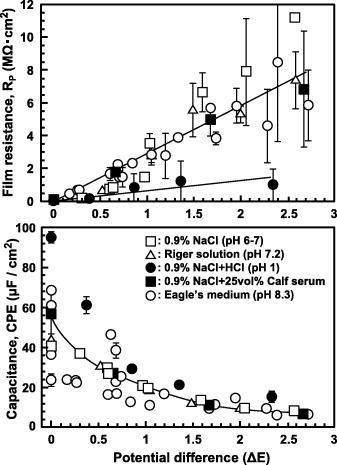
Figure shows the effects of the sample surface area on RS, RP and CPE. While CPE is proportional to the surface area, RS and RP are inversely proportional to it. The sample surface was taken as 1 cm2 to simplifying the calculations. Figures and show the effects of anodic polarization and the type of testing solution, respectively. The results shown in figure were measured using PARSTAT 2273 and ZSimpWin. As anodic polarization potential was increased from the open-circuit potential, the CPE of the oxide film linearly decreased, while its RP linearly increased. The RS of the Eagle's medium and the RP of the oxide film after anodic polarization and its CPE values were approximately 10–15 Ω cm2, 0.3–3.0 MΩ cm2 and 23–13 μF cm−2, respectively (figure ). The RP was lower in a solution with pH = 1 than in other solutions because of the weakening of the oxide film at low pH. The CPE values obtained in a solution of pH = 1 and in Eagle's medium were higher than those obtained in other solutions (figure ). The CPE value increases with decreasing pH because the oxide film becomes thinner at low pH. Also serum protein in the medium might affect the CPE value.
Figure 13 Effect of surface area on RS, RP and CPE of the oxide film formed on Ti–15Zr–4Nb–4Ta by anodic polarization up to 1.5 V versus SCE in 0.9% NaCl at 37 °C.
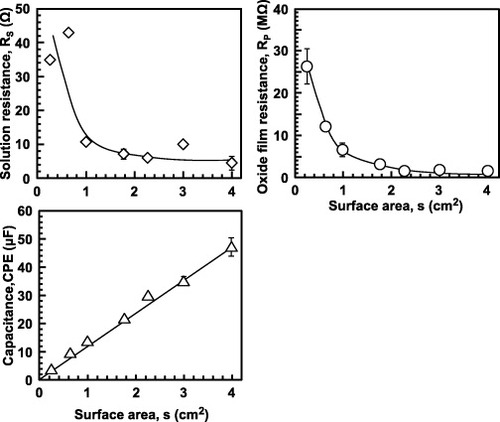
Figure 14 Effect of anodic potential on (a) thickness obtained by FE-TEM, (b) capacitance and (c) resistance (RP) of the oxide film formed on Ti–15Zr–4Nb–4Ta by anodic polarization in Eagle's medium at 37 °C.
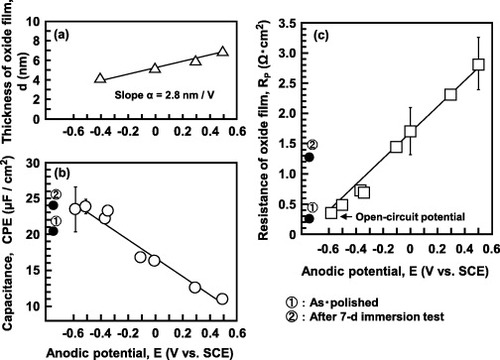
Figure 15 Effects of solution and potential difference between the open-circuit potential and anodic polarization potential (ΔE) on RP and CPE of the oxide film formed on Ti–15Zr–4Nb–4Ta by anodic polarization in various solutions at 37 °C.
3.5.2. Effect of material.
Figure shows the effects of the types of solution and material on RP and CPE of the oxide film formed by anodic polarization from an open-circuit potential to a potential of 0 V versus SCE. The RP of Ti–15Zr–4Nb–4Ta was the highest and the RP of stainless steel was the lowest among the five materials studied. The RP values of all the materials were higher in Eagle's medium than in 0.9% NaCl, and the CPE difference between Eagle's medium and 0.9% NaCl was small. CPE was proportional to the sample surface area; it linearly decreased with the oxide film thickness (figure ). CPE is given by the equation CPE = ε0εS/d, where ε0 is the vacuum permittivity (8.854 × 10⁻¹⁴ F cm–1), ε is the dielectric constant, S is the surface area in cm2 and d is the thickness of the oxide film in cm. d linearly increased with anodic polarization potential (ΔE = Ef-Eo) as d = do + α (Ef-Eo), where do is the thickness of the spontaneously grown oxide film, α is the anodization coefficient, Eo is the open-circuit potential and Ef is the end potential of anodic polarization. Dielectric constant was calculated using the film thickness (d = 7 nm = 7 × 10⁻⁷ cm), S = 1 cm2 and CPE (11 μF cm–2) measured from the oxide film formed on Ti–15Zr–4Nb–4Ta by anodic polarization up to 0.5 V versus SCE. The calculated ε (87) was close to that of rutile TiO2 (ε = 85.8) [Citation24].
Figure 16 Effects of solution and material on (a) RP and (b) CPE of the oxide film after anodic polarization up to 0 V versus SCE in 0.9% NaCl and Eagle's medium at 37 °C.
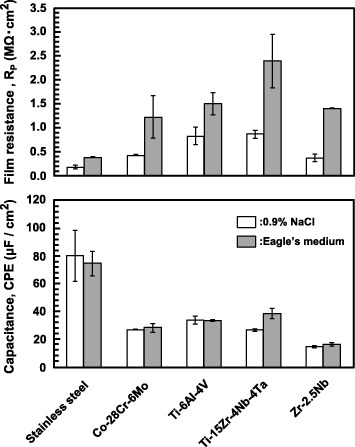
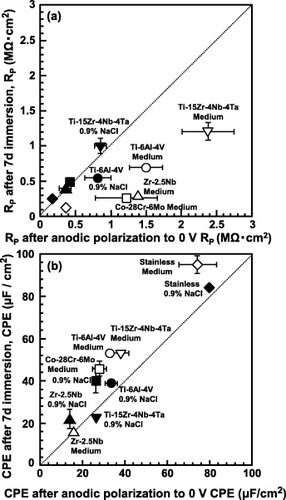
Figure compares the RP (a) and CPE (b) values measured after anodic polarization up to 0 V versus SCE (x-axis), and after a 7-day immersion in 0.9% NaCl and Eagle's medium (y-axis). The RP of the oxide film was determined by the anodic polarization from an open-circuit potential to 0 V versus SCE, similarly to that of the oxide film formed in the 7-day immersion test in 0.9% NaCl. In the comparison of the electrochemical properties among the materials, evaluation at 0 V versus SCE in anodic polarization in 0.9% NaCl was recommended from these results. Stainless steel, which has over 40 years of clinical use in the human body, has an RP of 0.2 MΩ in 0.9% NaCl. This means that materials with an RP of 0.2 MΩ or more in 0.9% NaCl can be used in the human body.
Figure 17 (a) RP and (b) CPE measured after anodic polarization up to 0 V versus SCE, and after 7-day immersion test in 0.9% NaCl and Eagle's medium at 37 °C.
4. Conclusions
We have analyzed the metal release from implantable metals and the composition of oxide films formed on alloy surfaces, focusing on the highly biocompatible Ti–15Zr–4Nb–4Ta alloy. The oxide film thickness and film resistance of this alloy were compared with those of other implantable materials. The quantity of metal ions released from this alloy after a 1-week immersion test was much lower compared with Ti–6Al–4V alloy, and it was rather small even under harsh conditions such as in a pH = 2 solution. In the high-potential region of the anodic polarization curve, a lower current density was observed for Ti–15Zr–4Nb–4Ta than Ti–6Al–4V. The potential E10 indicating a current density of 10 μA cm−2 was significantly higher in Ti–15Zr–4Nb–4Ta than Ti–6Al–4V and other materials revealing that the oxide film formed on Ti–15Zr–4Nb–4Ta is electrochemically robust. The oxide film had a thickness of a few nm and consisted mostly of TiO2. It contained small amounts of ZrO2, Nb2O5, and Ta2O5, which made the film electrochemically stable. The resistance (RP) of the film on Ti–15Zr–4Nb–4Ta was higher compared to the Ti–6Al–4V alloy, i.e., 0.9 Ω cm2 in 0.9% NaCl and 1.3 Ω cm2 in Eagle's medium. It was also approximately five times higher compared to stainless steel, which has a 0.2 Ω cm2 resistance and a history of more than 40 years of clinical use in the human body. In this study, we found that metallic materials for use in the human body should have an RP of 0.2 Ω cm2 and a higher film resistance in 0.9% NaCl. Thus, Ti–15Zr–4Nb–4Ta is expected to be a new material for long-term implantations, and its biological safety can be assessed via the E10 and RP parameters.
Acknowledgments
This study is partially funded by the Ministry of Economy, Trade, and Industry of Japan, as part of the ‘Program to support the collaboration between hospitals and businesses for the development and improvement of medical equipment and devices to solve unmet medical needs (supplementary budget, 2010FY).’
References
- SteinemannS G 1980 Evaluation of Biomaterials WinterG DLerayJ Lde GrootK New York Wiley p 1
- SteinemannS G 1999 Materials for Medical Engineering StallforthHRevellP Weinheim Wiley-VCH p 199
- OkazakiYItoYItoATateishiT 1993 Mater. Trans. JIM 34 1217
- OkazakiYRaoSAsaoSTateishiTKatsudaSFurukiY 1998 Mater. Trans. JIM 39 1053
- OkazakiYItoYItoATateishiT 1996 Medical Applications of Titanium and its Alloys: The Material and Biological Issues (ASTM STP 1272) BrownS ALemonsJ E West Conshohocken, PA ASTM p 45
- OkazakiYRaoSTateishiTItoY 1998 Mater. Sci. Eng. A 243 250 10.1016/S0921-5093(97)00809-5
- OkazakiYGotohEManabeTKobayashiK 2004 Biomaterials 25 5913 10.1016/j.biomaterials.2004.01.064
- OkazakiYGotohE 2009 Mater. Sci. Eng. C 31 325 10.1016/j.msec.2010.09.015
- Japanese Industrial Standards Committee 2009 JIS T 7401-4 Titanium Materials for Surgical Implant Applications Part 4: Wrought Titanium 15-Zirconium 4-Niobium 4-Tantalum alloy (Tokyo, Japan: Japanese Standards Association) p 1 (in Japanese)
- Technical Committee ISO/TC150 2004 ISO 5832-3 Implants for Surgery—Metallic Materials—Part 3: Wrought Titanium 6-Aluminium 4-Vanadium Alloy (Geneva, Switzerland: International Organization for Standard) p 1
- OkazakiY 2008 Mater. Trans. 49 817 10.2320/matertrans.MRA2007274
- Technical Committee ISO/TC150 2007 ISO 5832-1 Implants for Surgery—Metallic Materials—Part 1: Wrought Stainless Steel Geneva, Switzerland International Organization for Standard p 1
- ASTM Technical Committees 2005 F 2384 2005 Specification for Wrought Zirconium-2.5 Niobium Alloy for Surgical Implant Application Baltimore, MD Am. Soc. Testing Mater. p 1384
- Japanese Industrial Standards Committee 2002 JIS T 0304 Testing Method for Metal Release from Metallic Biomaterials (Tokyo, Japan: Japanese Standards Association) p 1 (in Japanese)
- Technical Committee ISO/TC150 ISO 16428 2005 Implants for Surgery—Test Solutions and Environmental Conditions for Static and Dynamic Corrosion Tests on Implantable Materials and Medical Devices (Geneva, Switzerland: International Organization for Standard) p 1
- Technical Committee ISO/TC150 ISO 16429 2004 Implants for Surgery—Measurements of Open-Circuit Potential to Assess Corrosion Behavior of Metallic Implantable Materials and Medical Devices over Extended Time Periods (Geenva, Switzerland: International Organization for Standard) p 1
- Japanese Industrial Standards Committee 2000 JIS T 0302 Testing Method for Corrosion Resistance of Metallic Biomaterials by Anodic Polarization Measurement (Tokyo, Japan: Japanese Standards Association) p 1 (in Japanese)
- KarimiSNickchiTAlfantaziA 2011 Corros. Sci. 53 3262 10.1016/j.corsci.2011.06.009
- HsuR WYangC CHuangC AChenY S 2004 Mater. Sci. Eng. A 380 100 10.1016/j.msea.2004.03.069
- FekryA M 2009 Electrochim. Acta 54 3480 10.1016/j.electacta.2008.12.060
- BriggsDRiviereJ C 1983 Practical Surface Analysis by X-ray Photoelectron Spectroscopy BriggsDSeahM P Chichester Wiley p 135
- TanumaSPowellC JPennD R 1993 Surf. Interface Anal. 21 165 10.1002/sia.740210302
- NakaiHHeydJScuseriaG E 2006 J. Comput. Chem. Japan. 5 7 (in Japanese) 10.2477/jccj.5.7
- Chemical Society of Japan ed 1984 Kagaku Binran Kisohen Kaitei II (Handbook of Chemistry 3rd edn) (Tokyo, Japan: Maruzen) II p 505 (in Japanese)