Abstract
Paper-based microfluidic devices have emerged as simple yet powerful platforms for performing low-cost analytical tests. This paper reports a microfluidic paper-based electrochemical biosensor array for multiplexed detection of physiologically relevant metabolic biomarkers. Different from existing paper-based electrochemical devices, our device includes an array of eight electrochemical sensors and utilizes a handheld custom-made electrochemical reader (potentiostat) for signal readout. The biosensor array can detect several analytes in a sample solution and produce multiple measurements for each analyte from a single run. Using the device, we demonstrate simultaneous detection of glucose, lactate and uric acid in urine, with analytical performance comparable to that of the existing commercial and paper-based platforms. The paper-based biosensor array and its electrochemical reader will enable the acquisition of high-density, statistically meaningful diagnostic information at the point of care in a rapid and cost-efficient way.
1. Introduction
Accurate detection of disease-relevant biomarkers plays a central role in control and treatment of diseases. However, existing advanced diagnostic technologies usually cannot meet various needs of medical care in developing countries, in the field, and in home healthcare settings, due to their dependence on sophisticated clinical infrastructure, long turnaround time and relatively high costs. To invent new technologies suitable for use at the point of care and/or in resource limited settings, microfluidic paper-based analytical devices (μPADs) have emerged as powerful diagnostic tools by virtue of their low cost, portability and ease of operation [Citation1–Citation5]. MicroPADs comprise single or multiple layers of paper substrates with hydrophilic paper channels patterned by hydrophobic materials, and can transport fluids autonomously for performing single- or multi-step analytical assays and quantifying concentrations of various analytes in human fluids (e.g. urine, serum and blood) [Citation6–Citation10].
In terms of detection method, colorimetric detection has been widely employed in many μPAD designs because of its simplicity and compatibility with camera-phone-based telemedicine [Citation6, Citation11–Citation13]; it is suitable for both qualitative and (semi-)quantitative tests. Electrochemical detection has also been popular in μPAD designs, and is more appealing due to its high accuracy and sensitivity [Citation14–Citation19]. Many electrochemical μPADs have been demonstrated with much lower limit of detection (LOD) than colorimetric assays. In addition, electrochemical detection is insensitive to ambient illumination conditions and impurities in the samples (e.g. dust and insoluble particulate), making it particularly suitable for use in field and/or dirty environments.
Existing electrochemical μPADs often work with a benchtop potentiostat for signal readout, and this bulky and expensive equipment makes it unfavorable to carry out electrochemical tests at the point of care and/or in resource-poor environments. Although portable potentiostats are also commercially available, their costs are still relatively high (> $1000) and thus less affordable in the developing world. To further reduce the equipment cost of electrochemical detection, both commercially available and custom-made solutions have been explored. An experimental strategy was proposed to integrate electrochemical μPADs with a glucose meter, which is a highly mature and inexpensive commercial electrochemical reader, to detect different types of analytes other than glucose [Citation20]. An inexpensive, open-source potentiostat, so called ‘CheapStat’, was also developed based on a microcontroller-based electronic circuit [Citation21]. This device is capable of carrying out various electrochemical protocols (e.g. cyclic voltammetry (CV), square-wave voltammetry and anodic stripping voltammetry) and providing sufficient performance in chemical and biomarker detections. Further research is needed to develop new types of μPADs to fully utilize this customizable platform and demonstrate portable paper-based electrochemical biosensing.
Both the glucose meter and the CheapStat represent fairly inexpensive and highly promising platforms for electrochemical detection on μPADs. However, these electrochemical readers only accommodate one paper sensor at a time, and repeated human operations (pipetting, signal reading and device exchanging) are needed while performing a large number of tests. This poses a practical hurdle in diagnoses involving large-volume tests of multiple biomarkers, for instance, clinical identification of unknown origin of a fever which may attribute to several possible diseases such as tuberculosis, HIV and mononucleosis. In response to the requirement for large-volume diagnostic tests using μPADs, we present a paper-based electrochemical biosensor array and a multiplexing electrochemical reader, both of which can work together to perform eight analytical tests automatically within a single run and thus greatly improve the throughput. Using the biosensor array, we demonstrate the simultaneous detection of three metabolic biomarkers with analytical performance comparable to existing commercial meters and paper-based platforms.
2. Materials and methods
2.1. Materials
Potassium ferricyanide, d-(+)-glucose, sodium l-lactate, uric acid, glucose oxidase (from Aspergillus niger, 147.9 U mg−1), lactate oxidase (from Pediococcus sp., ∼39 U mg−1), uricase (from Candida sp., >2 U mg-1), and chromatography paper (Whatman 1 Chr) were purchased from Sigma-Aldrich (Oakville, ON , Canada). All chemicals were used as received without further purification. An artificial urine (AU) solution was made according to a previously reported recipe [Citation15], which contained 1.1 mM lactic acid, 2.0 mM citric acid, 25 mM sodium bicarbonate, 170 mM urea, 2.5 mM calcium chloride, 90 mM sodium chloride, 2.0 mM magnesium sulfate, 10 mM sodium sulfate, 7.0 mM potassium dihydrogen phosphate, 7.0 mM dipotassium hydrogen phosphate and 25 mM ammonium chloride. All the chemicals were mixed in deionized water and the pH of this solution was adjusted to 6.0 with hydrochloric acid and sodium hydrate. Carbon ink (E3456) and silver ink (E1660) were purchased from Ercon (Wareham, MA). All electronic components for constructing the electrochemical reader were purchased from Mouser Electronics (Mansfield, TX), and printed circuit boards (PCBs) were fabricated through RushPCB Inc. (San Jose, CA).
2.2. Design and fabrication of the paper-based biosensor array
Figures (A) and (B) illustrate a microfluidic paper-based biosensor array and a handheld potentiostat for electrochemical signal readout. The paper-based device includes eight biosensing modules, which are used to quantify three metabolic biomarkers (i.e. glucose, lactate and uric acid) in AU. As shown in figure (B), each module includes a paper channel patterned with hydrophobic wax and three carbon electrodes (WE: working electrode; CE: counter electrode; and RE: reference electrode) screen-printed on the test zone of the paper channel. For the detection of glucose, lactate and uric acid, enzyme-catalyzed reactions were employed and corresponding enzymes and electron-transfer mediators were stored in the test zones to react with the analytes and produce electrical signals. The three electrodes are connected with screen-printed silver strips (figure (B)), and these silver strips serve as contact pads for electrically interfacing with metal clips on the PCB of the potentiostat.
Figure 1. A microfluidic paper-based electrochemical biosensor array that interfaces with a custom-made handheld potentiostat for multiplexed detection of metabolic biomarkers. (A) A paper-based electrochemical biosensor array (1 × 8). (B) A microcontroller-based multiplexing potentiostat mounted with a paper-based biosensor array. The potentiostat has eight measurement channels, and each channel is connected to a group of three sensing electrodes through metal clamps. CE: counter electrode. WE: working electrode. RE: reference electrode. (C) Schematic diagram of the potentiostat architecture with eight measurement channels. (D) A photograph of the paper-based biosensor array inserted into the potentiostat.
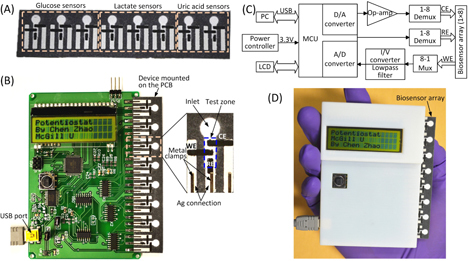
We fabricated paper channels on chromatographic paper using solid wax printing [Citation22], and carbon electrodes and silver strips on the surface of the paper device through screen printing [Citation20]. The patterns of microfluidic channels and electrodes were first laid out using AutoCAD. Base on the channel design, we printed wax patterns to define paper channels (un-printed areas) on chromatography paper (Whatman 1 Chr) using a commercial solid wax printer (ColorQube 8570, Xerox), and baked the printed paper on a hot plate at 150 °C for 1 min to allow the melted wax to vertically penetrate the paper substrate and form complete hydrophobic barriers of the channels. According to the designed patterns of electrodes and silver strips, screen-printing stencils were cut into vinyl stencil film (Grafix Frisket film) with a laser cutter (VersaLASER VLS2.30, Universal Laser Systems). Then, we taped the stencil on top of the wax paper, filled the laser-cut openings of the stencil with carbon or silver ink, and baked the paper device on a hot plate at 65 °C for 20 min until the ink dried. The whole fabrication process took an hour, and five 1 × 8 devices were typically fabricated from a single batch. Figure (A) shows a photograph of the paper-based biosensor array. The total material cost of the device is $0.02 (calculated based on commercial prices in small quantities).
2.3. Design of the potentiostat
A handheld inexpensive potentiostat that can interface with μPADs and carry out different electrochemical protocols will extend the electrochemical μPADs to on-site use. In this work, we developed an eight-channel potentiostat based on a similar circuit architecture to the CheapStat [Citation21]. Figures (B) and (C) show a photography and a schematic diagram of the potentiostat circuit respectively, where a low-power microcontroller (ATMEGA32, Atmel; with 12-bit A/D converters) serves as the core for generation of voltammetric excitations and acquisition of electrochemical signals. In contrast to the single-channel CheapStat [Citation21], we integrated a multiplexing mechanism into the circuit to allow automatic scanning of the eight electrochemical sensing components. We designed an insertable slot which can electrically connect the 24 electrodes of a 1 × 8 biosensor array device upon insertion, making the device connection fairly easy. Six measurement ranges of electrochemical currents (± 10 μA, ±60 μA, ±100 μA, ±400 μA, ±600 μA, and ±1 mA) can be adjusted via on-board jumpers, for accommodating various reactions that produce different levels of electrochemical currents. The smallest current measurement resolution is 35 nA with the measurement range of ±10 μA. In our current design, the microcontroller circuit is powered by a USB cable connected to a computer (figure (B)), through which the potentiostat can transmit acquired data to the computer for analysis. It is completely feasible to directly display the results on the LCD screen by implementing simple data analysis algorithms in the firmware of the microcontroller. In addition, a 3 V button battery can be integrated on the PCB to power the circuit, thus eliminate the USB connection and make the potentiostat completely portable. Figure (D) shows a photograph of the handheld potentiostat with a paper-based device inserted on the right side. The total cost of electronic components used to construct the potentiostat is ∼$90 (calculated based on commercial prices in small quantities).
2.4. Detection principles
As a proof-of-concept demonstration, we measured concentrations of d-glucose, l-lactate and uric acid in AU using chronoamperometry performed by the potentiostat on the biosensor array. Corresponding enzymes (i.e. glucose oxidase, lactate oxidase and uricase) and an electron-transfer mediator (potassium ferricyanide—K3[Fe(CN)6]) were stored in the test zones (figure (B)) of the eight biosensing modules in a dry form. To perform a test, a 4 μl drop of spiked AU sample was added to the inlet of each biosensing module, then wicked to the test zone and reacted with the stored reagents. During the reaction, the enzymes GOx (glucose oxidase), LOx (lactate oxidase) and UOx (uricase) catalyzed the oxidation of corresponding analyte into different species (glucose to gluconic acid, lactate to pyruvate and uric acid to allantoin), with a concomitant reduction of Fe(CN)6 3− into Fe(CN)6 4− (equations (Equation11 )–(Equation3
3 )). The generated Fe(CN)6 4− ions were quantified using chronoamperometry:
1
2
3
2.5. Device preparation
After device fabrication, test zones of the device were washed with 10 μl of alcohol to remove potential contaminants introduced during fabrication, and dried at room temperature. Before experiments, reagent mixtures of enzymes and the electron-transfer mediator (K3[Fe(CN)6]) were freshly prepared at the following concentrations: (i) 250 U ml−1 glucose oxidase in 600 mM K3[Fe(CN)6] and 1 M KCl; (ii) 50 U ml−1 lactate oxidase in 200 mM K3[Fe(CN)6] and 1 M KCl; and (iii) 27 U ml−1 uricase in 100 mM K3[Fe(CN)6] and 1 M KCl. Four microliter drops of particular reagent mixtures were added to the eight test zones of the device for detection of the three analytes. After being dried in a light-resistant incubator at 4 °C for 20 min, the device was ready for electrochemical detections.
3. Results and discussions
3.1. Electrochemical characterization of the paper-based biosensor array
Before applying the paper-based biosensor array to detection of the three analytes in AU, the electrochemical behavior of each biosensing module on the array device was experimentally characterized through CV using 10 mM K3[Fe(CN)6] in 1 M KCl as a model electroactive compound. In the experiments, a 6 μl drop of 10 mM K3[Fe(CN)6] in 1 M KCl was first added to the inlet of a biosensing module and reached the test zone by wicking. Upon the application of a CV wave, the Fe(CN)6 3− was reduced at the cathodic electrode and the resultant Fe(CN)6 4− was oxidized at the anodic electrode. We programmed the potentiostat to apply CV waves with six scan rates (50, 100, 200, 300, 400, and 500 mV s−1) to the working electrode (versus the graphite pseudo-reference electrode), and measured the generated currents in the measurement range of ±10 μA.
We acquired and analyzed the current-potential data on a computer connected with the potentiostat through the USB interface. Figure (A) shows a group of typical cyclic voltammograms at different scan rates, of which the ratio of cathodic peak current (ipc) and anodic peak current (ipa) is close to the unity (ipa/ipc = 1.0) for all the scan rates between 50 and 500 mV s−1. The peak shape of the cyclic voltammograms reveals a typical reversible (Nernstian) electrochemical reaction [Citation23].
Figure 2. Electrochemical characterization of the paper-based biosensor array. (A) Typical cyclic voltammograms of 10 mM K3[Fe(CN)6] in 1 M KCl solution in an electrochemical biosensing module of the array device at various scan rates. (B) A plot of the cathodic peak current ipc versus the square root of the scan rate ν1/2, measured from the cyclic voltammograms (n = 5).
![Figure 2. Electrochemical characterization of the paper-based biosensor array. (A) Typical cyclic voltammograms of 10 mM K3[Fe(CN)6] in 1 M KCl solution in an electrochemical biosensing module of the array device at various scan rates. (B) A plot of the cathodic peak current ipc versus the square root of the scan rate ν1/2, measured from the cyclic voltammograms (n = 5).](/cms/asset/2f1e78ec-2b2a-4964-941e-f4dcee24812c/tsta_a_11668632_f0002_oc.jpg)
Theoretically, the polarization overpotential (the difference between potentials at ipc and ipa) is for a n-electron-transfer process. For the redox-active couple of Fe(CN)6 3−/ Fe(CN)6 4−, the number of transferred electrons n = 1, giving an overpotential value of 57 mV. However, the polarization overpotential values measured from our devices ranged from 80 to 250 mV with shifts at the reduction and oxidation peaks. The shifting was attributed to the relative instability of the graphite pseudo-reference electrode in multiple CV scans. However, we observed that, when used at the first time, different biosensing modules in the same device and from different devices revealed fairly small variations in overpotential. The experimental data of measuring glucose, lactate and uric acid in AU (as presented in section 3.2), performed using fresh devices, also demonstrate reproducible analytical performance. Therefore, our paper-based biosensor arrays possess reliable biosensing capabilities for single-use diagnostic applications.
3.2. Multiplexed detection of glucose, lactate and uric acid
We used the biosensor array device and the handheld potentiostat for multiplexed quantification of three clinically relevant metabolic markers (glucose, lactate and uric acid) in AU using chronoamperometry. High levels of glucose in blood indicate diabetes, while low blood sugar, so called hypoglycemia, could mean metabolic disorders or complications of diabetes treatment. Altered concentrations of lactate in blood may result from liver diseases, sepsis or metabolic disorders, and lactate concentrations above 5 mM with severe metabolic acidosis predicts high morality [Citation24]. Excess accumulations of uric acid in the blood are linked to dyslipidemia, obesity and an increased risk for cardiovascular diseases [Citation25, Citation26].
On a biosensor array, we split the eight biosensing modules into three groups for detecting the three markers. For instance, we could utilize three biosensing modules for glucose detection, three modules for lactate detection and two modules for uric acid detection (figure (A). We chose chronoamperometry for analyte detection because it offers better accuracy and sensitivity and is easier to implement than other electrochemical techniques [Citation14, Citation15]. We applied a 500 mV step potential to the working electrode (versus the graphite pseudo-reference electrode), and monitored the resulting current as a function of time. We found that, for the current device design, the initial high charging current decayed to a steady state within 90 s after applying the step potential. Thus, we measured the steady-state Faradaic current by taking the average of currents measured in 90–100 s post-step-potential for all the three markers. The measured Faradaic current is proportional to the concentration of target analyte, which can be described by the Cottrell equation [Citation23].
In the experiments, we set all the channels of the potentiostat with a measurement range of ±10 μA. We prepared AU samples spiked with glucose (0–20 mM), lactate (0–25 mM) and uric acid (0–10 mM) to generate the calibration data, and these concentration ranges covered the possible levels of the three markers in urine. To start a test on a 1 × 8 biosensor array, we first inserted the device into the device slot of the potentiostat, then added 4 μl drops of spiked AU to the eight inlets on the biosensor array, waited for 2 min to allow the sample to thoroughly react with the pre-loaded reagents, and finally applied the 500 mV step potential and measured the chronoamperometric curves of current versus time. Figures – illustrate (A) groups of typical chronoamperometric curves and (B) calibration plots for measurement of glucose, lactate and uric acid in AU, demonstrating a linear relationship between the measured current and the analyte concentration for all the three markers. The LOD was calculated to be the concentration that generated a current three times the standard deviation of currents measured in zero-concentration AU. Table summarizes the analytical performance of the biosensor array device. The LOD values of our device for glucose (0.35 mM), lactate (1.76 mM) and uric acid (0.52 mM) were found to be comparable to these of commercial meters (glucose: 0.83 mM, lactate:1.1 mM) and paper-based platforms (glucose: 0.21 mM, lactate: 0.36 mM, and uric acid: 1.38 mM). The linear dynamic ranges of our device cover the possible clinically relevant levels of all the three markers in urine. These results prove the sufficient biosensing capability of our device for quantitative detection of the three metabolites. We believe that this paper-based device and its portable potentiostat will also be useful for performing electrochemical detection of other biomarkers in human fluids (e.g. antigens/antibodies, virus and DNA segments), and chemicals/pollutants in environmental samples (e.g. heavy metal ions, bacteria and toxins).
Figure 3. (A) Chronoamperometric curves and (B) the calibration plot for measurement of glucose in AU. The solid line in (B) represents a linear fit to experimental data with regression equation: y = 0.041x + 0.054 (R2 = 0.996, n = 5).
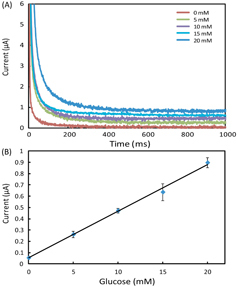
Figure 4. (A) Chronoamperometric curves and (B) the calibration plot for measurement of lactate in AU. The solid line in (B) represents a linear fit to experimental data with regression equation: y = 0.0076x + 0.025 (R2 = 0.995, n = 5).
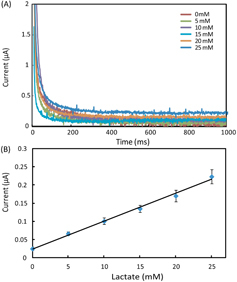
Figure 5. (A) Chronoamperometric curves and (B) the calibration plot for measurement of uric acid in AU. The solid line represents a linear fit to experimental data with regression equation: y = 0.048x + 0.029 (R2 = 0.994, n = 5).
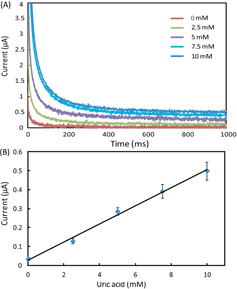
Table 1. Performance comparison of the paper-based biosensor array with commercial meters [Citation20] and μPAD in [Citation14].
4. Conclusion
In this work, we developed a microfluidic paper-based electrochemical biosensor array (1 × 8) capable of performing diagnostic tests of multiple biomarkers in a multiplexing and high-throughput fashion. We also designed and constructed an inexpensive, compact potentiostat to interface with the paper-based biosensor array for electrochemical signal readout. The paper-based device and the potentiostat formed a portable, self-contained, easy-to-operate electrochemical biosensing platform, which is particularly useful for low-cost, point-of-care diagnostic applications. As a proof of concept, we used the biosensor array for multiplexed detection of three metabolic biomarkers (glucose, lactate and uric acid). The experimental results demonstrated that our device provides analytical performance (LOD and dynamic linear range) sufficient for clinical assays of all the three markers. This paper-based biosensing platform will find important applications in point-of-care diagnosis and on-site environmental testing.
Acknowledgments
This work was supported by Grand Challenge Canada (through a Star in Global Health Award), Natural Sciences and Engineering Research Council of Canada, Canadian Foundation for Innovation, Canadian Research Chairs Program, and McGill University.
References
- MartinezA WPhillipsS TWhitesidesG MCarrilhoE 2010 Diagnostics for the developing world: microfluidic paper-based analytical devices Analy. Chem. 82 3 10 3–10 10.1021/ac9013989
- ParoloCMerkociA 2013 Paper-based nanobiosensors for diagnostics Chem. Soc. Rev. 42 450 457 450–7 10.1039/c2cs35255a
- LiXBalleriniD RShenW 2012 A perspective on paper-based microfluidics: Current status and future trends Biomicrofluidics 6 011301 10.1063/1.3687398
- AbeKSuzukiKCitterioD 2008 Inkjet-printed microfluidic multianalyte chemical sensing paper Analy. Chem. 80 6928 6934 6928–34 10.1021/ac800604v
- ZuoPLiXDominguezD CYeB-C 2013 A PDMS/paper/glass hybrid microfluidic biochip integrated with aptamer-functionalized graphene oxide nano-biosensors for one-step multiplexed pathogen detection Lab Chip 13 3921 3928 3921–8 10.1039/c3lc50654a
- MartinezA WPhillipsS TButteM JWhitesidesG M 2007 Patterned paper as a platform for inexpensive, low-volume, portable bioassays Angew. Chem. Int. Edn Engl. 46 1318 1320 1318–20 10.1002/anie.200603817
- MartinezA WPhillipsS TWhitesidesG M 2008 Three-dimensional microfluidic devices fabricated in layered paper and tape Proc. Natl Acad. Sci. USA 105 19606 19611 19606–11 10.1073/pnas.0810903105
- LiXTianJNguyenTShenW 2008 Paper-based microfluidic devices by plasma treatment Analy. Chem. 80 9131 9134 9131–4 10.1021/ac801729t
- YanJYanMGeLYuJGeSHuangJ 2013 A microfluidic origami electrochemiluminescence aptamer-device based on a porous Au-paper electrode and a phenyleneethynylene derivative Chem. Commun. 49 1383 1385 1383–5 10.1039/c2cc37402a
- LiuX Y et al 2011 A portable microfluidic paper-based device for ELISA 2011 IEEE 24th Int. Conf. on Micro Electro Mechanical Systems (MEMS) 75 78 pp 75–8
- MartinezA WPhillipsS TCarrilhoEThomasS W, IIISindiHWhitesidesG M 2008 Simple telemedicine for developing regions: camera phones and paper-based microfluidic devices for real-time, off-site diagnosis Anal. Chem. 80 3699 3707 3699–707 10.1021/ac800112r
- DungchaiWChailapakulOHenryC S 2010 Use of multiple colorimetric indicators for paper-based microfluidic devices Anal. Chim. Acta. 674 227 233 227–33 10.1016/j.aca.2010.06.019
- LiX YZwanenburgPLiuX 2013 Magnetic timing valves for fluid control in paper-based microfluidics Lab Chip 13 2609 2614 2609–14 10.1039/c3lc00006k
- DungchaiWChailapakulOHenryC S 2009 Electrochemical detection for paper-based microfluidics Anal. Chem. 81 5821 5826 5821–6 10.1021/ac9007573
- NieZ H et al 2010 Electrochemical sensing in paper-based microfluidic devices Lab Chip 10 477 483 477–83 10.1039/b917150a
- ZangD JGeLYanMSongX RYuJ H 2012 Electrochemical immunoassay on a 3D microfluidic paper-based device Chem. Commun. 48 4683 4685 4683–5 10.1039/c2cc16958d
- LiX JNieZ HChengC-MGoodaleA BWhitesidesG M 2010 Paper-based electrochemical ELISA Int. Conf. on Miniaturized Systems for Chemistry and Life Sciences 2010 Groningen, The Netherlands 1487 1489 pp 1487–9
- GeSGeLYanMSongXYuJHuangJ 2012 A disposable paper-based electrochemical sensor with an addressable electrode array for cancer screening Chem. Commun. 48 9397 9399 9397–9 10.1039/c2cc34887j
- ZangDYanMGeSGeLYuJ 2013 A disposable simultaneous electrochemical sensor array based on a molecularly imprinted film at a NH2-graphene modified screen-printed electrode for determination of psychotropic drugs Analyst 138 2704 2711 2704–11 10.1039/c3an00109a
- NieZDeissFLiuX YAkbulutOWhitesidesG M 2010 Integration of paper-based microfluidic devices with commercial electrochemical readers Lab Chip 10 3163 3169 3163–9 10.1039/c0lc00237b
- RoweA A et al 2011 CheapStat: an open-source, “Do-It-Yourself” potentiostat for analytical and educational applications PLoS ONE 6 e23783 10.1371/journal.pone.0023783
- CarrilhoEMartinezA WWhitesidesG M 2009 Understanding wax printing: a simple micropatterning process for paper-based microfluidics Anal. Chem. 81 7091 7095 7091–5 10.1021/ac901071p
- BardA JFaulknerL R 2000 Electrochemical Methods: Fundamentals and Applications. New York Wiley
- PhypersBPierceJ T 2006 Lactate physiology in health and disease Contin. Educ. Anaesthesia Crit. Care Pain 6 128 132 128–32 10.1093/bjaceaccp/mkl018
- KutzingM KFiresteinB L 2008 Altered Uric Acid Levels and Disease States J. Pharmacol. Exp. Therap. 324 1 7 1–7 10.1124/jpet.107.129031
- FangJAldermanM H 2000 Serum uric acid and cardiovascular mortality J. Am Med. Assoc. 283 2404 2410 2404–10 10.1001/jama.283.18.2404