Abstract
Because of its excellent biocompatibility and low allergenicity, titanium has been widely used for bone replacement and tissue engineering. To produce a desirable composite with enhanced bone response and mechanical strength, in this study bioactive calcium phosphate (CaP) and gelatin composites were coated onto titanium (Ti) via a novel urease technique. The cellular responses to the CaP/gelatin/Ti (CaP/gel/Ti) and bone bonding ability were evaluated with proliferation and osteogenic differentiation of mesenchymal stem cells (MSCs) on CaP/gel/Ti and CaP/Ti in vitro. The results showed that the optical density values, alkaline phosphatase expression and genes expression of MSCs on CaP/gel/Ti were similar to those on CaP/Ti, yet significantly higher than those on pure Ti (p < 0.05). CaP/gel/Ti and CaP/Ti rods (2 mm in diameter, 10 mm in length) were also implanted into femoral shaft of rabbits and pure Ti rods served as control (n = 10). Histological examination, scanning electron microscopy (SEM) and energy dispersive spectroscopy (EDS) measurements were performed at 4 and 8 weeks after the operation. The histological and SEM observations demonstrated clearly that more new bone formed on the surface of CaP/gel/Ti than in the other two groups at each time point. The CaP/gel/Ti bonded to the surrounding bone directly with no intervening soft tissue layer. An interfacial layer, containing Ti, Ca and P, was found to form at the interface between bone and the implant on all three groups by EDS analysis. However, the content of Ca, P in the surface of CaP/gel/Ti implants was more than in the other two groups at each time point. The CaP/gel/Ti modified by the urease method was not only beneficial for MSCs proliferation and osteogenic differentiation, but also favorable for bone bonding ability on Ti implants in vivo, suggesting that Ti functionalized with CaP and gelatin might have a great potential in clinical joint replacement or dental implants.
1. Introduction
Titanium (Ti) and its alloys are the most popular materials used for orthopedic implants owing to their good mechanical and chemical properties, biocompatibility, corrosion resistance and low allergenicity [Citation1]. However, Ti and its alloys lack the ability to bond directly to living bone. In skeletal bones, smooth Ti implants usually tend to be encapsulated by fibrous tissue and show only weak bonding to bone in animal experiments, even under unloaded conditions [Citation2–Citation4].
In order to improve the integration of an implant into bone, methods of coating the Ti surface with several bioactive materials have been developed [Citation5–Citation7]. Modification of the surface of an implant can shorten the time required for osseointegration. Among the various kinds of bioactive materials coatings, hydroxyapatite (HA) coated Ti is one of the most widely investigated orthopedic implants [Citation8]. In addition, the high osseoconductivity of HA coated Ti is well documented both experimentally and clinically [Citation9–Citation11].
As HA consists of calcium (Ca) and phosphate (P), and Ca, P and collagen are the main constituents of natural bone, it is naturally considered that the concurrent coating of collagen/HA or collagen/CaP layers would give good bioactivity to any substrate. The extracellular matrix (ECM) plays an important role in cell function and tissue regeneration by providing specific signals to cells [Citation12]. Hence the composition comprising of CaP and polymers (collagen and gelatin) has great potential as its composition is similar to the ECM of bone tissue.
Gelatin is a denatured form of collagen and has been clinically applied as a temporary defect filler and wound dressing because of its excellent biodegradability and biocompatibility [Citation13]. It has been reported that many organic–inorganic composites, such as collagen–HA and synthetic polyesters–HA, have combined advantages over each pure component [Citation14–Citation16]. Hence, a composite approach of the two components, gelatin and CaP, has the potential to be a good coating biomaterial of Ti.
The present authors propose another fabrication process of gelatin/CaP, in which gelatin is covalently bonded to the substrate, not physical adsorption, and CaP is coated on the top by the mediation of urease. We hypothesize that the novel urease fabrication method could promote the osteogenic differentiation of stem cells and increase the bone-bonding ability of the CaP/gel/Ti implant. The biological effects of CaP/gel/Ti on mesenchymal stem cells (MSCs) in vitro and the effects of CaP/gel/Ti on bone regeneration and osseointegration of bone–implant interface on rabbit model are investigated.
2. Materials and methods
2.1. Preparation of CaP and CaP/gel coated Ti samples
Type B gelatin (sigma) from bovine skin was used. The gelatin of 5% (w/v) was added to distilled water and stirred at 40 °C for 1 h. The commercial Ti plates (2 × 2 cm2) and Ti rods (diameter 2 mm, height 10 mm) were polished with sandpaper (#700), cleaned in acetone and ethanol/water, and dried at 40 °C for 24 h. Then, the Ti plates were immersed in an ethanol solution of 20 wt% aminopropyl triethoxysilane (APTS, Shin-Etsu Chemical Co., Ltd) for 24 h at room temperature before being dried at 400 K for 30 min to functionalize the surfaces with amino (− NH2) groups. The plates and rods were transferred to an aqueous solution containing 3.0 g l−1 of water-soluble carbodiimide (1-ethyl-3-(3-dimethylaminopropyl)carbodiimide hydrochloride, denoted as WSC, DOJINDO Laboratories) and 200 mg l−1 of gelatin (RM-100B, kind gift from JELLICE Co., Ltd) at 310 K for 24 h to covalently bond gelatin to titanium surfaces through amide (–NH–CO–) bonds. After the gelatin coating, the gelatin-coated Ti were modified with urease by immersion in a solution containing 600 mg l−1 of urease (KANTO CHEMICAL Co., Inc., 5000 U g−1, from Jack bean) and 3.0 g l−1 of WSC at 310 K for 24 h. Then, the urease-bearing Ti samples were transferred to a solution containing 10 mmol l−1 of Ca(NO3)2, 6 mmol l−1 of NH3H2PO4 and 110 mmol l−1 of urea, whose pH was adjusted to 5.8 with ammonia, at 310 K for 1 h. During the last step, urea was enzymatically hydrolyzed to ammonia in the vicinity of the surfaces of the discs and rods, and a CaP layer was precipitated preferentially on the samples and pure Ti. The resultant Ti samples coated with CaP alone, and gelatin and CaP are referred to as ‘CaP/Ti’ and ‘CaP/gel/Ti’, respectively.
2.2. Evaluation of microstructure
The surface and cross-section of CaP/gel/Ti were observed by scanning electron microscopy (SEM) (S-4700, Hitachi Co., Japan). The microstructure, shape and roughness of CaP layer were studied by atomic force microscopy (AFM; SPA 400, NSK Ltd, Japan).
2.3. Total protein adsorption
The sample plates of each group were immersed in a fetal bovine serum (FBS) containing 0.02% sodium azide at room temperature to determine the total protein adsorption on the sample surface. After immersion for 7 days the plates were gently washed with water. Then the coated layer of the Ti was dissolved with 100 μl of an HCl solution (pH = 2) for 10 min to retrieve the protein adsorbed on the surface. After collecting the HCl solution with a micropipette, fresh HCl solution was again placed on the sample surface. This process was repeated four times to collect all proteins adsorbed on the surface of coated Ti. The concentration of total protein in the collected HCl solution was determined with a BCA™ Protein Assay Kit (Nanjing Jiancheng Bio-engineering Co., Ltd, Nanjing, China) according to the manufacturer's instructions. The total amount of protein adsorbed on the CaP/Ti, CaP/gel/Ti and pure Ti plates was determined using a standard curve drawn with bovine serum albumin and was normalized to the area of each sample surface.
2.4. Mesenchymal stem cells (MSCs) isolation and culture
Bone marrow-derived MSCs of rabbits were isolated and cultured as previously reported [Citation17]. Briefly, BMSC were aspirated from the bone marrow, gradient centrifuged and plated into flasks containing Dulbecco's modified Eagle's medium (DMEM) low glucose (Gibco) containing 10% FBS (Gibco) and 1% antibiotics (100 U ml−1 penicillium and 100 U ml−1 streptomycin). After culturing for 48 h, the medium was removed and fresh medium was added to each flask. Cells were maintained at 37 °C in a humid atmosphere with 5% CO2 and the medium was changed every 2 days. Only passage two to four cultures were used for all the experiments.
2.5. MSCs culture on Ti samples
Cell culture medium consisted of DMEM low glucose (Gibco) supplemented with 10% FBS and 1% penicillin/streptomycin antibiotics. Cells were cultured in an incubator at 37 °C with 5% CO2, and the medium was changed every two days. The cultures were passaged with 2.5 g l−1 trypsin containing 1 mmol l−1 EDTA (Gibco). Cultures of 90% confluent cells were trypsinized, washed and suspended in fresh medium. MSCs were seeded onto CaP/Ti, CaP/gel/Ti and pure Ti plates at the density of 5 × 10⁴ cells sample−1. The response of MSCs was evaluated by determining cell proliferation, alkaline phosphatase (ALP) activity and osteogenic genes expression of the MSCs.
2.6. Cell proliferation
The proliferation of MSCs cultured on each group was evaluated by measuring the DNA content of MSCs on the surface of Ti plates after 1, 3 and 7 days of culture. Three samples per time point were stored in ddH2O at −20 °C until the assay was performed. For DNA content assay, the frozen samples with cells were thawed at room temperature and homogenized in 1 ml lysis buffer (50 mM Tris/HCl, pH7.6, 0.1% (v/v) Triton X-100). The lysate was assayed for DNA content using a fluorescent dye Hoechst 33258. Briefly, the lysate was sonicated on ice for 30 s and vortexed for 5–10 s. After centrifugation, the supernatant was collected. Standards of calf thymus DNA were prepared in the range from 0 to 30 μg ml−1. TNE buffer (10 mM Tris base, 1 mM EDTA and 200 mM NaCl) was added to each well of a 96-well plate at 50 μL well−1. Then, 50 μl standards and samples were added to each well in triplicate. Then, 100 μl Hoechst 33258 dye solution (1 μg ml−1) was added to each well. Finally, the plate was incubated for 10 min in the dark at room temperature, and then read on a Auto Microplate Reader (Infinite M200, Tecan, Austria; Ex350 nm/Em450 nm). Cell number was determined by correlating DNA with a known amount of cells. Samples were run in triplicate and compared against calf thymus DNA standards.
2.7. Alkaline phosphatase expression
The functional activity of MSCs on Ti, CaP/Ti and CaP/gel/Ti was examined by measuring the ALP activity expressed by the cells [Citation18]. After culturing for 7 and 14 days in osteogenic medium (high glucose DMEM containing 10% FBS, 50 mM of ascorbic acid 2-phosphate, 10 mM of b-glycerol phosphate and 100 nM of dexamethasone), the cell-grown Ti plates were washed with PBS, followed by adding a cell lysis buffer containing 0.2% Triton X-100 to the samples and freezing to −20 °C. The frozen samples were thawed at 37 °C for 5 min in order to measure the ALP activity following the manufacturer's instructions (Nanjing Jiancheng Bio-engineering Co., Ltd, Nanjing, China). For the assay, samples were normalized considering the total protein content, which were obtained using a BCA™ Protein Assay Kit (Nanjing Jiancheng Bio-engineering Co., Ltd, Nanjing, China). The ALP activity was measured colorimetrically using p-nitrophenyl phosphate as a substrate.
2.8. Cell differentiation
MSCs were seeded on Ti, CaP/Ti or CaP/gel/Ti plates (5 × 10⁴ cells well−1) in osteogenic medium supplemented with 1% (v/v) penicillin/streptomycin. After culturing for 14 days, the differentiation of MSCs was analyzed. Total cellular RNA was extracted from cultured MSCs by Trizol (Invitrogen, USA). cDNA synthesis was prepared by M-MLV (Promega, USA). Here the gene expression levels of bone collagen type I, osteocalcin (OCN) and ALP were determined following the procedures described previously [Citation19]. 18S rRNA was used as an internal control. Primers for target genes and the internal control gene are listed in table .
Table 1. Nucleotide primers used for qRT-PCR.
2.9. Animal model
Eighteen male New Zealand rabbits weighing an average of 3 kg were obtained from a licensed vendor (School of Medicine, Zhejiang University, Hangzhou, China). The animal experiment was approved by the local Animal Care Committee of Zhejiang University. The rabbits were anesthetized via an intravenous injection of ketamine hydrochloride (60 mg kg−1) and xylazine (6 mg kg−1), and were placed in the supine position. A straight incision was made in the area of the rabbit's femur. Superficial fascia and periosteal membrane were incised using a sharp dissection to expose bone surface. A bicortical hole of 2 mm in diameter was created in both femur of the rabbit using a stainless steel drill of 2 mm diameter. The sample rods (diameter 2 mm, height 10 mm) were seated using finger pressure and gently tapped into the space of the hole, followed by closing the skin with nylon suture. A total of 36 implants, with twelve samples in each group, were randomly inserted into the rabbit's femurs. Nine rabbits were sacrificed after the implantation of 4 weeks and the other nine rabbits after 8 weeks.
2.10. Histological examinations
For observation of the interface between bone and implant, three specimens at each time periods in each group were immediately fixed in 4% formaldehyde solution, dehydrated in graded ethanol solution (75, 95 and 100%, increasing every 3 days) and then embedded in polymethyl methacrylate resin and cut into 5 μm sections along the long axis of the implants using a diamond blade. The sections obtained were mounted in epoxy resin and were polished for Masson's trichrome staining.
2.11. Pull-out test
The pull-out test was performed on the other three implants of each group at each time point using a universal testing system (Shimadzu, AGS-10kNG, Japan). A force was applied to the implant to pull the implant vertically out at a constant crosshead speed of 1 mm min−1. The load-displacement curve was recorded for the measurement of the maximum pull-out force.
2.12. Scanning electron microscopy and EDS microanalysis
For observation of the surface of the implants, the specimens were washed in a sodium hypochlorite solution immediately after the pull-out test to remove the soft tissue, fixed in 10% phosphate-buffered formalin for 3 days, dehydrated in serial concentrations of ethanol (70, 80, 90, 99, 100 and 100% v/v) for 1 day each, then soaked in an isopentyl acetate solution for 1 day and dried in a critical point dryer (HCP-2, Hitachi Koki Co., Ltd, Tokyo, Japan). Specimens were then coated with gold by sputtering and visualized by SEM (S-4700, Hitachi Co., Japan); compositional analysis was measured by energy dispersive spectrometer (EDS). The remaining femoral defects were fixed in 10% neutral buffered-formalin, decalcified and embedded in paraffin. Tissue blocks were sectioned at 7 μm in thickness and stained with hematoxylin and eosin (H&E), then observed in an optical microscope (Olympus, Japan).
2.13. Statistical analysis
Data are expressed as means ± standard deviation (SD) and were examined by one-way analysis of variance (ANOVA). All pair-wise comparisons were performed using least significant difference tests. A p-value <0.05 was deemed to indicate statistical significance.
3. Results
3.1. Microstructure of CaP/gel/Ti
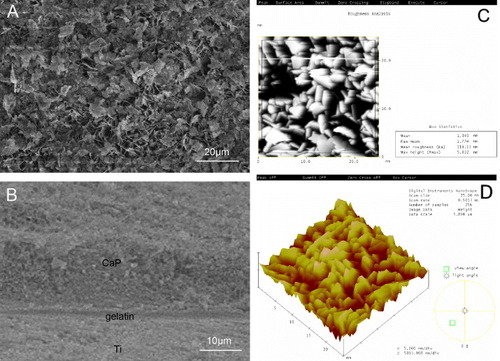
Figure (A) shows the surface of CaP/gel/Ti. Figure (B) shows a cross-sectional SEM image of CaP/gel/Ti, in which there are three layers of materials: the first layer is CaP, the second layer is gelatin and the third layer is Ti. As demonstrated in figure (B), these three layers have no cavities or microcracks. The thickness of the CaP/gelatin layer was approximately 25 μm. Figure (C) shows the AFM roughness analysis of the frame region. The mean roughness of the CaP/gel/Ti surface was 118 nm. Figure (D) shows the three-dimensional (3D) image of the CaP/gelatin layer which provided an intuitive view of the morphology of the CaP/gelatin layer.
Figure 1. SEM observation of the surface (A) and cross-section (B) of CaP/gel/Ti implants. AFM image of roughness analysis (C) and 3D image (D) of the CaP/gel layer.
3.2. Protein adsorption on the coated Ti surface
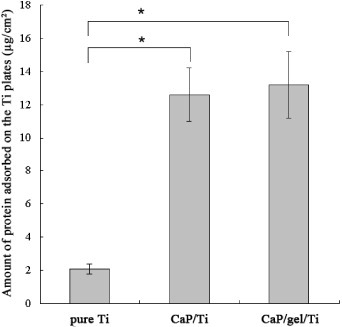
Figure shows the total amount of protein adsorbed on the surface of pure Ti, CaP/Ti and CaP/gel/Ti plates. The amount of protein adsorbed on the CaP/gel/Ti substrates was higher than that on CaP/Ti, and was significantly higher than that on the pure Ti surface (p < 0.05).
Figure 2. The total amount of protein adsorbed on the surface of pure Ti, CaP/Ti and CaP/gel/Ti plates. The amount of protein adsorbed on the CaP/gel/Ti surface was significantly higher than that on the pure Ti surface (p < 0.05).
3.3. Cell proliferation
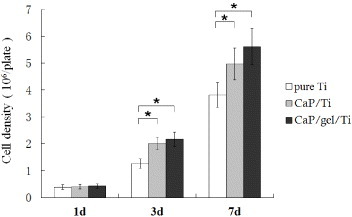
The proliferation of cells on the Ti plates was evaluated by determining the double-stranded DNA content (figure ). After the static culture for 1 day, the cell density on pure Ti, CaP/Ti and CaP/gel/Ti plate was detected as (0.38 ± 0.09) × 105, (0.40 ± 0.09) × 105 and (0.42 ± 0.08) × 105 cells plate−1, respectively. The cell density of MSCs on the CaP/gel/Ti plate increased and reached a cell density of (2.2 ± 0.3) × 105 cells plate−1 at day 3 and (5.6 ± 0.7) × 105 cells plate−1 at day 7, both were higher than that of CaP/Ti with (2.0 ± 0.2) × 105 at day 3 and (5.0 ± 0.6) × 105 cells plate−1 at day 7, respectively, and were significantly higher than that of pure Ti, which was (1.3 ± 0.2) × 105 cells plate−1 at day 3 and (3.8 ± 0.5) × 105 cells plate−1 at day 7 (p < 0.05).
Figure 3. Proliferation of MSCs on the surface of pure Ti, CaP/Ti and CaP/gel/Ti plates after culturing for 1, 3 and 7 days. The cell density on plates and the cell proliferation were evaluated by determining the double-stranded DNA (dsDNA) content. All the experiments were conducted independently (n = 3). Error bars represent SD. ∗: P < 0.05.
3.4. Cell differentiation
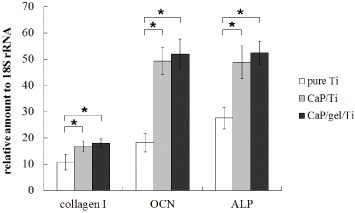
Figure shows the ALP activity expressed by MSCs on the pure Ti, CaP/Ti and CaP/gel/Ti plates after culturing for 7 and 14 days. The ALP activity of MSCs on the CaP/gel/Ti plates in osteogenic medium was slightly higher than that on the CaP/Ti plates, and was significantly higher than that on the pure Ti plates both at 7 and 14 days (p < 0.05). Moreover, the expression levels of collagen I, ALP and OCN of MSCs on the CaP/Ti and CaP/gel/Ti plates were similar and significantly higher than those on pure Ti at 14 days after culture (p < 0.05) (figure ).
Figure 4. ALP activity of MSCs on the Ti, CaP/Ti and CaP/gel/Ti plates after culturing for 7 and 14 days, with units of (nmol s−1)/(mg protein). Each value is mean ± SD. ∗: P < 0.05.
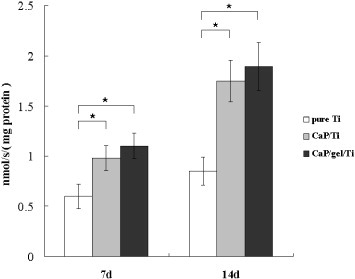
Figure 5. Gene expressions of collagen I, ALP and OCN of MSCs on pure Ti, CaP/Ti and CaP/gel/Ti plates after culturing for 14 days. ∗: P < 0.05.
3.5. Examinations of the bone–implant interface
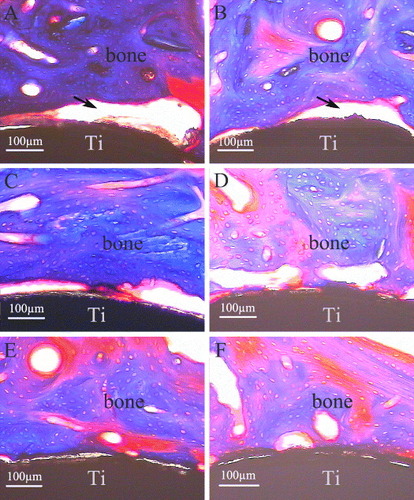
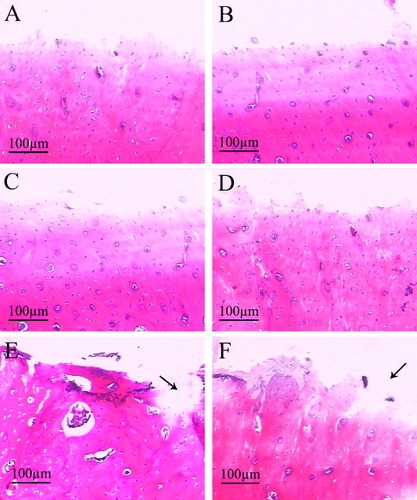
From the histological sections (figure ), the crack space between bone and pure Ti implants (figure (A), the black arrow) was the biggest among the three groups, whereas the bone contact was much closer to the CaP/gel/Ti implants surface (figure (E)) compared with other two groups (figures (A) and (C)) at 4 weeks after implantation. At 8 weeks, the gap became smaller in the interface between the bone and the pure Ti implant (figure (B), the black arrow). While the clearance between the CaP/gel/Ti implants and bone remained the smallest, as shown in figure (F).
Figure 6. Masson's trichrome surface staining of bone-implant interface after implantation for 4 weeks (A), (C), (E) and 8 weeks (B), (D), (F) (n = 3). A, B: pure Ti; C, D: CaP/ Ti; E, F: CaP/gel/Ti.
3.6. Biomechanical test
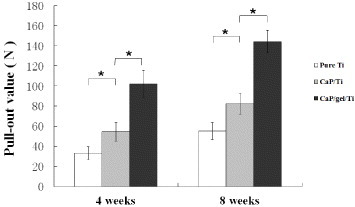
Results of the pull-out test were expressed as the maximum pull-out force in figure , which were consistently higher for the CaP/gel/Ti surface than for the pure Ti and CaP/Ti surfaces at 4 and 8 weeks of the healing period. The CaP/gel/Ti group exerted the strongest effects on improving values of the three groups at both time points. The maximal pull-out test force increased by 1.7- and 0.7-fold compared to the pure Ti and CaP/Ti group at 4 weeks, and by 1.6- and 0.8-fold at 8 weeks, respectively (p < 0.05). The values of the CaP/Ti group also significantly increased compared with the pure Ti group at both time points, but not more than the CaP/gel/Ti group.
Figure 7. Pull-out value of the pure Ti, CaP/Ti and CaP/gel/Ti implants at 4 and 8 weeks healing period. Data are shown as mean ± SD, (n = 3). ∗: P < 0.05.
3.7. Examinations at implant surface and the bone defects
Figure shows SEM images and EDS microanalysis results for Ti, CaP/Ti and CaP/gel/Ti implants after being pulled out from the defects at 4 and 8 weeks after surgery, respectively. It was observed that some residual bone tissue adhered on the surface of implants, and the thickness of bone tissue adhered to the surface increased from 4 to 8 weeks after implantation. However, the residual bone tissue adhered onto the surface of CaP/gel/Ti implants was thicker than that on the surface of pure Ti and CaP/Ti implants (figures (A)–(C) and (G)–(I)), which meant that the bone attached tightly onto the surface of CaP/gel/Ti implants. It appeared that the shear strength between the CaP/gel/Ti implants and bone was higher than the other two groups.
Figure 8. SEM images and EDS microanalysis of the surfaces of Ti, CaP/Ti and CaP/gel/Ti for the implantation of 4 weeks (A)–(F) and 8 weeks (G)–(L) after the implants were pulled out (n = 3). A, D, G, J: pure Ti; B, E, H, K: CaP/Ti ; C, F, I, L: CaP/gel/Ti. Residual bone was well integrated into the implants.
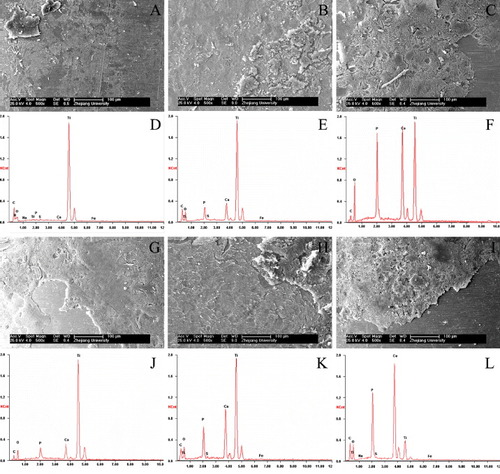
EDS microanalysis also revealed that the implants were in direct contact with the newly formed bone (figures (D)–(F) and (J)–(L)). A layer composed mainly of Ca and P substances was observed on all three groups and increased from 4 to 8 weeks after implantation. The content of Ca, P in the surface of CaP/gel/Ti implants was more than that of pure Ti and CaP/Ti at each time point, which meant that the residual bone tissue adhered onto the surface of CaP/gel/Ti implants was thicker than that on the other two groups.
The histological results showed that the interface of bone defects in the group of pure Ti was regular at 4 and 8 weeks (figures (A) and (B)), the bony contact between bone and implants were loose so that the bone were not pulled out along with the implants. The interfaces on CaP/Ti seem rougher than that on the pure Ti group at both time points, which implied the stronger bony contact between bone and implants so that some bone was pulled out along with the implants (figures (C) and (D)). In the group of CaP/gel/Ti, some bone tissues were torn out by pulling out the implants and the big voids left (figures (E) and (F) the black arrow), which meant that the bone was more tightly in contact with the CaP/gel/Ti implants so that some bone tissue was broken and remained on the surface of implants.
Figure 9. H&E staining of remaining bone defects for the implantation of 4 weeks (A), (C), (E) and 8 weeks (B), (D), (F) after the implants were pulled out (n = 3). A, B: pure Ti; C, D: CaP/ Ti; E, F: CaP/gel/Ti. Some bone tissues were torn out by pulling out the implants and the big voids left (the black arrow).
4. Discussion
Natural bone is composed of Ca, P and collagen fibers, therefore the Ca/P/gelatin composites can be used as bone scaffolds by mimicking the bone structure. The present study demonstrated that CaP/gel/Ti could absorb proteins in vivo, promoting the proliferation and osteogenic differentiation of MSCs and enhancing the bone-bonding ability in the early post-surgery period, compared with pure Ti and CaP/Ti.
In this work, a bilayer gelatin/CaP layer was deposited on Ti substrate using a simple enzyme method. It is considered that the use of urease to prepare a bilayer of gelatin/CaP on a Ti surface has several advantages, when compared with other previous methods. Atomic force microscope is a highly sensitive technique of probing the microstructure and surface roughness in materials, which could also offer high resolution 3D images of the surface of materials. Figures (C) and (D) show that the CaP/gel/Ti exhibited highly rough surface.
The in vitro study showed that CaP/gel/Ti promoted the proliferation of MSCs at early time. MSCs on CaP/gel/Ti proliferated significantly higher than that on pure Ti plates (p < 0.05). Cellular proliferation can be enhanced when the scaffold adsorbs a large amount of cell growth factor [Citation20]. Various proteins, such as fibronectin and vitronectin, play important roles in the adhesion, spreading and movement of cells on a substrate surface [Citation21–Citation23], which is consistent with the present study. Although there was no significant difference, the cell density of MSCs on the CaP/gel/Ti plate was obviously higher than that of CaP/Ti. The reason may be that the CaP/gel/Ti can adsorb larger amounts of protein, thus improving the attachment and proliferation of MSCs.
While MSCs proliferation is a critical early step in the process of osseointegration of a biomaterial, the material should also support differentiation of stem cells along an osteoblastic lineage. The critical event for bone bonding is the MSC adhesion onto the CaP surface followed by osteoblastic differentiation [Citation24]. In vitro, the osteogenic differentiation of MSCs on Ti, CaP/Ti and CaP/gel/Ti was quantitatively determined using ALP. ALP activity is a transient early marker of osteogenic differentiation in MSCs and generally a good indicator of differentiation [Citation25]. ALP activities of MSCs on the CaP/Ti and CaP/gel/Ti were both significantly higher than that on pure Ti substrate, both at 7 and 14 days. Previous studies showed that CaP surface supported osteoblastic differentiation of marrow stromal cells [Citation24, Citation26]. In addition, the results suggested that roughness might play an important role in cell response, different from that of surface texture [Citation27]. Performance of cells is highly sensitive to the topography and size of nanostructures. Compared to pure Ti, the surface of CaP/Ti and CaP/gel/Ti implants was much rougher. Moreover, the surface of CaP/Ti and CaP/gel/Ti implants has a nanostructure of CaP. In previous studies, even very small roughness changes (∼ 1 μm) caused changes in cell behavior [Citation28].
This study showed the beneficial effect of the urease fabricated CaP/gel/Ti on biological effects of MSCs and bone-bonding ability in femoral defects. The in vivo results demonstrated that CaP/gel/Ti implants accelerated the bone regeneration in the early post-surgery period, compared with pure Ti and CaP/Ti, which was consistent with in vitro results in this study. The CaP/gel layer absorbed large amounts of proteins, enhanced cell attachment, proliferation and osteogenic differentiation of MSCs, which in turn resulted in enhanced bone healing in vivo. It is known that osteogenic induction of MSCs around implants in vivo is an important factor in the functional restoration of the tissue. Pure Ti and CaP/Ti implants demonstrated less bony contact and some fibrous tissue, whereas the new bone directly contacted with the CaP/gel/Ti implants surface. When the implants were pulled out from the bone defects, bone tissue contacted more tightly and directly to CaP/gel/Ti implants (figures (E) and (F)), so more bone tissue was detached surrounding bone tissue. Hence, more residual bone tissue attached to the surface of the CaP/gel/Ti implants (figures (C) and (I)), while residual bone tissue on the surface of the pure Ti and CaP/Ti implants was thinner (figures (A), (B), (G) and (H)). A significant higher value of maximum pull-out force was found in the CaP/gel/Ti implant in comparison to pure Ti and CaP/Ti groups, which also demonstrated that the CaP/gel layer contributed to the promoted new bone formation, hence improved implant osseointegration and showed higher bonding strength between bone and implant than the other two groups. The histological results were in accordance with the biomechanical test.
Moreover, it is clear from clinical as well as in vivo studies that the topography and roughness of an implant surface influences the osseointegration process [Citation29]. Surface topography is very important in early osseointegration of implants. Klokkevold et al [Citation30] reported that early endosseous integration could be improved with titanium implants of an appropriate surface micro-texture treated by dual acid etching. Nishiguchi et al [Citation31] showed that alkali- and heat-treated porous titanium also improved the bone integration at the early post-implantation period. In previous studies, a network structure of HA coated Ti treated by NaOH was confirmed to improve osseointegration and bone-bonding strength in animal study [Citation32].
Surface chemistry is also critical in early osseointegration of an implant. CaP on the surface may play an important role in accelerating the process of bone–implant bonding, resulting in firmer and more rapid fixation, which was confirmed in previous study [Citation33]. The CaP may link bony tissue to the implants and lead to chemical bonding. In addition, the dissolution of coatings saved space available for bone regeneration, and the optimal coating should degrade at a rate similar to bone formation and should completely disappear after completion of the bone-healing process [Citation34]. Further research is needed to investigate when these coatings will be completely absorbed.
On the basis of the results of the significantly improved MSCs responses and bone-bonding ability in vivo, the CaP/gelatin functionalized Ti is considered to be potentially useful for dentistry and orthopedics.
5. Conclusion
The fabricated CaP/gel/Ti was beneficial for the osteogenic differentiation of MSCs and for improving the bone-bonding ability in vivo. Such CaP/gel functionalized Ti might have great potential in joint replacement or dental implants.
Acknowledgments
This work was supported by the Science Technology Program of Zhejiang Province (2008C13025, 2013C33096); the Natural Science Foundation of China (81071259), the TCM Foundation for Distinguished Young Talents of Zhejiang Province (2012ZQ024), the Key Medical Disease Program of Hangzhou city (20120533Q01), the Key Science Technology Program of Xiaoshan district (2012234) and the Doctoral fund of the Ministry of Education of China (20100101120132). All authors have no conflicts of interest.
References
- PohC KShiZLimT YNeohK GWangW 2010 Biomaterials 31 1578 10.1016/j.biomaterials.2009.11.042
- KangasniemiI MVerheyenC Cvan der VeldeE Ade GrootK 1994 J. Biomed. Mater. Res. 28 563 10.1002/jbm.820280506
- SpivakJ MRicciJ LBlumenthalN CAlexanderH 1990 J. Biomed. Mater. Res. 24 1121 10.1002/jbm.820240902
- TakatsukaKYamamuroTNakamuraTKokuboT 1995 J. Biomed. Mater. Res. 29 157 10.1002/jbm.820290204
- IshizawaHOginoM 1995 J. Biomed. Mater. Res. 29 1071 10.1002/jbm.820290907
- LeeJAokiH 1995 Biomed. Mater. Eng. 5 49
- KitsugiTNakamuraTOkaMSenahaYGotoTShibuyaT 1996 J. Biomed. Mater. Res. 30 261 10.1002/(SICI)1097-4636(199602)30:2%3C261::AID-JBM17%3E3.0.CO;2-P
- GeesinkR GHoefnagelsN H 1995 J. Bone Joint Surg. Br. 77 534
- S⊘balleK 1993 Acta. Orthop. Scand. Suppl. 255 1
- GeesinkR G 2002 Clin. Orthop. Relat. Res. 395 53 10.1097/00003086-200202000-00007
- KärrholmJMalchauHSnorrasonFHerbertsP 1994 J. Bone. Joint Surg. Am. 76 1692
- BoudreauNBissellM J 1998 Curr. Opin. Cell Biol. 10 640 10.1016/S0955-0674(98)80040-9
- CenniECiapettiGSteaSCorradiniACarozziF 2000 J. Biomater. Sci. Polym. Edn 11 685 10.1163/156856200743959
- UralEKesenciKFambriLMigliaresiCPiskinE 2000 Biomaterials 21 2147 10.1016/S0142-9612(00)00098-3
- MarraK GSzemJ WKumtaP NDiMillaP AWeissL E 1999 J. Biomed. Mater. Res. 47 324 10.1002/(SICI)1097-4636(19991205)47:3%3C324::AID-JBM6%3E3.0.CO;2-Y
- YanW QOkaMNakamuraT 1998 J. Biomed. Mater. Res. 42 258 10.1002/(SICI)1097-4636(199811)42:2%3C258::AID-JBM10%3E3.0.CO;2-F
- ChenFChenSTaoKFengXLiuYLeiDMaoT 2004 Br. J. Oral Maxillofac. Surg. 42 532
- LiL HKongY MKimH WKimY WKimH EHeoS JKoakJ Y 2004 Biomaterials 25 2867 10.1016/j.biomaterials.2003.09.048
- NakamuraAAkahaneMShigematsuHTadokoroMMoritaYOhgushiHDohiYImamuraTTanakaY 2010 Bone 46 418 10.1016/j.bone.2009.08.048
- LiXvan BlitterswijkC AFengQCuiFWatariF 2008 Biomaterials 29 3306 10.1016/j.biomaterials.2008.04.039
- MaedaTOyamaRTitaniKSekiguchiK 1993 J. Biochem. 113 29
- MurasawaYHayashiTWangP C 2008 Exp. Cell Res. 314 3638 10.1016/j.yexcr.2008.08.024
- DunnG AZichaD 1995 J. Cell. Sci. 108 1239
- OkumuraMOhgushiHDohiYKatudaTTamaiSKoertenH KTabataS 1997 J. Biomed. Mater. Res. 37 122 10.1002/(SICI)1097-4636(199710)37:1%3C122::AID-JBM15%3E3.0.CO;2-I
- ToquetJRohanizadehRGuicheuxJCouillaudSPassutiNDaculsiGHeymannD 1999 J. Biomed. Mater. Res. 44 98 10.1002/(SICI)1097-4636(199901)44:1%3C98::AID-JBM11%3E3.0.CO;2-P
- WilkeAOrthJLombMFuhrmannRKienapfelHGrissPFrankeR P 1998 J. Biomed. Mater. Res. 40 301 10.1002/(SICI)1097-4636(199805)40:2%3C301::AID-JBM15%3E3.0.CO;2-O
- CurtisA SWilkinsonC D 1998 J. Biomater. Sci. Polym. Edn 9 1313 10.1163/156856298X00415
- ClarkPConnollyPCurtisA SDowJ AWilkinsonC D 1991 J. Cell. Sci. 99 73
- LincksJBoyanB DBlanchardC RLohmannC HLiuYCochranD LDeanD DSchwartzZ 1998 Biomaterials 19 2219 10.1016/S0142-9612(98)00144-6
- KlokkevoldP RJohnsonPDadgostariSCaputoADaviesJ ENishimuraR D 2001 Clin. Oral. Implants Res. 12 350 10.1034/j.1600-0501.2001.012004350.x
- NishiguchiSKatoHNeoMOkaMKimH MKokuboTNakamuraT 2001 J. Biomed. Mater. Res. 54 198 10.1002/1097-4636(200102)54:2%3C198::AID-JBM6%3E3.0.CO;2-7
- XueWLiuXZhengXDingC 2005 Biomaterials 26 3029 10.1016/j.biomaterials.2004.09.003
- YanW QNakamuraTKawanabeKNishigochiSOkaMKokuboT 1997 Biomaterials 18 1185 10.1016/S0142-9612(97)00057-4
- BarrereFvan der ValkC MDalmeijerR Avan BlitterswijkC Ade GrootKLayrolleP 2003 J. Biomed. Mater. Res. A 64 378 10.1002/jbm.a.10291