
Abstract
We have determined local magnetic moments at nickel grain boundaries using a transmission electron microscopy/electron energy loss spectroscopy method assuming that the magnetic moment of Ni atoms is a linear function of the L3/L2 (white-line ratio) in the energy loss spectrum. The average magnetic moment measured in the grain interior was 0.55 μB, which agrees well with the calculated magnetic moment of pure nickel (0.62 μB). The local magnetic moments at the grain boundaries increased up to approximately 1.0 μB as the mis-orientation angle increased, and showed a maximum around 50°. The respective enhancement of local magnetic moments at the Σ5 (0.63 μB) and random (0.90 μB) grain boundaries in pure nickel was approximately 14 and 64% of the grain interior. In contrast, the average local magnetic moment at the (111) Σ3 grain boundary was found to be 0.55 μB and almost the same as that of the grain interior. These results are in good agreement with available ab initio calculations.
Introduction
Extensive studies on ‘magnetism’ have been conducted ever since Brown [Citation1], in the 1940s, discussed for the first time the influence of dislocations on magnetic properties, and that most show that magnetic properties depend significantly on microstructure [Citation2, Citation3]. In particular, grain boundaries are of great importance in governing the magnetic properties of materials. This is because grain boundaries act not only as pinning sites for moving domain walls [Citation4–Citation6] but also as possible nucleation centres for domains of reverse magnetization [Citation7, Citation8]. Nevertheless, magnetization at grain boundaries received little attention until two decades ago, until which other properties were more extensively studied [Citation9–Citation13].
In these past two decades or so, first-principle (ab initio) calculations have been applied to study the magnetization at grain boundaries [Citation14–Citation22]. Hampel et al [Citation14], who used the layer Korringa–Kohn–Rostker technique, calculated the magnetic moment of the (310) Σ5 tilt boundary in bcc iron (Fe) and found an increase in the local magnetic moment at the grain boundary. The calculated value of the magnetic moment at the grain boundary was 2.56 μB. Turek et al and Čák et al conducted ab initio calculations on the electronic structure and local magnetic moments at the (310) Σ5 tilt grain boundary in bcc Fe, and confirmed the enhancement of local magnetic moments at this boundary with a magnetic moment calculated to be 2.74 μB. They attributed this enhancement of local magnetic moment to the magnetovolume effect [Citation15, Citation16]. Wu et al [Citation17] calculated the local magnetic moment at the (111) Σ3 boundary in Fe to be 2.60 μB. Enhancement of the local magnetic moment at the (210) Σ5 tilt grain boundary in nickel (Ni) was also predicted [Citation16, Citation18–Citation21]. In contrast, Szpunar et al [Citation22] predicted a decrease in local magnetic moment at the grain boundary in Ni by presuming an amorphous grain-boundary state. However, only limited reliable experimental data on such moments have been obtained so far, because the measurement of the local magnetic moments around grain boundaries is difficult using conventional techniques. To our knowledge, Fitzsimmons et al [Citation23], who used neutron diffraction, experimentally determined for the first time the local magnetic moments at grain boundaries in Ni bicrystals with a 19.7° twist boundary on the [001] axis. They confirmed the enhancement of magnetic moments around the grain boundary. However, their reported enhancement and the magnetically enhanced width were surprisingly large at the predicted values of 1.6 μB and approximately 10 nm, respectively. Although another experimental measurement of magnetic moment using magnetic force microscopy was performed [Citation24], the resolutions of these methods were insufficient to evaluate the local magnetic moments at individual grain boundaries.
Pease et al [Citation25] proposed a new method to evaluate the local magnetic moments of atoms using electron energy loss spectroscopy (EELS), in which they introduced a new function for linearizing the local magnetic moment of atoms with a 3d L3/L2 ‘white-line ratio’ in EELS. Although other techniques like transmission electron microscopy (TEM) and holography should be used in combination with this TEM–EELS method to reveal the direction of magnetic moments, [Citation26], we have applied this new method to measure the local magnetic moments near grain boundaries, and found an enhancement of local magnetic moment at grain boundaries in pure Fe [Citation27]. The obtained values agree well with the theoretical estimates. Of particular importance is the finding that the local magnetic moment at grain boundaries increased up to 2.63 μB, according to the grain boundary character. This compares very well with the value of 2.55 μB obtained for the (310) Σ5 grain boundary in Fe in [Citation16]. Unfortunately, as described in Pease's paper [Citation25], this linearizing method cannot be applied to transition metals with more than nine 3d electrons, like Ni, because the white-line ratio obtained from such metals will be enhanced. In fact, the magnetic moment of bulk Ni was over-estimated to be 1.03 μB, if we apply the same linear-function that we used for the estimation of the magnetic moment in Fe to Ni. Therefore, to reveal the influence of grain boundary character on local magnetic moments of grain boundaries in Ni, we examined a new relationship between the magnetic moment of atoms and the white-line ratio in EELS for Ni using pure Ni and selected Ni compounds. The local magnetic moments of the grain interior and well-characterized grain boundaries in pure Ni were then empirically evaluated using the new function obtained.
Experimental details
Determination of local magnetic moment by the TEM/EELS method
The material used in this study was fully annealed pure Ni, of the composition shown in table . In addition, NiAl with 51.39Ni–48.60Al–0.01Si (at.%) and Ni3Al with 77.53Ni–22.47Al (at.%) were used to determine the relation between the white-line ratio and the magnetic moment of the Ni atom. Specimens for TEM/EELS analysis were thinned using a focused ion beam (Quanta 200 3D, FEI Co., Hillsboro, Oregon, USA) at an accelerating voltage of 30 kV. TEM/EELS measurements were performed on an FEI TECNAI F20 microscope equipped with a Gatan imaging filter at an acceleration voltage of 200 kV. Conditions for EELS measurements were: energy dispersion of 0.1 eV per channel, electron probe size 10 nm and convergence angle 15 mrad. For evaluation of the white-line ratio on the EELS profile, the background intensity was eliminated using a method suggested by Pearson et al [Citation28], and the ratio was calculated from the area under each peak. The dependence of the white-line ratio on specimen thickness is low [Citation29] and we did not take into account the difference in specimen thickness in evaluating the white-line ratio.
Table 1. Chemical composition (at.%) of pure Ni in this study.
The character of each grain boundary in the TEM samples was determined by electron backscatter diffraction with TSL's Orientation Imaging Microscopy software. Particularly, in pure Ni, some of the specimens were thinned from the bulk region including the specific grain boundary after the grain boundary character was determined. We measured the local magnetic moments at individual grain boundaries with different grain boundary characters. Because the probe size used in the TEM/EELS analysis was approximately 10 nm in diameter, the EELS spectra obtained at a grain boundary included also the contribution from the grain interior. According to the ab initio calculations by Turek et al [Citation15] and Čák et al [Citation16], an increase in local magnetic moment occurs within a few atomic layers from the grain boundary. If the absolute values of the local magnetic moments at the grain interior and boundary are denoted mg and mgb, respectively, the magnetic moment at such transition layers is assumed to be the mean of mg and mgb. Therefore, the total magnetic moment obtained experimentally at the grain boundary, m, is presumed to be
1
where S0 is the area of the electron probe used, and Sgb and Si are the respective areas of the grain boundary and thetransition region around the grain boundary within the electron probe. For estimation of the area of each region, the grain boundary width and transition layers on both sides of the grain boundary are assumed to be 1 nm. Using (Equation1
1 ), we can estimate the absolute value of the local magnetic moment at the grain boundary mgb without the influence of the grain interior.
Ab initio calculations
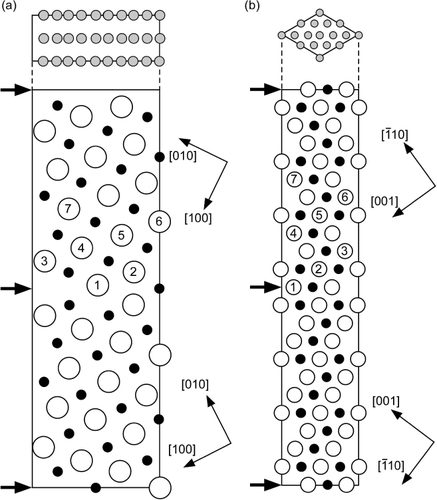
All calculations were performed with density functional theory using the Vienna ab initio simulation package code [Citation30–Citation32] implementing a projector-augmented wave method. For the exchange-correlation energy, the generalized gradient approximation was employed providing a better agreement with experimental data for Ni. The Brillouin zone (BZ) was sampled using the Monkhorst–Pack scheme and BZ integration was performed using the Methfessel–Paxton scheme. The cutoff energy restricting the number of plane waves in the basis set was Ecut = 269.533 eV for Ni, Ni3Al and NiAl, Ecut = 267.883 eV for the (210) Σ5 grain boundary and Ecut = 269.533 eV for the (111) Σ3 grain boundary. We used 13 × 13 × 13, 9 × 9 × 9, 8 × 8 × 8, 8 × 18 × 3 and 6 × 6 × 1 k-point meshes for Ni, Ni3Al, NiAl, and the (210) Σ5 and (111) Σ3 grain boundaries in Ni, respectively. We studied two types of grain boundaries, the (210) Σ5 and the (111) Σ3 grain boundary in fcc Ni. Figures (a) and (b) show the supercells used in the calculation of the (210) Σ5 and (111) Σ3 grain boundaries in pure Ni. They display atomic positions after relaxation and the arrows indicate the position of the grain boundary planes. The calculated structural models contain 56 and 88 atoms for the (210) Σ5 and (111) Σ3 grain boundary in Ni, respectively. The supercell dimensions were 7.879460 × 3.523800 × 22.062480 Å3 and 4.983400 × 4.983400 × 44.758280 Å3 for the (210) Σ5 and (111) Σ3 grain boundaries, respectively. The distances between two grain boundaries are 11.03124 and 22.37914 Å for the (210) Σ5 and (111) Σ3 grain boundaries, respectively. These distances are sufficient to remove any interaction between the grain boundaries in the supercell used for calculations, because the values of the local magnetic moments obtained at a distance several interlayers from the grain boundary were essentially the same as for bulk Ni.
Figure 1 (a) Supercell used in calculations of the (210) Σ5 grain boundary in pure Ni viewed along the [001] direction. Solid and open circles mark atoms in the [001] =0 and [001] = a/2 planes, respectively; a is the lattice constant. (b) Supercell used in calculations of the (111) Σ3 grain boundary in pure Ni viewed along the [110] direction. Solid and open circles mark atoms in the [110] =0 and planes, respectively. Grain boundary planes are indicated by arrows. An explicit numbering of atomic layers is used near the grain boundary plane of number 1. The projected lattice points (grey circles) above the supercells onto the (210) and (111) planes are also shown in (a) and (b), respectively.
Results and discussion
Correlation between the white-line ratio and the Ni atomic magnetic moment
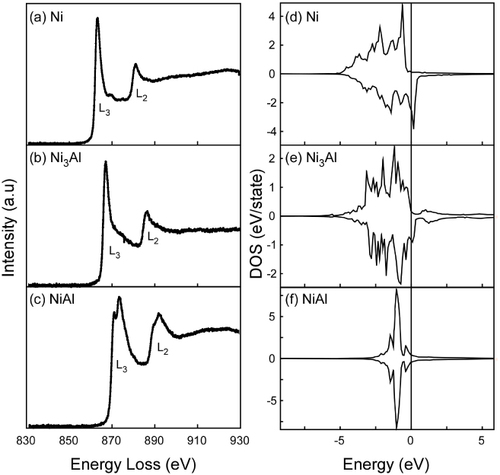
Figures (a)–(c) show the typical L edge in the EELS spectrum obtained in pure Ni, Ni3Al and NiAl, respectively. The white-line ratios obtained from these spectra were 3.246, 3.110 and 2.620, respectively. Figures (d)–(f) show the density of states (DOS) obtained by ab initio calculations for pure Ni, Ni3Al and NiAl, respectively. The DOS of NiAl is rather different from those of pure Ni and Ni3Al. The DOS of spin-up and spin-down in pure Ni and Ni3Al is clearly asymmetric in comparison with that in NiAl. The magnetic moments of Ni atoms in Ni, Ni3Al and NiAl are provided by the difference between the DOS of spin-up and spin-down, being 0.62, 0.26 and 0 μB, respectively.
Figure 2 Typical L edge in EELS spectrum obtained in (a) pure Ni, (b) Ni3Al and (c) NiAl. The DOS in (d) pure Ni, (e) Ni3Al and (f) NiAl.
We assessed the correlation between magnetic moment and the white-line ratio using the data obtained from pure Ni, Ni3Al and NiAl, as shown in figure . The white-line ratio of EELS spectra can be affected by the thickness of the area measured. The variation of the white-line ratios shown in figure could come from the difference in the thickness of the area where the EELS spectra were obtained. There was a good linear relationship between magnetic moments and the white-line ratio of Ni and Ni compounds. From this figure, we determined a new linear function:
2
from which we estimated the local magnetic moments in the grain interior mg to be 0.55 μB for pure Ni. This value agrees well with the theoretical values of 0.62 μB and the saturated magnetic moment for Ni of 0.60 μB.
Figure 3 Relationship between white-line ratio and magnetic moment.

Local magnetic moments at grain boundaries in Ni
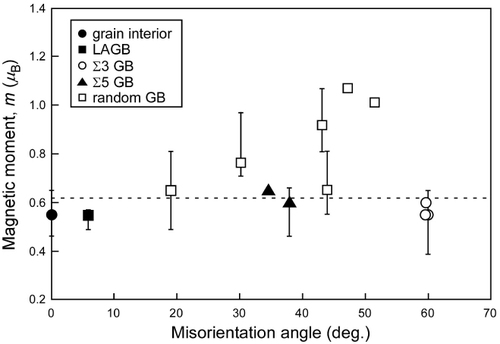
Figure shows the experimental local magnetic moments at grain boundaries in pure Ni as a function of mis-orientation angle obtained in this work. The mis-orientation angle is defined as the minimum angle from the 24 equivalent variants of angle/rotation axis pair. The average magnetic moment measured in the grain interior is 0.55 μB as mentioned above. The magnetic moments are higher at the grain boundaries than in the grain interior, and this enhancement at grain boundaries depends significantly on its mis-orientation angle. The local magnetic moment at low-angle boundaries (θ = 5.8°) is 0.55 μB. The local magnetic moments increase up to approximately 1.0 μB as the mis-orientation angle increases, and show a maximum around 50°. However, the local magnetic moment cusps occur at the Σ5 and Σ3 coincident site lattice (CSL) boundaries. The enhancement in local magnetic moments at Σ5 (0.63 μB) and random (0.90 μB on average) grain boundaries in pure Ni was approximately 14 and 64%, respectively, compared with the grain interior. Such enhancements were reported to be 14% at Σ5 and random grain boundaries in pure Fe [Citation27]. In particular, the enhancement at random grain boundaries is much larger in pure Ni than in pure Fe. However, the ab initio calculations conversely showed an increase in magnetic moment at the (210) Σ5 grain boundary in Ni [Citation16, Citation18–Citation21] that is much smaller than that at the (310) Σ5 grain boundary in Fe [Citation14–Citation16]. In contrast, the average of the local magnetic moments at the (111) Σ3 grain boundary (coherent twin boundary) in Ni was found to be 0.55 μB from TEM/EELS measurements. This is almost the same as that of the grain interior. Turek et al [Citation15] and later Čák et al [Citation16] showed by ab initio calculations that an increase in local magnetic moments at grain boundaries is closely related to the atomic free volume at the boundaries. There is no volume change at the (111) Σ3 grain boundary compared with the grain interior in fcc metals [Citation33]. This may explain why there is no significant increase in local magnetic moment near the (111) Σ3 grain boundary in Ni.
Figure 4 Effect of mis-orientation angle on the measured local magnetic moments at grain boundaries in pure Ni. The broken line represents the calculated value of the magnetic moments in the bulk. Here the mis-orientation angle was defined as the minimum angle from the 24 equivalent variants of the angle/rotation axis pair.
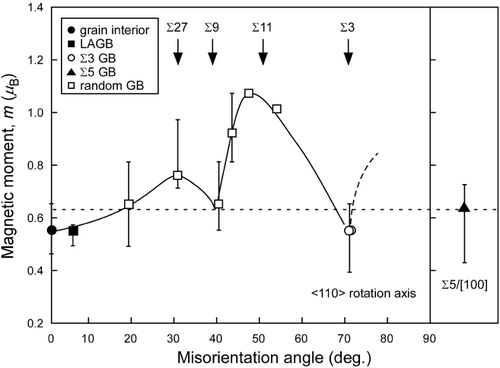
From the geometrical point of view, a grain boundary has five macroscopic degrees of freedom (DOF). We discussed above the mis-orientation dependence of the local magnetic moments without considering the rotation axis. Only one of five DOF was considered. In addition, the grain boundary plane orientation, which is the two remaining DOF, should be considered to completely understand the effect of grain boundary character on the local magnetic moments of grain boundaries, because from the five DOF characterization, the character of grain boundaries could be changed from general to special by changing their inclination [Citation34]. Accordingly, we assessed the 24 angle/axis pairs of each grain boundary, and examined the grain boundaries with respect to the 〈110〉 rotation axis; that is, three of five DOF were considered. Here, the tolerance for the rotation axes from the exact direction of interest was defined as 10°. Figure shows the mis-orientation dependence of the local magnetic moments at grain boundaries about the 〈110〉 rotation axis. For comparison, the data of the Σ5 grain boundary with the 〈110〉 rotation axis is also shown. The cusps on the local magnetic moments–mis-orientation curve clearly appear at the Σ3 grain boundary and the random boundary possessing the approximate Σ9 CSL orientation relation. Therefore, we can see that the local magnetic moments show a similar mis-orientation dependence to grain boundary energy [Citation35]. As Turek et al [Citation15] and Čák et al [Citation16] suggested, this is probably because the local magnetic moments at grain boundaries are closely related to the grain boundary free volume, like the grain boundary energy [Citation33].
Figure 5 Dependence of mis-orientation on the measured local magnetic moments at grain boundaries with the 〈110〉 rotation axis in pure Ni. The broken line represents the calculated value of the magnetic moments in the bulk. For comparison, the local magnetic moment at the Σ5 grain boundary with the 〈001〉 rotation axis is also shown.
Ab initio calculations of local magnetic moments near the (210) Σ5 and (111) Σ3 grain boundaries in Ni
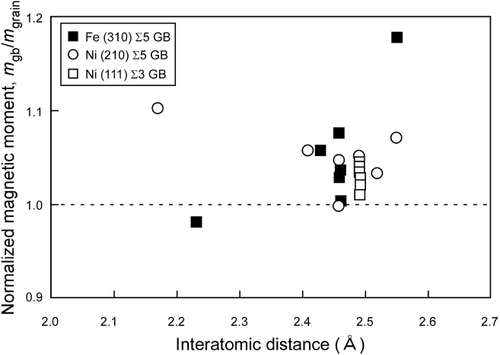
The magnetic moment of each layer in the (210) Σ5 grain boundary represented by figure (a) is shown in figure (a). The values of the local atomic magnetic moments in the grain boundary plane and the neighbouring plane were found to be 0.66 and 0.68 μB, respectively. These are approximately 6 and 10% larger than for the grain interior and consistent with the enhancement of 3 and 7% reported in [Citation16, Citation20, Citation21]. The enhancement near the grain boundary is in good agreement with the value obtained by TEM–EELS measurements, from which the grain boundary plane orientation was not determined. Local magnetic moments in the second layer are found to be a maximum, and essentially approach the bulk value at the sixth interatomic layer. This oscillatory behaviour was quite similar to the result observed previously by various researchers [Citation16, Citation18–Citation21]. The local magnetic moment of each layer in the (111) Σ3 grain boundary represented by figure (b) is shown in figure (b). The value of the local magnetic moment of the atom in the grain boundary plane was found to be 0.64 μB, and is less dependent on the distance apart from the grain boundary plane. These results are also consistent with experimental results shown in figure within the experimental error. The local magnetic moment was found to be closely related to the magnetic free volume [Citation15, Citation16]. We therefore examined the dependence of local magnetic moments on the interatomic distance of the nearest-neighbour atoms. From results of ab initio calculations, the local magnetic moments at the (210) Σ5 and (111) Σ3 grain boundaries in Ni were plotted against this distance (figure ). Here, the local magnetic moments around the grain boundaries were normalized by the bulk magnetic moment. For comparison, the local magnetic moments at the (310) Σ5 grain boundary in bcc Fe were analysed from ab initio calculations; these results are also plotted in figure . The local magnetic moment in the (310) Σ5 grain boundary in Fe is found to increase significantly with increasing nearest neighbour interatomic distance. In contrast, local magnetic moments near grain boundaries in fcc Ni are less dependent on the interatomic distance than those in bcc Fe. These results suggest that the magnetovolume effect for local magnetic moments at grain boundaries would be weaker in Ni with an fcc structure than in Fe with a bcc structure. We are currently investigating the reason for this.
Figure 6 (a) Local magnetic moments close to the (210) Σ5 grain boundary and (b) the (111) Σ3 grain boundary. The numbering of the atomic layers along the horizontal axis is the same as in figure .

Figure 7 Relation between local magnetic moments and interatomic distance at the (210) Σ5 and the (111) Σ3 grain boundaries in Ni, and at the (310) Σ5 grain boundary in Fe.
Conclusions
We examined the correlation between Ni atom magnetic moments and the white-line ratio in EELS using Ni, NiAl and Ni3Al. A linear relation exists between the plots of raw white-line ratio versus magnetic moments for data sets obtained from such materials. Based on this finding, we empirically estimated the local magnetic moments at individual grain boundaries of different character as well as in the grain interior in pure Ni. The average magnetic moment measured in the grain interior was 0.55 μB, which agrees well with the theoretical value of 0.62 μB. Of particular importance are findings that the local magnetic moment increases near the grain boundary. This increase depends significantly on the character of grain boundary. The enhancement agrees with previous theoretical calculations [Citation16, Citation18–Citation21], but varies from another calculation that presumed that grain boundaries were composed of an amorphous state in essentially different conditions from those of this study [Citation22]. The local magnetic moments of Σ3 and Σ5 grain boundaries at a low angle (θ = 5.8°) were measured to be 0.55, 0.55 and 0.63 μB, respectively, whereas the moments measured at random grain boundaries were on average 0.90 μB. Ab initio calculations revealed an enhancement in local magnetic moments near the (210) Σ5 grain boundary in Ni. The values of the local atomic magnetic moments in the grain boundary plane and the neighbouring plane were found to be 0.66 and 0.68 μB, respectively. This is approximately 6 and 10% larger than that of the grain interior. The local magnetic moment of the (111) Σ3 grain boundary, i.e. the coherent twin boundary, was calculated to be approximately 0.64 μB. These results were in good agreement with experimental results from the TEM–EELS method and with most of the previous theoretical calculations.
Acknowledgments
The authors wish to express their sincere thanks to Professor R Tomoshige from Sojo University in Kumamoto for kindly arranging the use of the TEM–EELS, and to Professor M Šob from the Masaryk University in Brno and Professor Y Morizono from Kumamoto University for fruitful discussions and encouragement. This study was supported by a Grant-in-Aid for Scientific Research (S) (19106013) from the Japan Society for the Promotion of Science (JSPS), Japan.
References
- BrownW FJr 1941 Phys. Rev. 60 139 10.1103/PhysRev.60.139
- EbelingD GBurrA A 1953 J. Met. 5 537
- DijkstraL J 1954 Relation of Properties to Microstructure Cleveland, OH American Society for Metals p 209
- TobinA GPaulD I 1969 J. Appl. Phys. 40 3611 10.1063/1.1658244
- LinI NMishraRThomasG 1984 IEEE Trans. Magn. 20 1
- AsakaTAnanYNagaiTTsutsumiSKuwaharaHKimotoKTokuraYMatsuiY 2002 Phys. Rev. Lett. 89 207203 10.1103/PhysRevLett.89.207203
- GoodenoughJ B 1954 Phys. Rev. 95 917 10.1103/PhysRev.95.917
- SzmajaW 2006 J. Magn. Magn. Mater. 301 546 10.1016/j.jmmm.2005.09.039
- GleiterGChalmersB 1972 Prog. Mater. Sci. 16 1 10.1016/0079-6425(72)90017-5
- MurrL E 1975 Interfacial Phenomena in Metals and Alloys London Addison-Wesley
- ChadwickG ASmithD A 1976 Grain Boundary Structure and Properties London Academic
- IshidaY 1986 Grain Boundary Structure and Related Phenomena, Suppl. Trans. JIM 27 Sendai Japan Institute of Metals
- SuttonA PBalluffiR W 1995 Interfaces in Crystalline Materials Oxford Clarendon
- HampelKVvedenskyD DCrampinS 1993 Phys. Rev. B 47 4810 10.1103/PhysRevB.47.4810
- TurekIDrchalVKudrnovskýJŠobMWeinbergerP 1997 Electronic Structure of Disordered Alloys, Surface and Interfaces Boston, MA Kluwer 244
- ČákMŠobMHafnerJ 2008 Phys. Rev. B 78 054418 10.1103/PhysRevB.78.054418
- WuRFreemanA JOlsonG B 1996 Phys. Rev. B 53 7504 10.1103/PhysRevB.53.7504
- CrampinSVvedenskyD DMacLarenJ MEberhartM E 1989 Phys. Rev. B 40 3413 10.1103/PhysRevB.40.3413
- GengW TFreemanA JWuRGellerC BRaynoldsJ E 1999 Phys. Rev. B 60 7149 10.1103/PhysRevB.60.7149
- VšianskáMŠobM 2011 Prog. Mater. Sci. 56 817 10.1016/j.pmatsci.2011.01.008
- VšianskáMŠobM 2011 Phys. Rev. B 84 014418 10.1103/PhysRevB.84.014418
- SzpunarBErbUPalumboGAustK TLewisL J 1996 Phys. Rev. B 53 5547 10.1103/PhysRevB.53.5547
- FitzsimmonsM RRöllABurkelESickafusK ENastasiM ASmithG SPynnR 1995 Nanostruct. Mater. 6 539 10.1016/0965-9773(95)00115-8
- TanakaMSaitoYNishidaH 2006 Chem. Lett. 35 1414 10.1246/cl.2006.1414
- PeaseD MFasihuddinADanielMBudnickJ I 2001 Ultramicroscopy 88 1 10.1016/S0304-3991(00)00116-9
- GaborD 1948 Nature 161 777 10.1038/161777a0
- IiSHirayamaKMatsunagaKFujiiHTsurekawaS 2013 Scr. Mater. 68 253 10.1016/j.scriptamat.2012.10.028
- PearsonD HAhnC CFultzB 1993 Phys. Rev. B 47 8471 10.1103/PhysRevB.47.8471
- IiSMatsunagaKHirayamaKFujiiHTsurekawaS 2012 Conf. Proc. APMC 10: 10th Asia-Pacific Microscopy Conf. /ICONN 2012: The 2012 Int. Conf. on Nanoscience and Nanotechnology/ACMM2 2: 22nd Australian Conf. on Microscopy and Microanalysis p 414
- KresseGHafnerJ 1993 Phys. Rev. B 47 558 10.1103/PhysRevB.47.558
- KresseGFurthmüllerJ 1996 Phys. Rev. B 54 11169 10.1103/PhysRevB.54.11169
- KresseGFurthmüllerJ 1996 Comput. Mater. Sci. 6 15 10.1016/0927-0256(96)00008-0
- WolfD 1990 Acta Metall. Mater. 38 781 10.1016/0956-7151(90)90030-K
- LejčekPHofmannSPaidarV 2003 Acta Mater. 51 3951 10.1016/S1359-6454(03)00219-2
- HassonG CGouxC 1971 Scr. Metall. 5 889 10.1016/0036-9748(71)90064-0