
Abstract
Molecular-level orientation within nanofibers has been attracting attention as a tool for controlling and designing highly functional nanofibers. In this study, we used atomic force microscopy to visualize the phase separation between soft and hard segments on a polyurethane (PU) nanofiber surface prepared by electrospinning. Furthermore, the stretched nanofibers prepared with a high-speed rotating collector were found to have a different phase distribution in the phase-separated structure, with the hard segment domains aligned to the fiber axis. In contrast, unstretched PU nanofibers prepared without rotation were observed to have nonuniformly distributed segments. These results indicate that the application of an intense elongation force along the nanofiber axis with a rotating mandrel collector changed the distribution of segment alignments.
Introduction
Electrospinning is a well-known effective method for fabricating polymeric nanofibers several hundred nanometers in diameter [Citation1]. Such nanofibers have been attracting much attention both in terms of basic research and in various application fields such as sensors, catalyst supports, drug delivery systems and scaffolds for tissue engineering [Citation2–Citation5]. So far, macroscopically aligned nanofibers have been fabricated by modifying the fiber-collecting system to incorporate a rotating mandrel collector [Citation6–Citation8]. In addition, the fabrication of uniaxially aligned nanofibers with anisotropic properties has been shown to be important for their use in a variety of electrical, optical, mechanical and biomimetic applications [Citation9–Citation12].
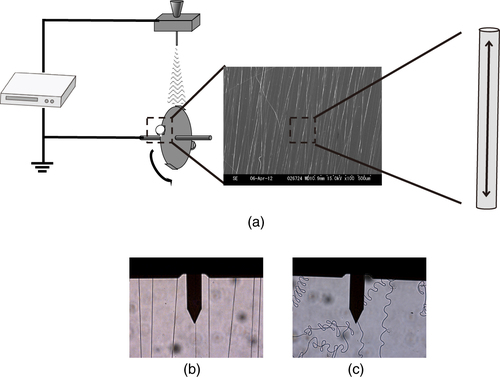
Recently, the molecular-level orientation within nanofibers has been attracting much attention. For instance, molecular orientation to an intense elongational force along the nanofiber axis has been reported for nanofibers formed under such a force applied by a rapidly rotating mandrel collector (figure (a)) [Citation13, Citation14]. It was hypothesized that the mechanical drawing of the fiber caused this molecular orientation.
Figure 1 (a) Schematic diagram of electrospinning apparatus. The two-headed arrow in the nanofiber indicates the tensile force applied to the nanofiber by the rotating mandrel collector. Optical images of (b) stretched and (c) unstretched nanofibers obtained with combined optical microscopy and AFM. The cantilever was positioned on a single nanofiber.
In previous electrospinning studies, the diameters and the morphologies of the fabricated nanofibers were carefully analyzed and controlled. However, the fine structure of the nanofibers and the degree of orientation of the molecular chains, crystallites and other ordered structures have not been sufficiently analyzed. In many cases, averaged data on the nanofiber structures obtained by, for example, x-ray diffraction, Raman spectroscopy, transmission electron microscopy and polarized Fourier transform infrared spectroscopy were discussed [Citation15–Citation18]. A more detailed understanding of the formation and structure of the nanofibers is needed to improve their mechanical and electrical properties and to tailor their compatibility with living cells so that they can be used as scaffolds in tissue engineering.
Segmented polyurethane (PU), which consists of hard and soft segments, is known to exhibit microphase separation, which allows it to be used in various forms, such as biomedical materials [Citation19–Citation21]. Each individual component of PU consists of both a flexible soft segment and a rigid hard segment. The hard segment is composed of urethane bonds and aggregations of the aromatic rings, and the soft segment consists of a polyester or polyether unit. The microphase-separated structure with hard segments formed through strong intermolecular interactions can inhibit thrombus formation. However, the molecular-scale mechanism remains unclear.
In this study, we investigated the surface structure of PU nanofibers prepared using an electrospinning method by performing atomic force microscopy (AFM; figures (b) and (c)). AFM is a powerful tool for investigating not only the surface nanotopology of the material but also its mechanical properties such as its hardness, elasticity and adsorption. In this study, we visualized the phase-separated structure of the PU nanofiber surface in order to understand how the electrospinning process and the mechanical drawing affect the molecular orientation of the nanofibers.
Experimental
Preparation of PU nanofibers
PU was purchased from BASF (Elastollan 1180A; Mn 77 000, Mw/Mn = 1.89) as pellets, which were dissolved in 95% tetrahydrofuran and 5% N,N-dimethylformamide (Wako) at 10.0% (w/v) by stirring at room temperature for 3 h. PU nanofibers were electrospun onto a glass coverslip (1 × 1 cm Matsunami, Osaka, Japan) using an electrospinning setup (MECC, Fukuoka, Japan). A high voltage, 20 kV, was applied between the syringe needle (G: 23) and the ground electrode. A rotating collector (diameter: 100 mm) was placed horizontally 100 mm from the needle, and the PU solution was extruded from the syringe at a rate of 0.5 ml h−1. The speeds and durations of rotation were 2000 rpm and 1 min for the stretched (aligned) nanofiber (figure (b)), and 0 rpm (stationary) and 30 s for the unstretched (random) nanofiber (figure (c)), respectively. To prepare the dip-coated film, the glass substrate was dipped in the PU solution. After preparation, all samples were dried and stored in a desiccator.
AFM imaging
We performed tapping-mode AFM measurements using a commercially available AFM controller (NanoWizard, JPK Instruments AG, Germany) that was combined with an optical microscope (Ti, Nikon, Japan). The tip position was roughly adjusted using a manual stage and an optical microscope before AFM imaging of the PU fibers. A silicon cantilever (AC160, Olympus, Japan) with a nominal spring constant of 26 N m−1 and a resonance frequency of 300 kHz in air was used.
Results and discussion
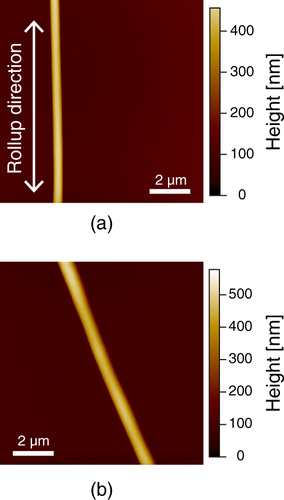
In this study, we investigated the surfaces of the PU nanofibers prepared by electrospinning. In order to understand how the electrospinning process and the mechanical drawing affect the nanoscale phase separation of the nanofiber, AFM measurement was performed. We prepared stretched and unstretched PU nanofibers by controlling the take-up velocity of the rotating disc collector, and we used a dip-coated film as a control (figure ). Stretched nanofibers were obtained at 2000 rpm and unstretched nanofibers were obtained with a stationary collector (0 rpm). Figure shows AFM images of a stretched PU nanofiber and an unstretched PU nanofiber on glass. The heights of the stretched and unstretched nanofibers were approximately 300 nm. These results indicate that the nanofibers were stretched and aligned along their ax
Figure 2 Schematic illustration of (a) stretched nanofibers, (b) unstretched nanofibers and (c) a dip-coated film.

Figure 3 AFM image of (a) stretched and (b) unstretched nanofibers.
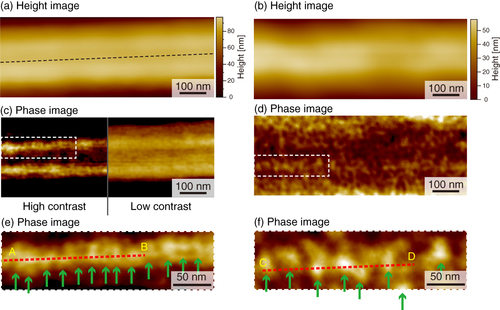
We performed AFM imaging of the local surfaces of PU nanofibers (figure ). Topographical images of the stretched and unstretched PU nanofibers are shown in figures (a) and (b), respectively. Smooth surface morphologies were obtained, and no characteristic structures of the PU nanofibers were observed for either type of PU nanofibers. However, in the phase image of the stretched nanofibers (figures (c) and (e)), we found a periodic structure with repeating nanoscale domains, while no periodic structure was observed for unstretched nanofibers (figures (d) and (f)) and the distribution of domains was nonuniform. With tapping-mode phase imaging, AFM can provide direct visualization of the microphase separation of polymers [Citation22, Citation23]. The phase image reflects the changes in viscosity and adhesion properties of the surface. In the phase images obtained in this study, light and dark areas correspond to different phase responses. The high phase angle shift (light color in the phase image) represents the ‘harder’ region. Therefore, the observed phase exhibiting spherical and cylindrical features with lateral dimensions of approximately 20–30 nm is considered to be made up of the hard segments, which is consistent with previous studies [Citation24–Citation29]. We attribute the light areas to the hard segment domains and the dark areas to the soft domains.
Figure 4 Illustration of AFM imaging of the surface of the nanofibers. The cantilever is scanned along the fiber axis.
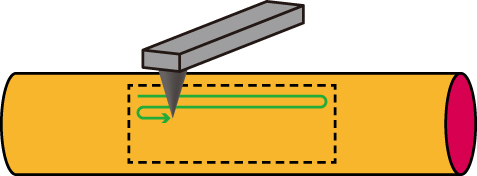
Figure 5 AFM images of stretched (a, c, e) and unstretched (b, d, f) PU nanofibers: (a, b) height images, (c, d) phase images with dashed areas magnified in (e, f); arrows indicate hard domains in the nanofibers.
The topographical and phase images of the PU film surface prepared by dip coating are shown in figure . The peak-to-valley height variation in the topographical image is approximately 1–4 nm, indicating a flat topography. However, in the phase image of the dip coat film (figures (b) and (c)), spherical and cylindrical structures were observed similar to that shown in figures (c)–(f). Thus, it is confirmed that the hard domains and soft domains are randomly mixed and that the phases are separated on the dip-coated PU surface. In summary, the AFM visualization results obtained in this study demonstrate that the alignment of the hard segments of PU nanofibers can be changed by applying a tensile force using the rotating disc.
Figure 6 AFM images of the dip-coated film: (a) height images; (b) phase image with the dashed area magnified in (c).
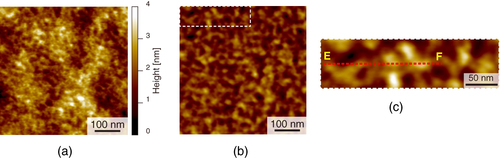
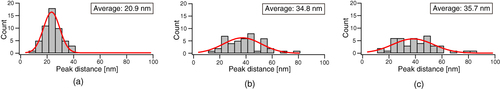
To examine this structure in more detail, a cross-sectional AFM plot along the line A–B in figure (e) was obtained (figure (a)). Fine features with a spacing of 20 nm can be observed along the direction of the long axis. In contrast, the fine features have a random spacing along lines C–D in figure (f) and E–F in figure (c) in the cross-sectional plots (figures (b) and (c)). In order to estimate the domain spacing distributions, histograms of the peak distances in the phase images are shown in figure . The stretched nanofiber exhibited a normal distribution with an average domain spacing of 20.9 nm (figure (a)), whereas the unstretched nanofiber and dip-coated film showed broad distributions with an average of 35 nm, meaning that the distribution of hard segments was nonuniform (figures (b) and (c)).
Figure 7 Phase profiles measured along the lines (a) A–B in the stretched nanofiber (figure (e)), (b) C–D in the unstretched nanofiber (figure (f)) and (c) E–F in the dip-coated film (figure (c)).
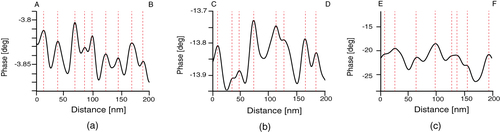
Figure 8 Histograms of the peak-to-peak distance for (a) stretched nanofibers, (b) unstretched nanofibers and (c) the dip-coated film.
The parameters that determine the morphology of the nanofibers include the concentration of the polymer solution, the applied potential, the flow rate and the rotation speed. For unstretched nanofibers prepared with applied potentials and without a tensile force, no alignment of the hard segments was observed, although the morphology and fiber diameter were similar to those of stretched nanofibers. Similarly, no domain alignment was observed for the dip-coated film prepared without a potential or tensile force. These results suggested that among the factors causing changes in the nanoscale phase separation of nanofibers produced using the electrospinning method, the elongational force is the most dominant.
The reason why hard segments align may be that the tensile force applied to the nanofiber increases the domain-packing density and thus promotes the interactions between domains. Further studies are needed in order to elucidate the mechanisms of segment alignment, the relationship between the linearity of hard domain alignment and the tensile force applied by the rotating disc. Furthermore, to fabricate precisely controlled nanofibers, a more quantitative evaluation of this phenomenon is needed.
Conclusion
In this study, we have visualized the phase-separation of PU nanofibers using AFM. We demonstrated that unstretched PU nanofibers prepared by dip coating or without stationary rotation exhibited nonuniformly distributed hard segments, whereas the hard segments of stretched nanofibers prepared with a high-speed collector (2000 rpm) had periodic structures along the fiber axis. To our knowledge, these are the first reported images of segment alignment in stretched nanofibers prepared by electrospinning.
The distribution and density of the hard/soft segments of the PU are expected to greatly affect its properties, such as the hardness, strength, elasticity and protein adsorption. We hope that the knowledge acquired in this study will allow the fiber structure to be controlled at the molecular level and lead to higher functionality of nanofibers.
Related Research Data
References
- RenekerD HChunI 1996 Nanotechnology 7 216 223 216–23 10.1088/0957-4484/7/3/009
- YangFMuruganRWangSRamakrishnaS 2005 Biomaterials 26 2603 2610 2603–10 10.1016/j.biomaterials.2004.06.051
- WangMSinghHHattonT ARutledgeG C 2004 Polymer 45 5505 5514 5505–14 10.1016/j.polymer.2004.06.013
- WangJYaoH BHeDZhangC LYuS H 2012 ACS Appl. Mater. Interfaces 4 1963 1971 1963–71 10.1021/am300391j
- AussawasathienDDongJ HDaiL 2005 Synth. Met. 154 37 40 37–40 10.1016/j.synthmet.2005.07.018
- MatthewsJ AWnekG ESimpsonD GBowlinG L 2002 Biomacromolecules 3 232 238 232–8 10.1021/bm015533u
- TeoW EKotakiMMoX MRamakrishnaS 2005 Nanotechnology 16 918 924 918–24 10.1088/0957-4484/16/6/049
- ShieldsK JBeckmanM JBowlinG LWayneJ S 2004 Tissue Eng. 10 1510 1517 1510–7 10.1089/ten.2004.10.1510
- WuHWuLRowellM WKongDChaJ JMcdonoughJ RZhuJYangYMcGeheeM DCuiY 2010 Nano Lett. 10 4242 4248 4242–8 10.1021/nl102725k
- YuD GWhiteC BLiLWuX MZhuL M 2010 J. Appl. Polym. Sci. 117 1509 1515 1509–15 10.1002/app.32019
- MarxSJoseM VAndersenJ DRussellA J 2011 Biosens. Bioelectron. 26 2981 2986 2981–6 10.1016/j.bios.2010.11.050
- FujitaSShimizuHSuyeS 2012 J. Nanotechnol. 2012 429890
- FennesseyS FFarrisR J 2004 Polymers 45 4217 4225 4217–25 10.1016/j.polymer.2004.04.001
- ChanK H KWongS YLiXZhangY ZLimP CLimC TKotakiMHeC B 2009 J. Phys. Chem. B 113 13179 13185 13179–85 10.1021/jp905820h
- LacroixM RPellerinC 2012 Macromolecules 45 1946 1953 1946–53 10.1021/ma202749d
- KongkhlangTTashiroKKotakiMChirachanchaiS 2008 J. Am. Chem. Soc. 130 15460 15466 15460–66 10.1021/ja804185s
- KakadeM VGivensSGardnerKLeeK HChaseD BRaboltJ F 2007 J. Am. Chem. Soc. 129 2777 2782 2777–82 10.1021/ja065043f
- YoshiokaTDerschRTsujiMSchaperA K 2010 Polymer 51 2383 2389 2383–9 10.1016/j.polymer.2010.03.031
- GuanJ JFujimotoK LSacksM SWagnerW R 2005 Biomaterials 26 3961 3971 3961–71 10.1016/j.biomaterials.2004.10.018
- SanterreJ PWoodhouseKLarocheGLabowR S 2005 Biomaterials 26 7457 7470 7457–70 10.1016/j.biomaterials.2005.05.079
- StokesKMcvenesRAndersonJ M 1995 J. Biomater. Appl. 9 321 354 321–54 10.1177/088532829500900402
- MagonovS NClevelandJElingsVDenleyDWhangboM H 1997 Surf. Sci. 389 201 211 201–11 10.1016/S0039-6028(97)00412-3
- PyunJMatyjaszewskiKWuJKimG MChunS BMatherP T 2003 Polymer 44 2739 2750 2739–50 10.1016/S0032-3861(03)00027-2
- FinniganBJackKCampbellKHalleyPTrussRCaseyPCooksonDKingSMartinD 2005 Macromolecules 38 7386 7396 7386–96 10.1021/ma0508911
- YehFHsiaoB S 2003 Macromolecules 36 1940 1954 1940–54 10.1021/ma0214456
- KojioKUchibaYMitsuiYFurukawaMSasakiSMatsunagaHOkudaH 2007 Macromolecules 40 2625 2628 2625–8 10.1021/ma0700577
- MishraAAswalV KMaitiP 2010 J. Phys. Chem. B 114 5292 5300 5292–300 10.1021/jp100599u
- McleanR SSauerB B 1997 Macromolecules 30 8314 8317 8314–7 10.1021/ma970350e
- KojioKKugumiyaSUchidaYNishinoYFurukawaM 2009 Polym. J. 41 118 124 118–24 10.1295/polymj.PJ2008186